Earth
ID: 4808
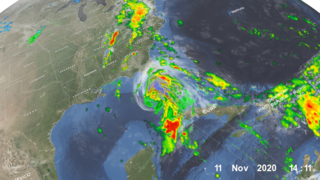
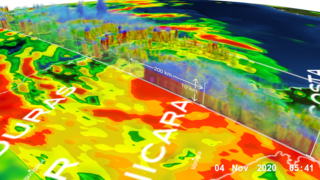
After striking the northeast coast of Nicaragua as a powerful Category 4 storm back on November 3, Hurricane Eta weakened rapidly over Central America but still brought major flooding and triggered numerous landslides that so far have resulted in at least 250 fatalities across the region, according to media reports. Eta was down to a tropical depression when the center re-emerged over the northwestern Caribbean on the evening of November 5. An upper-level trough over the Gulf of Mexico first steered Eta northeastward towards Cuba on the 6th. Because it was disorganized after its trek across Central America, it took time for Eta to respond to the still warm waters of the western Caribbean, but by the morning the November 7, Eta had once again reached tropical storm intensity. Eta crossed central Cuba on the morning of the 8th as a strong tropical storm before emerging over the Florida Straits. The same upper-level trough now began to draw Eta back towards the northwest in the direction of the Florida Keys.
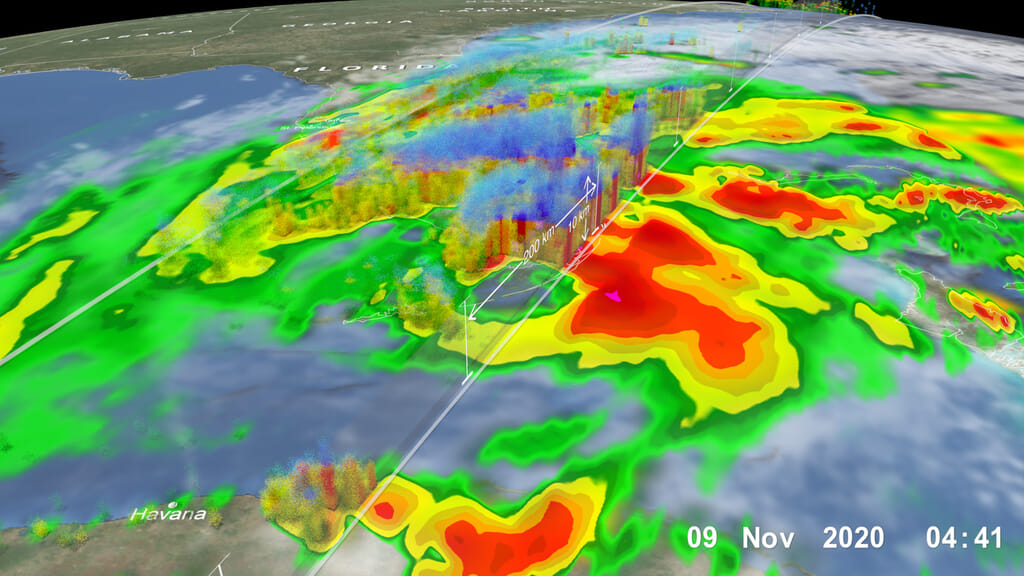
This data visualization provides a detailed look into Eta courtesy of the GPM Core Observatory satellite, which overflew the storm at 11:41 p.m. EST on November 8 (4:41 UTC November 9), just after the center made landfall on Lower Matecumbe Key in the Florida Keys. Rainfall rates derived from the GPM Microwave Imager (GMI) and Dual-Frequency Precipitation Radar (DPR) show that Eta had a rather large but well-defined eye immediately surrounded by very heavy rain rates (shown in red colors) north and east of the center that are part of the eyewall. GPM also shows that the bulk of the rain associated with Eta was contained in several rainbands wrapping across the Florida peninsula well north of the center. Tall cloud towers associated with areas of deep convection (highlighted by the blue isosurface) detected by the DPR show where precipitation-sized particles extended upward within these thunderstorms that are fueling Eta’s circulation. At the time of the GPM overpass, Eta was a strong tropical storm with maximum sustained winds reported at 65 mph by the National Hurricane Center (NHC).
After passing through the Florida Keys, Eta turned southwest and weakened slightly as a result of ingesting some drier air. The latest NHC forecast suggests that Eta could meander over the southeast Gulf of Mexico north of western Cuba for a day or so before drifting slowly northward towards the northern Gulf Coast.
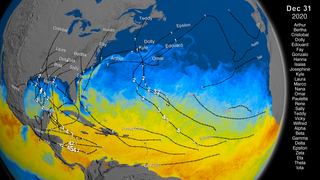
Eta is the 28th named storm of 2020 which beats the 2005 record for the most named storms in a single hurricane season. (See 27 Storms: Arlene to Zeta for a summary of the 2005 hurricane season).
GPM data is archived at https://pps.gsfc.nasa.gov/


NASA/JAXA GPM Satellite Eyes Eta Over Florida
There is a newer version of this story located here: https://svs.gsfc.nasa.gov/4845
This data visualization provides a detailed look into Eta courtesy of the GPM Core Observatory satellite, which overflew the storm at 11:41 p.m. EST on November 8 (4:41 UTC November 9), just after the center made landfall on Lower Matecumbe Key in the Florida Keys. Rainfall rates derived from the GPM Microwave Imager (GMI) and Dual-Frequency Precipitation Radar (DPR) show that Eta had a rather large but well-defined eye immediately surrounded by very heavy rain rates (shown in red colors) north and east of the center that are part of the eyewall. GPM also shows that the bulk of the rain associated with Eta was contained in several rainbands wrapping across the Florida peninsula well north of the center. Tall cloud towers associated with areas of deep convection (highlighted by the blue isosurface) detected by the DPR show where precipitation-sized particles extended upward within these thunderstorms that are fueling Eta’s circulation. At the time of the GPM overpass, Eta was a strong tropical storm with maximum sustained winds reported at 65 mph by the National Hurricane Center (NHC).
After passing through the Florida Keys, Eta turned southwest and weakened slightly as a result of ingesting some drier air. The latest NHC forecast suggests that Eta could meander over the southeast Gulf of Mexico north of western Cuba for a day or so before drifting slowly northward towards the northern Gulf Coast.
Eta is the 28th named storm of 2020 which beats the 2005 record for the most named storms in a single hurricane season. (See 27 Storms: Arlene to Zeta for a summary of the 2005 hurricane season).
GPM data is archived at https://pps.gsfc.nasa.gov/
Newer Version
Older Version
Related

Visualization Credits
Alex Kekesi (Global Science and Technology, Inc.): Lead Data Visualizer
Greg Shirah (NASA/GSFC): Data Visualizer
George Huffman (NASA/GSFC): Lead Scientist
Dalia B Kirschbaum (NASA/GSFC): Scientist
Ryan Fitzgibbons (USRA): Producer
Stephen Lang (SSAI): Lead Writer
Greg Shirah (NASA/GSFC): Data Visualizer
George Huffman (NASA/GSFC): Lead Scientist
Dalia B Kirschbaum (NASA/GSFC): Scientist
Ryan Fitzgibbons (USRA): Producer
Stephen Lang (SSAI): Lead Writer
Please give credit for this item to:
NASA's Scientific Visualization Studio
NASA's Scientific Visualization Studio
Short URL to share this page:
https://svs.gsfc.nasa.gov/4808
Mission:
Global Precipitation Measurement (GPM)
Data Used:
Note: While we identify the data sets used in these visualizations, we do not store any further details nor the data sets themselves on our site.
This item is part of this series:
GPM Animations
Keywords:
DLESE >> Atmospheric science
DLESE >> Hydrology
DLESE >> Natural hazards
SVS >> New Orleans
SVS >> Tropical Storm
GCMD >> Earth Science >> Atmosphere >> Atmospheric Phenomena >> Hurricanes
GCMD >> Earth Science >> Atmosphere >> Precipitation >> Rain
GCMD >> Location >> Cuba
GCMD >> Location >> Florida
SVS >> Hyperwall
NASA Science >> Earth
NASA Earth Science Focus Areas >> Weather and Atmospheric Dynamics
GCMD keywords can be found on the Internet with the following citation: Olsen, L.M., G. Major, K. Shein, J. Scialdone, S. Ritz, T. Stevens, M. Morahan, A. Aleman, R. Vogel, S. Leicester, H. Weir, M. Meaux, S. Grebas, C.Solomon, M. Holland, T. Northcutt, R. A. Restrepo, R. Bilodeau, 2013. NASA/Global Change Master Directory (GCMD) Earth Science Keywords. Version 8.0.0.0.0
https://svs.gsfc.nasa.gov/4808
Mission:
Global Precipitation Measurement (GPM)
Data Used:
GPM/GMI/Surface Precipitation also referred to as: Rain Rates
11/9/2020 4:15 - 4:20Z
Credit:
Data provided by the joint NASA/JAXA GPM mission.
Data provided by the joint NASA/JAXA GPM mission.
GPM/DPR/Ku also referred to as: Volumetric Precipitation data
Observed Data - JAXA - 11/9/2020 4:11 - 4:41Z
Credit:
Data provided by the joint NASA/JAXA GPM mission.
Data provided by the joint NASA/JAXA GPM mission.
also referred to as: IMERG
Data Compilation - NASA/GSFC - 11/8/2020 4:11Z - 11/9/2020 4:41ZGOES-16/ABI
11/8/2020 4:11Z - 11/9/2020 4:41Z
Advanced Baseline Imager (ABI) has 16 spectral bands, including two visible channels, four near-infrared channels and ten infrared channels. It is nearly identical to the imagers on Himawari 8 and Himawari 9.
This item is part of this series:
GPM Animations
Keywords:
DLESE >> Atmospheric science
DLESE >> Hydrology
DLESE >> Natural hazards
SVS >> New Orleans
SVS >> Tropical Storm
GCMD >> Earth Science >> Atmosphere >> Atmospheric Phenomena >> Hurricanes
GCMD >> Earth Science >> Atmosphere >> Precipitation >> Rain
GCMD >> Location >> Cuba
GCMD >> Location >> Florida
SVS >> Hyperwall
NASA Science >> Earth
NASA Earth Science Focus Areas >> Weather and Atmospheric Dynamics
GCMD keywords can be found on the Internet with the following citation: Olsen, L.M., G. Major, K. Shein, J. Scialdone, S. Ritz, T. Stevens, M. Morahan, A. Aleman, R. Vogel, S. Leicester, H. Weir, M. Meaux, S. Grebas, C.Solomon, M. Holland, T. Northcutt, R. A. Restrepo, R. Bilodeau, 2013. NASA/Global Change Master Directory (GCMD) Earth Science Keywords. Version 8.0.0.0.0


