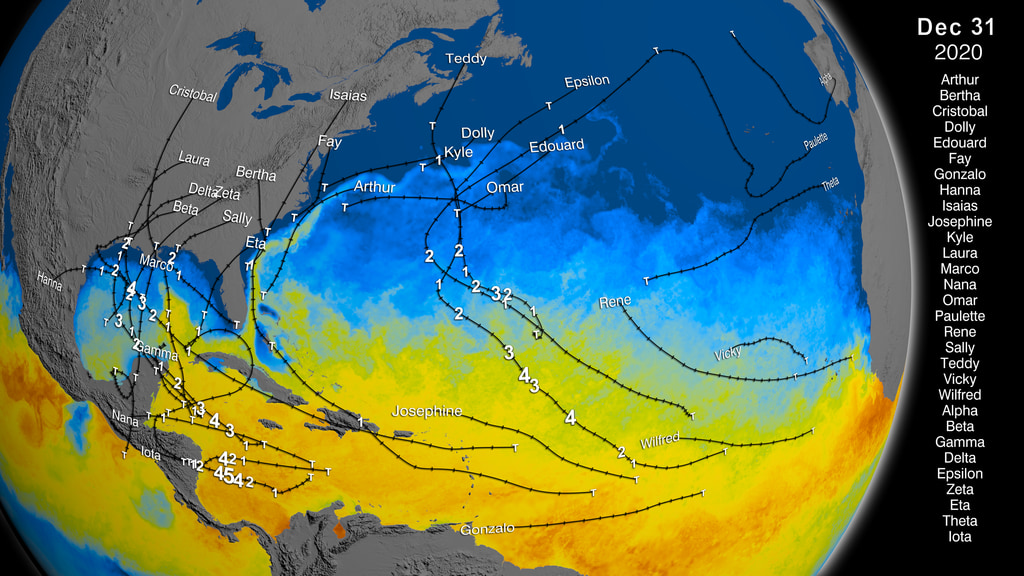
Untitled
- Written by:
- Alison Schuyler Ogden
- Scientific consulting by:
- Jeff Halverson
- View full credits

Images
- 27stormsOL.00774_1024x576.jpg (1024x576)
- 27stormsOL.00774_1024x576_thm.png (80x40)
- 27stormsOL.00774_web.png (320x180)
- 27stormsOL.00774.tif (1920x1080)
Right click movies to download them if they automatically play in your browser.
Find out what fueled one of the worst hurricane seasons in history.
Movies
- 3354_27_Storms-540-MASTER_high.mp4 (960x540)
- 3354_27_Storms-540-MASTER_high.webmhd.webm (960x540)
Images
- 27stormsOL.10990_1024x576.jpg (1024x576)
- 27stormsOL.10990.tif (1920x1080)
Files
- a010829_iPad_movie_3354_27_Storms-540-MASTER/3354_27_Storms-540-MASTER.m3u8
Right click movies to download them if they automatically play in your browser.
This season of storms went well past the typical Nov. 30 "end" of hurricane season.

Images
- 27stormsOL.02765_1024x576.jpg (1024x576)
- 27stormsOL.02765_web.png (320x180)
- 27stormsOL.02765.tif (1920x1080)
Right click movies to download them if they automatically play in your browser.
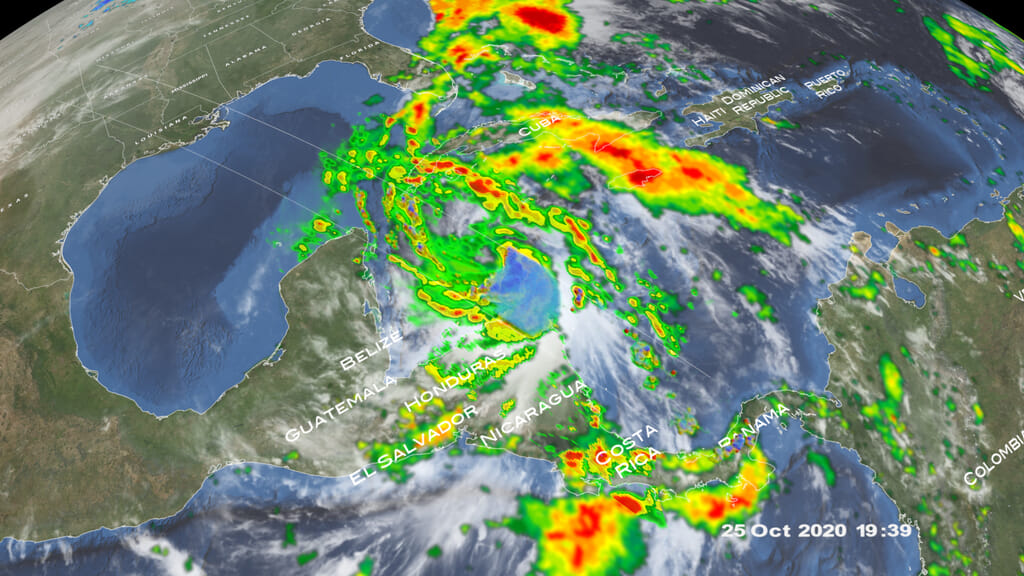
Hurricanes form in the southern Atlantic through a combination of easterly winds off Africa, warm ocean water and other factors.

Images
- 27stormsOL.06446_1024x576.jpg (1024x576)
- 27stormsOL.06446_web.png (320x180)
- 27stormsOL.06446.tif (1920x1080)
Right click movies to download them if they automatically play in your browser.
As hurricanes pass over warm water, they leave trails of cool water in their wake.

Images
- still_wilma_24Oct2005_1024x576.jpg (1024x576)
- still_wilma_24Oct2005_web.png (320x180)
- still_wilma_24Oct2005.tif (1920x1080)
Right click movies to download them if they automatically play in your browser.
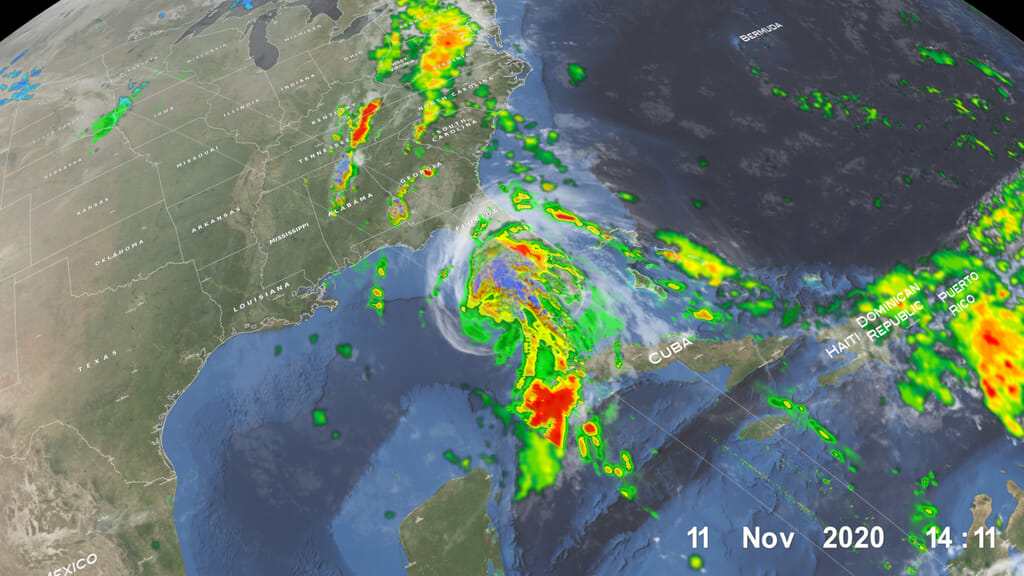
Hurricane Wilma intensified from tropical storm to Category 5 in just over a day. It remains the strongest Atlantic cyclone ever recorded.

Images
- Katrina_08282005.0118_1024x576.jpg (1024x576)
- Katrina_08282005.0118_1920x1080_web.png (320x180)
- Katrina_08282005.0118_1920x1080.tif (1920x1080)
Right click movies to download them if they automatically play in your browser.
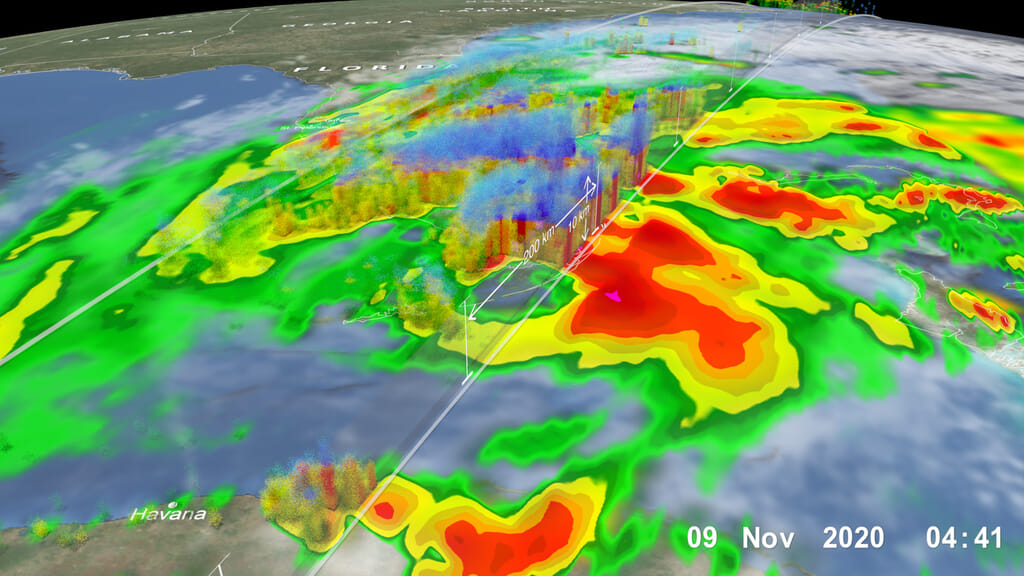
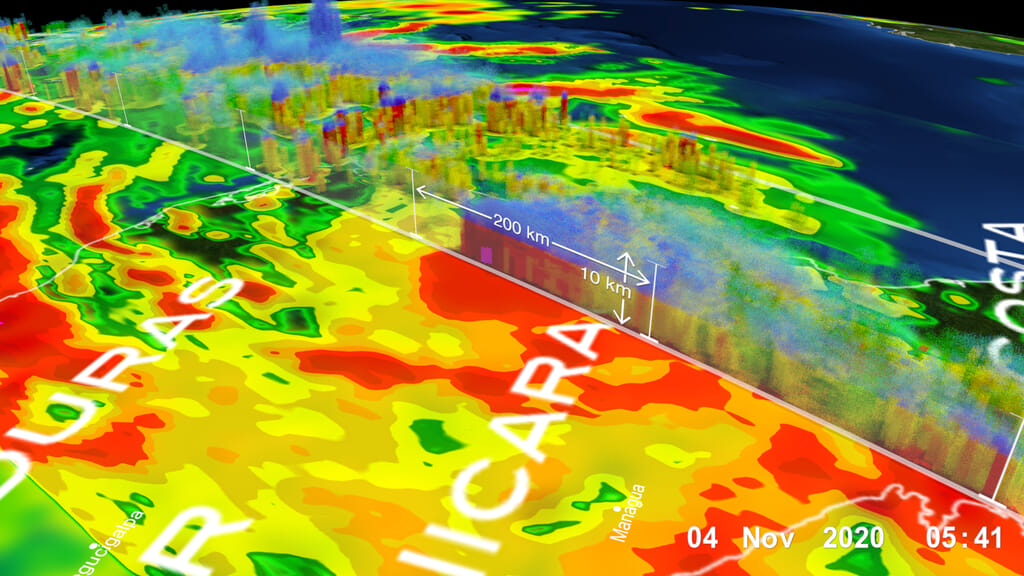
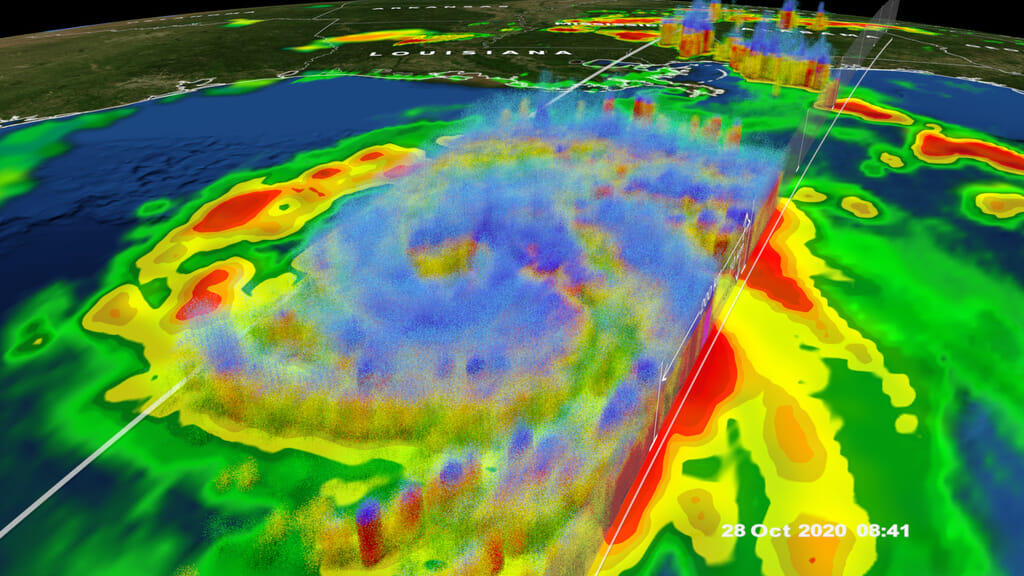
NASA's TRMM spacecraft observed the internal structure of Hurricane Katrina on Aug. 28, 2005.
Credits
Please give credit for this item to:
NASA's Goddard Space Flight Center Scientific Visualization Studio
Animators
- Alex Kekesi (GST)
- Cindy Starr (GST)
- Eric Sokolowsky (GST)
- Greg Shirah (NASA/GSFC)
- Horace Mitchell (NASA/GSFC)
- James W. Williams (GST)
- Jeff de La Beaujardiere (NASA)
- Jesse Allen (SSAI)
- Lori Perkins (NASA/GSFC)
- Marte Newcombe (GST)
- Randall Jones (GST)
- Stuart A. Snodgrass (KBRwyle)
- Tom Bridgman (GST)
Writer
- Alison Schuyler Ogden (NASA/GSFC) [Lead]
Scientist
- Jeff Halverson (JCET UMBC) [Lead]
Narrator
- Michael Starobin (KBRwyle)
Project support
- Joycelyn Thomson Jones (NASA/GSFC)
- Kevin Mahoney (CSC)
Related pages
2020 Hurricane Season
Feb. 24, 2021, 10 p.m.
Read moreData visualization of the 2020 Hurricane Season. Starts on May 1, 2020 just showing Sea Surface Temperatures and cloud cover. Precipitation data then dissolves in as hurricanes are tracked throughout 2020. Hurricane tracks include Hurricane strengths depicted with the letter s respective strength. The visualization then culminates by showing all the storm tracks at once.This video is also available on our YouTube channel. The 2020 Atlantic hurricane season smashed records with an unprecedented 30 named storms, marking the fifth year in a row with above-average hurricane activity. The National Weather Service noted that every mile of the U.S. Atlantic coast was under a tropical watch or warning in 2020. NOAA reported the most billion-dollar disasters in the U.S. in a single year in the 40 years of record-keeping, with significant contributions from the five storms that made landfall in the U.S.This visualization shows the hurricanes and tropical storms of 2020 as seen by NASA’s Integrated Multi-satellitE Retrievals for GPM (IMERG) - a data product combining precipitation observations from infrared and microwave satellite sensors united by the GPM Core Observatory. IMERG provides near real-time half-hourly precipitation estimates at ~10km resolution for the entire globe, helping researchers better understand Earth’s water cycle and extreme weather events, with applications for disaster management, tracking disease, resource management, energy production and food security. IMERG rain rates (in mm/hr) are overlaid on infrared cloud data from the NOAA Climate Prediction Center (CPC) Cloud Composite dataset together with storm tracks from the NOAA National Hurricane Center (NHC) Automated Tropical Cyclone Forecasting (ATCF) model. Sea surface temperatures (SST) are also shown over the oceans, derived from the NASA Multi-sensor Ultra-high Resolution (MUR) dataset, which combines data from multiple geostationary and orbiting satellites. Sea surface temperatures play an important role in hurricane formation and development, with warmer temperatures linked to more intense storms. 2020 was the warmest year on record, and this year’s hurricane season brought many examples of storms that intensified quickly: ten of the 30 named storms showed rapid intensification. Sea Surface Temperature colorbar focusing primarily on temperatures between 20 degrees Celsius to 30 Celsius. Color bar for liquid precipitation rates (ie, rain rates). Shades of green represent low amounts of liquid precipitation, whereas shades of red represent high amounts of precipitation. Color bar for frozen precipitation rates (ie, snow rates). Shades of cyan represent low amounts of frozen precipitation, whereas shades of purple represent high amounts of precipitation. Date overlay Single image layer showing all the tracks fully visible. Animated Hurricane track layer. Animated precipitation layer. Animated cloud layer. Base layer for this data visualization. This layer shows sea surface temperatures throughout the time of the 2020 Hurricane Season.
NASA/JAXA GPM Satellite Sees Eta Make Second Florida Landfall
Nov. 12, 2020, 9 a.m.
Read moreTropical Storm Eta over the Florida west coast on November 11, 2020 at approximately 9:11 EST (14:11Z). After a long and meandering journey over Central America, across central Cuba, and through the Florida Keys, Eta, the 28th named storm and 12th hurricane of the 2020 Atlantic hurricane season, wound up nearly stationary as a moderate tropical storm in the southeastern Gulf of Mexico just north of the western tip of Cuba on the morning of November 10th. Before long however, a deep layer trough located over the western third of the US began to shift eastward, and by the afternoon of the 10th, it started to pull Eta back towards the north and the west coast of the Florida peninsula. As it did so, a combination of warm waters and northwesterly wind shear meant that Eta essentially maintained its intensity as a moderate tropical storm. But by the evening of the 10th, as the northwesterly wind shear abated, Eta began to strengthen, becoming a strong tropical storm overnight. At 7:35 a.m. EST on the morning of November 11, the National Hurricane Center (NHC) reported that Eta had once again become a hurricane.It was just after this time that the NASA / JAXA GPM Core Observatory satellite flew over Eta once again, after having observed the storm over Nicaragua on November 3 and the Florida Keys on November 8. The above animation shows yet another detailed look into Eta s overpass, Eta was a low-strength hurricane with maximum sustained winds reported at 75 mph by NHC.GPM data is archived at https://pps.gsfc.nasa.gov/ Color bar for frozen precipitation rates (ie, snow rates). Shades of cyan represent low amounts of frozen precipitation, whereas shades of purple represent high amounts of precipitation. Color bar for liquid precipitation rates (ie, rain rates). Shades of green represent low amounts of liquid precipitation, whereas shades of red represent high amounts of precipitation.
NASA/JAXA GPM Satellite Eyes Eta Over Florida
Nov. 8, 2020, 7 p.m.
Read moreTropical Storm Eta making landfall over the Florida Keys on Sunday, November 8, 2020 at approximately 23:11Z (11/9/2020 4:11 EST). After striking the northeast coast of Nicaragua as a powerful Category 4 storm back on November 3, Hurricane Eta weakened rapidly over Central America but still brought major flooding and triggered numerous landslides that so far have resulted in at least 250 fatalities across the region, according to media reports. Eta was down to a tropical depression when the center re-emerged over the northwestern Caribbean on the evening of November 5. An upper-level trough over the Gulf of Mexico first steered Eta northeastward towards Cuba on the 6th. Because it was disorganized after its trek across Central America, it took time for Eta to respond to the still warm waters of the western Caribbean, but by the morning the November 7, Eta had once again reached tropical storm intensity. Eta crossed central Cuba on the morning of the 8th as a strong tropical storm before emerging over the Florida Straits. The same upper-level trough now began to draw Eta back towards the northwest in the direction of the Florida Keys.This data visualization provides a detailed look into Eta courtesy of the GPM Core Observatory satellite, which overflew the storm at 11:41 p.m. EST on November 8 (4:41 UTC November 9), just after the center made landfall on Lower Matecumbe Key in the Florida Keys. Rainfall rates derived from the GPM Microwave Imager (GMI) and Dual-Frequency Precipitation Radar (DPR) show that Eta had a rather large but well-defined eye immediately surrounded by very heavy rain rates (shown in red colors) north and east of the center that are part of the eyewall. GPM also shows that the bulk of the rain associated with Eta was contained in several rainbands wrapping across the Florida peninsula well north of the center. Tall cloud towers associated with areas of deep convection (highlighted by the blue isosurface) detected by the DPR show where precipitation-sized particles extended upward within these thunderstorms that are fueling Eta’s circulation. At the time of the GPM overpass, Eta was a strong tropical storm with maximum sustained winds reported at 65 mph by the National Hurricane Center (NHC).After passing through the Florida Keys, Eta turned southwest and weakened slightly as a result of ingesting some drier air. The latest NHC forecast suggests that Eta could meander over the southeast Gulf of Mexico north of western Cuba for a day or so before drifting slowly northward towards the northern Gulf Coast.Eta is the 28th named storm of 2020 which beats the 2005 record for the most named storms in a single hurricane season. (See 27 Storms: Arlene to Zeta for a summary of the 2005 hurricane season).GPM data is archived at https://pps.gsfc.nasa.gov/ Color bar for frozen precipitation rates (ie, snow rates). Shades of cyan represent low amounts of frozen precipitation, whereas shades of purple represent high amounts of precipitation. Color bar for liquid precipitation rates (ie, rain rates). Shades of green represent low amounts of liquid precipitation, whereas shades of red represent high amounts of precipitation.
NASA/JAXA GPM Satellite Eyes Eta Over Nicaragua
Nov. 4, 2020, 11 a.m.
Read moreHurricane Eta (a Category 1) over Nicaragua on 11/4/2020 at approximately 5:25Z. This visualization focuses on the high precipitation southwest of Eta s eye. The Global Precipitation Measurement (GPM) Core Observatory satellite flew over Hurricane Eta at 11:41 p.m. CT on Tuesday, Nov. 3 (0541 UTC Wednesday, Nov. 4). GPM observed the storm’s rainfall with its two unique science instruments: the GPM Microwave Imager (GMI) and Dual-frequency Precipitation Radar (DPR). As the visualization shows, the instruments observed a large swath of heavy precipitation extending to the north and east of the hurricane’s center, which matched earlier forecasts that called for particularly heavy rainfall across the storm’s path.These two- and three-dimensional observations of precipitation structure are the hallmark of the GPM mission – managed jointly by NASA and the Japan Aerospace Exploration Agency (JAXA) -- which aims improve our understanding of the water cycle and extreme weather events, and contributes to improved climate modeling and weather forecasting around the world. These visualizations depict the GPM satellite pass about seven hours after Hurricane Eta made landfall on the coast of Nicaragua as a category 4 storm. Current NHC forecasts indicate Eta will move northwest over Central America then head northeast across the Caribbean Sea, threatening Cuba and Florida early next week.Eta is the 28th named storm of 2020 which beats the 2005 record for the most named storms in a single hurricane season. (See 27 Storms: Arlene to Zeta for a summary of the 2005 hurricane season).GPM data is archived at https://pps.gsfc.nasa.gov/ Hurricane Eta (a Category 1) on 11/4/2020 at approximately 5:25Z. This visualization focuses on the disperse outer bands northeast of the eye. Color bar for frozen precipitation rates (ie, snow rates). Shades of cyan represent low amounts of frozen precipitation, whereas shades of purple represent high amounts of precipitation. Color bar for liquid precipitation rates (ie, rain rates). Shades of green represent low amounts of liquid precipitation, whereas shades of red represent high amounts of precipitation.
NASA/JAXA GPM Satellite Eyes Hurricane Zeta on its way to New Orleans
Oct. 27, 2020, 8 p.m.
Read moreHurricane Zeta on Wednesday October 28th, 2020 at approximately 3:25 am Central Time (8:25 UTC).This video is also available on our YouTube channel. Early in the morning of Oct 28, the GPM satellite flew directly over Hurricane Zeta, which was strengthening in the Gulf of Mexico as it headed for landfall in southeastern Louisiana. The data captured by the Dual-Frequency Precipitation Radar show a symmetric storm, with a clear eye surrounded by tall thunderstorms, an indicator that the storm was strengthening after encountering the Yucatan Peninsula a day earlier. Zeta is the 27th named storm of 2020 which ties the record for the most named storms since 2005. (See 27 Storms: Arlene to Zeta for a summary of the 2005 hurricane season). Hurricane Katrina devastated New Orleans that record-breaking year and now it is poised to take another hit by Hurricane Zeta.GPM data is archived at https://pps.gsfc.nasa.gov/ Color bar for frozen precipitation rates (ie, snow rates). Shades of cyan represent low amounts of frozen precipitation, whereas shades of purple represent high amounts of precipitation. Color bar for liquid precipitation rates (ie, rain rates). Shades of green represent low amounts of liquid precipitation, whereas shades of red represent high amounts of precipitation.
NASA/JAXA GPM Satellite Captures Tropical Storm Zeta off the Yucatan Peninsula
Oct. 27, 2020, noon
Read moreTropical Storm Zeta on October 25th, 2020 at approximately 2:15 Central Time (19:15 UT).This video is also available on our YouTube channel. GPM passed over Tropical Storm Zeta Sunday October 25, 2020 at approximately 2:15pm Central Time (19:15 UTC) as it approached the Yucatan peninsula.Tropical Storm Zeta is the 27th named storm of 2020 which ties the record for the most named storms since 2005. (See 27 Storms: Arlene to Zeta for a summary of the 2005 hurricane season). With several weeks still left in the 2020 hurricane season, 2020 might well surpass this previous record for most named storms in one season.Shortly after this data was collected, Zeta briefly reached Hurricane status before turning back into a Tropical Storm as it swept across the Yucatan peninsula. It is currently heading north through the Gulf of Mexico and has re-intensified into a hurricane before making second landfall somewhere on the Gulf coast.GPM data is archived at https://pps.gsfc.nasa.gov/ Color bar for frozen precipitation rates (ie, snow rates). Shades of cyan represent low amounts of frozen precipitation, whereas shades of purple represent high amounts of precipitation. Color bar for liquid precipitation rates (ie, rain rates). Shades of green represent low amounts of liquid precipitation, whereas shades of red represent high amounts of precipitation.
27 Storms: Arlene to Zeta
May 30, 2006, 8 p.m.
Read moreFull version with audio and annotationsThis video is also available on our YouTube channel. Many records were broken during the 2005 Atlantic hurricane season including the most hurricanes ever, the most category 5 hurricanes, and the most intense hurricane ever recorded in the Atlantic as measured by atmospheric pressure. This visualization shows all 27 named storms that formed in the 2005 Atlantic hurricane season and examines some of the conditions that made hurricane formation so favorable.The animation begins by showing the regions of warm water that are favorable for storm development advancing northward through the peak of hurricane season and then receding as the waters cool. The thermal energy in these warm waters powers the hurricanes. Strong shearing winds in the troposphere can disrupt developing young storms, but measurements indicate that there was very little shearing wind activity in 2005 to impede storm formation.Sea surface temperatures, clouds, storm tracks, and hurricane category labels are shown as the hurricane season progresses.This visualization shows some of the actual data that NASA and NOAA satellites measured in 2005 — data used to predict the paths and intensities of hurricanes. Satellite data play a vital role in helping us understand the land, ocean, and atmosphere systems that have such dramatic effects on our lives.NOTE: This animation shows the named storms from the 2005 hurricane season. During a re-analysis of 2005, NOAA played in the SIGGRAPH 2007 Computer Animation Festival in August 2007. It was also a finalist in the 2006 NSF Science and Engineering Visualization Challenge. Sea surface temperatures only(without color bar) Sea surface temperatures and clouds with annotations except storm menu and strengths Hurricane Katrina on 28 August 2005 Hurricane Rita on 22 September 2005 Hurricane Wilma on 24 October 2005 Color bar for sea surface temperatures in degrees F: blues are less than 80 , white is about 82, yellows and reds are above 82 Sea surface temperature and clouds with no annotations other than storm tracks.