Earth Day 2020: Sea Surface Temperature (SST) from January 2016 through March 2020
Sea Surface Temperature - composited version with all layers included
This video is also available on our YouTube channel.
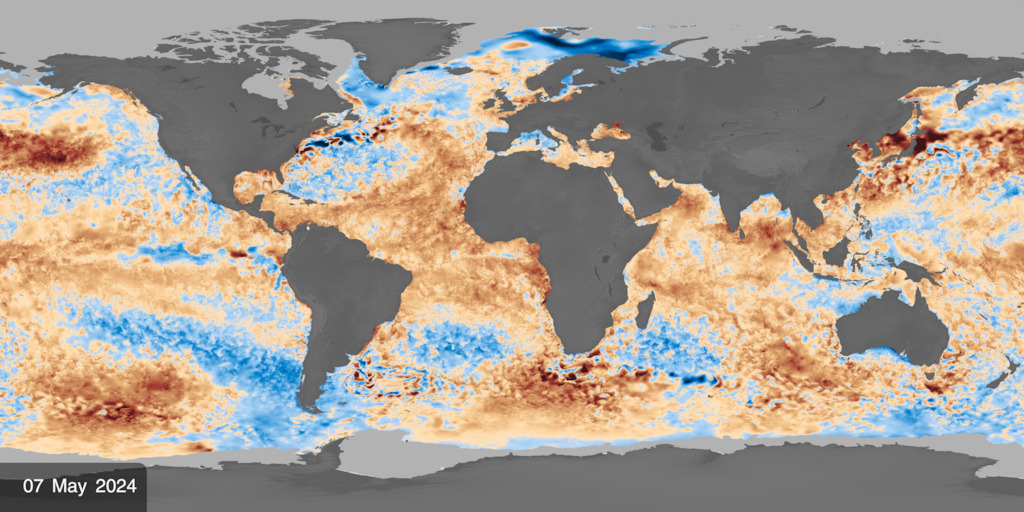
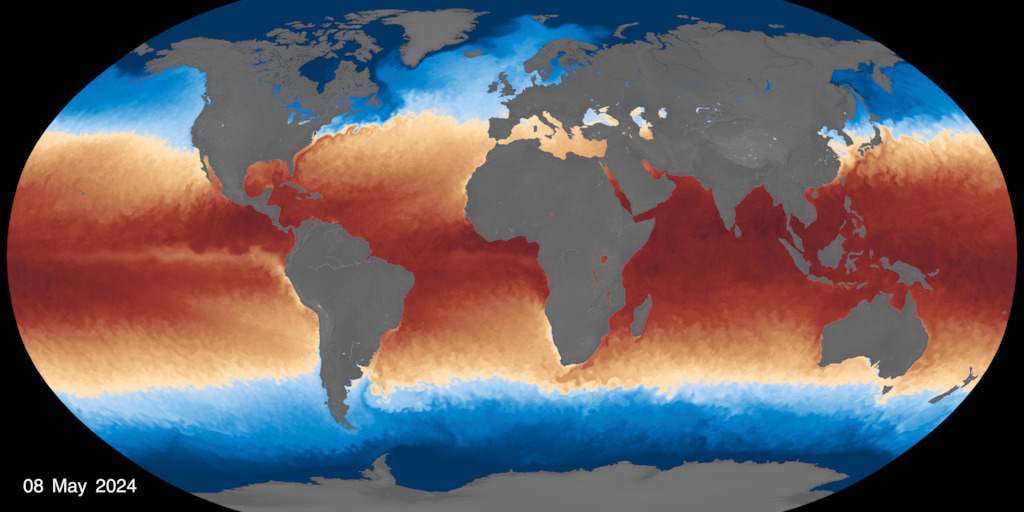
This visualization shows sea surface temperature (SST) data of the oceans from January 2016 through March 2020. The data set used is from the Jet Propulsion Laboratory (JPL) Multi-scale Ultra-high Resolution (MUR) Sea Surface Temperature Analysis. The ocean temperatures are displayed between 0 degrees celcius (C) and 32 degrees C.
This visualization was created in part to support Earth Day 2020 media releases.
Sea Surface Temperature (SST) data layer with alpha
Dates layer with alpha
Background layer

Sea Surface Temperature color bar: color range is blue - cyan -gray - yellow - red; value range is 0 to 32 degrees Celcius
Credits
Please give credit for this item to:
NASA's Scientific Visualization Studio
-
Visualizers
- Greg Shirah (NASA/GSFC)
- Horace Mitchell (NASA/GSFC)
-
Producer
- Ryan Fitzgibbons (USRA)
Release date
This page was originally published on Tuesday, April 21, 2020.
This page was last updated on Tuesday, April 23, 2024 at 12:15 AM EDT.
Series
This visualization can be found in the following series:Datasets used in this visualization
-
MUR SST (Multi-scale Ultra-high Resolution (MUR) Sea Surface Temperature (SST) Analysis)
ID: 845
Note: While we identify the data sets used in these visualizations, we do not store any further details, nor the data sets themselves on our site.
Related
- ID: 5176
 Visualization
 - ID: 5101
 Visualization
Used as a Source In
- ID: 13814
 Produced Video
 - ID: 13799
![Music: Organic Machine by Bernhard Hering [GEMA] and Matthias Kruger [GEMA]Complete transcript available.](/vis/a010000/a013700/a013799/2020Temp.png) Produced Video
Produced Video - ID: 13586
 Produced Video