NASA/JAXA GPM Satellite Sees Eta Make Second Florida Landfall
Tropical Storm Eta over the Florida west coast on November 11, 2020 at approximately 9:11 EST (14:11Z).
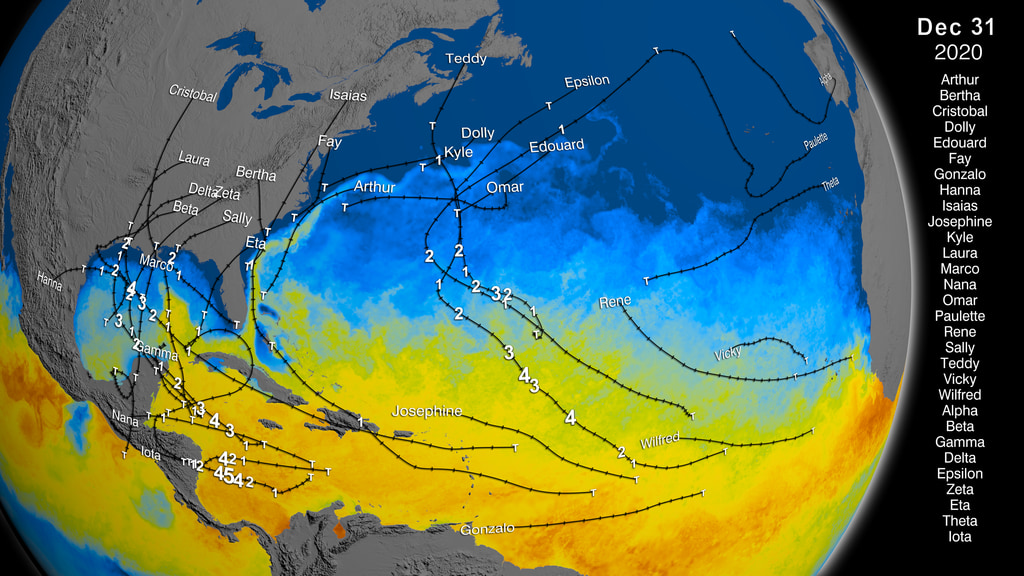
After a long and meandering journey over Central America, across central Cuba, and through the Florida Keys, Eta, the 28th named storm and 12th hurricane of the 2020 Atlantic hurricane season, wound up nearly stationary as a moderate tropical storm in the southeastern Gulf of Mexico just north of the western tip of Cuba on the morning of November 10th. Before long however, a deep layer trough located over the western third of the US began to shift eastward, and by the afternoon of the 10th, it started to pull Eta back towards the north and the west coast of the Florida peninsula. As it did so, a combination of warm waters and northwesterly wind shear meant that Eta essentially maintained its intensity as a moderate tropical storm. But by the evening of the 10th, as the northwesterly wind shear abated, Eta began to strengthen, becoming a strong tropical storm overnight. At 7:35 a.m. EST on the morning of November 11, the National Hurricane Center (NHC) reported that Eta had once again become a hurricane.
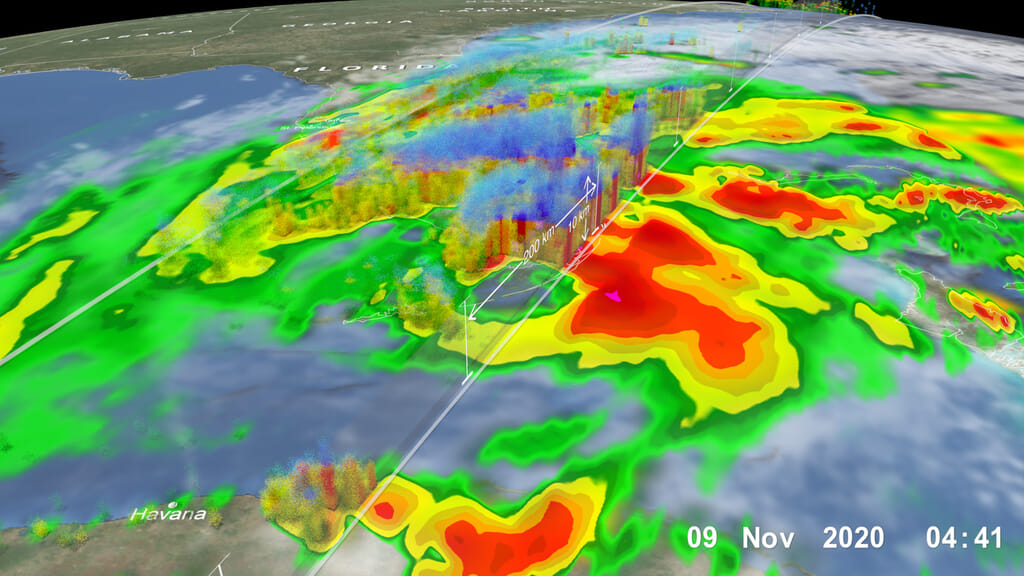
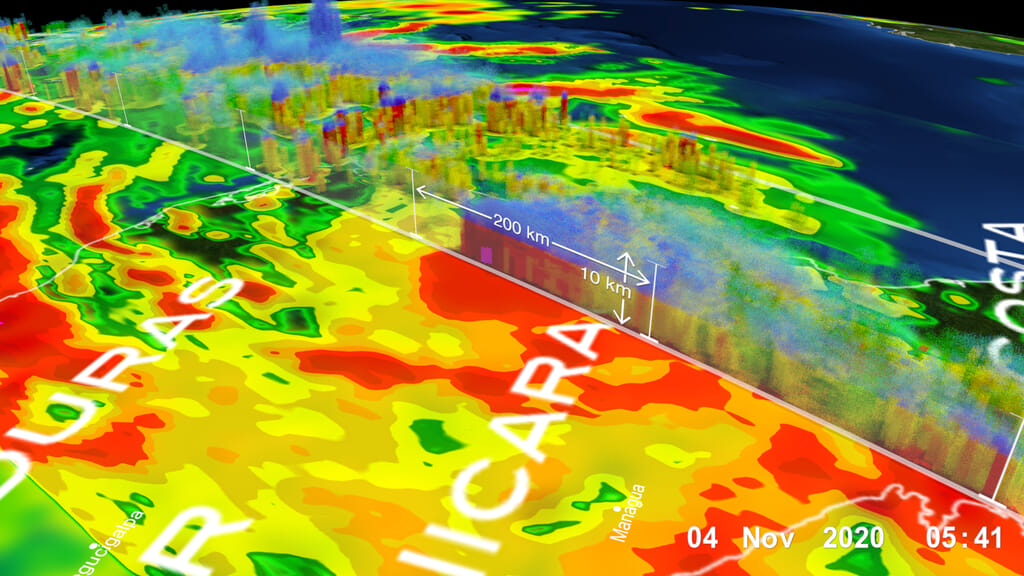
It was just after this time that the NASA / JAXA GPM Core Observatory satellite flew over Eta once again, after having observed the storm over Nicaragua on November 3 and the Florida Keys on November 8. The above animation shows yet another detailed look into Eta's precipitation courtesy of GPM, which overflew the storm at 9:11 a.m. EST (14:11 UTC) on November 11.
Rainfall rates derived from the GPM Microwave Imager (GMI) and Dual-frequency Precipitation Radar (DPR) show all of Eta’s heavy rainbands (in red and orange) wrapping around mainly the eastern and northern sides of the storm. Tall cloud towers associated with areas of deep convection (in blue), where the DPR detected frozen precipitation particles extending upward within these thunderstorms, are located north and east of the center. Eta’s overall asymmetric structure is consistent with a storm still in the process of maturing.
However, Eta would not be a hurricane for long, as dry air weakened Eta back to a tropical storm by the early afternoon. The combination of increasing wind shear, cooler waters and Eta’s close proximity to land meant that Eta made landfall as a moderate tropical storm with sustained winds reported at 50 mph by National Hurricane Center (NHC) when it crossed the Florida coast near Cedar Key around 4:00 a.m. EST on November 12.
At the time of GPM's overpass, Eta was a low-strength hurricane with maximum sustained winds reported at 75 mph by NHC.
GPM data is archived at https://pps.gsfc.nasa.gov/

Color bar for frozen precipitation rates (ie, snow rates). Shades of cyan represent low amounts of frozen precipitation, whereas shades of purple represent high amounts of precipitation.
Color bar for liquid precipitation rates (ie, rain rates). Shades of green represent low amounts of liquid precipitation, whereas shades of red represent high amounts of precipitation.
Credits
Please give credit for this item to:
NASA's Scientific Visualization Studio
-
Data visualizers
- Alex Kekesi (Global Science and Technology, Inc.)
- Greg Shirah (NASA/GSFC)
-
Scientists
- George Huffman (NASA/GSFC)
- Dalia B Kirschbaum (NASA/GSFC)
-
Producer
- Ryan Fitzgibbons (USRA)
-
Writer
- Stephen Lang (SSAI)
Release date
This page was originally published on Thursday, November 12, 2020.
This page was last updated on Wednesday, November 15, 2023 at 12:16 AM EST.
Missions
This visualization is related to the following missions:Series
This visualization can be found in the following series:Datasets used in this visualization
-
Rain Rates (Surface Precipitation) [GPM: GMI]
ID: 822Credit: Data provided by the joint NASA/JAXA GPM mission.
See all pages that use this dataset -
Volumetric Precipitation data (Ku) [GPM: DPR]
ID: 830Credit: Data provided by the joint NASA/JAXA GPM mission.
See all pages that use this dataset -
IMERG
ID: 863This dataset can be found at: http://pmm.nasa.gov/sites/default/files/document_files/IMERG_ATBD_V4.4.pdf
See all pages that use this dataset -
[GOES-16: ABI]
ID: 978Advanced Baseline Imager (ABI) has 16 spectral bands, including two visible channels, four near-infrared channels and ten infrared channels. It is nearly identical to the imagers on Himawari 8 and Himawari 9.
See all pages that use this dataset
Note: While we identify the data sets used in these visualizations, we do not store any further details, nor the data sets themselves on our site.
Related
- ID: 4884
 Visualization
 - ID: 10829
 Produced Video
Older Versions
- ID: 4808
 Visualization
 - ID: 4876
 Visualization