Earth
ID: 5116
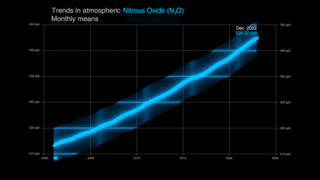
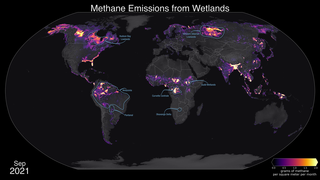
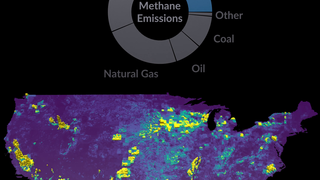
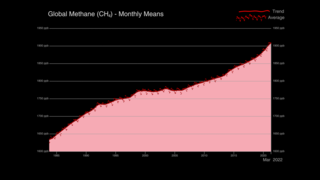
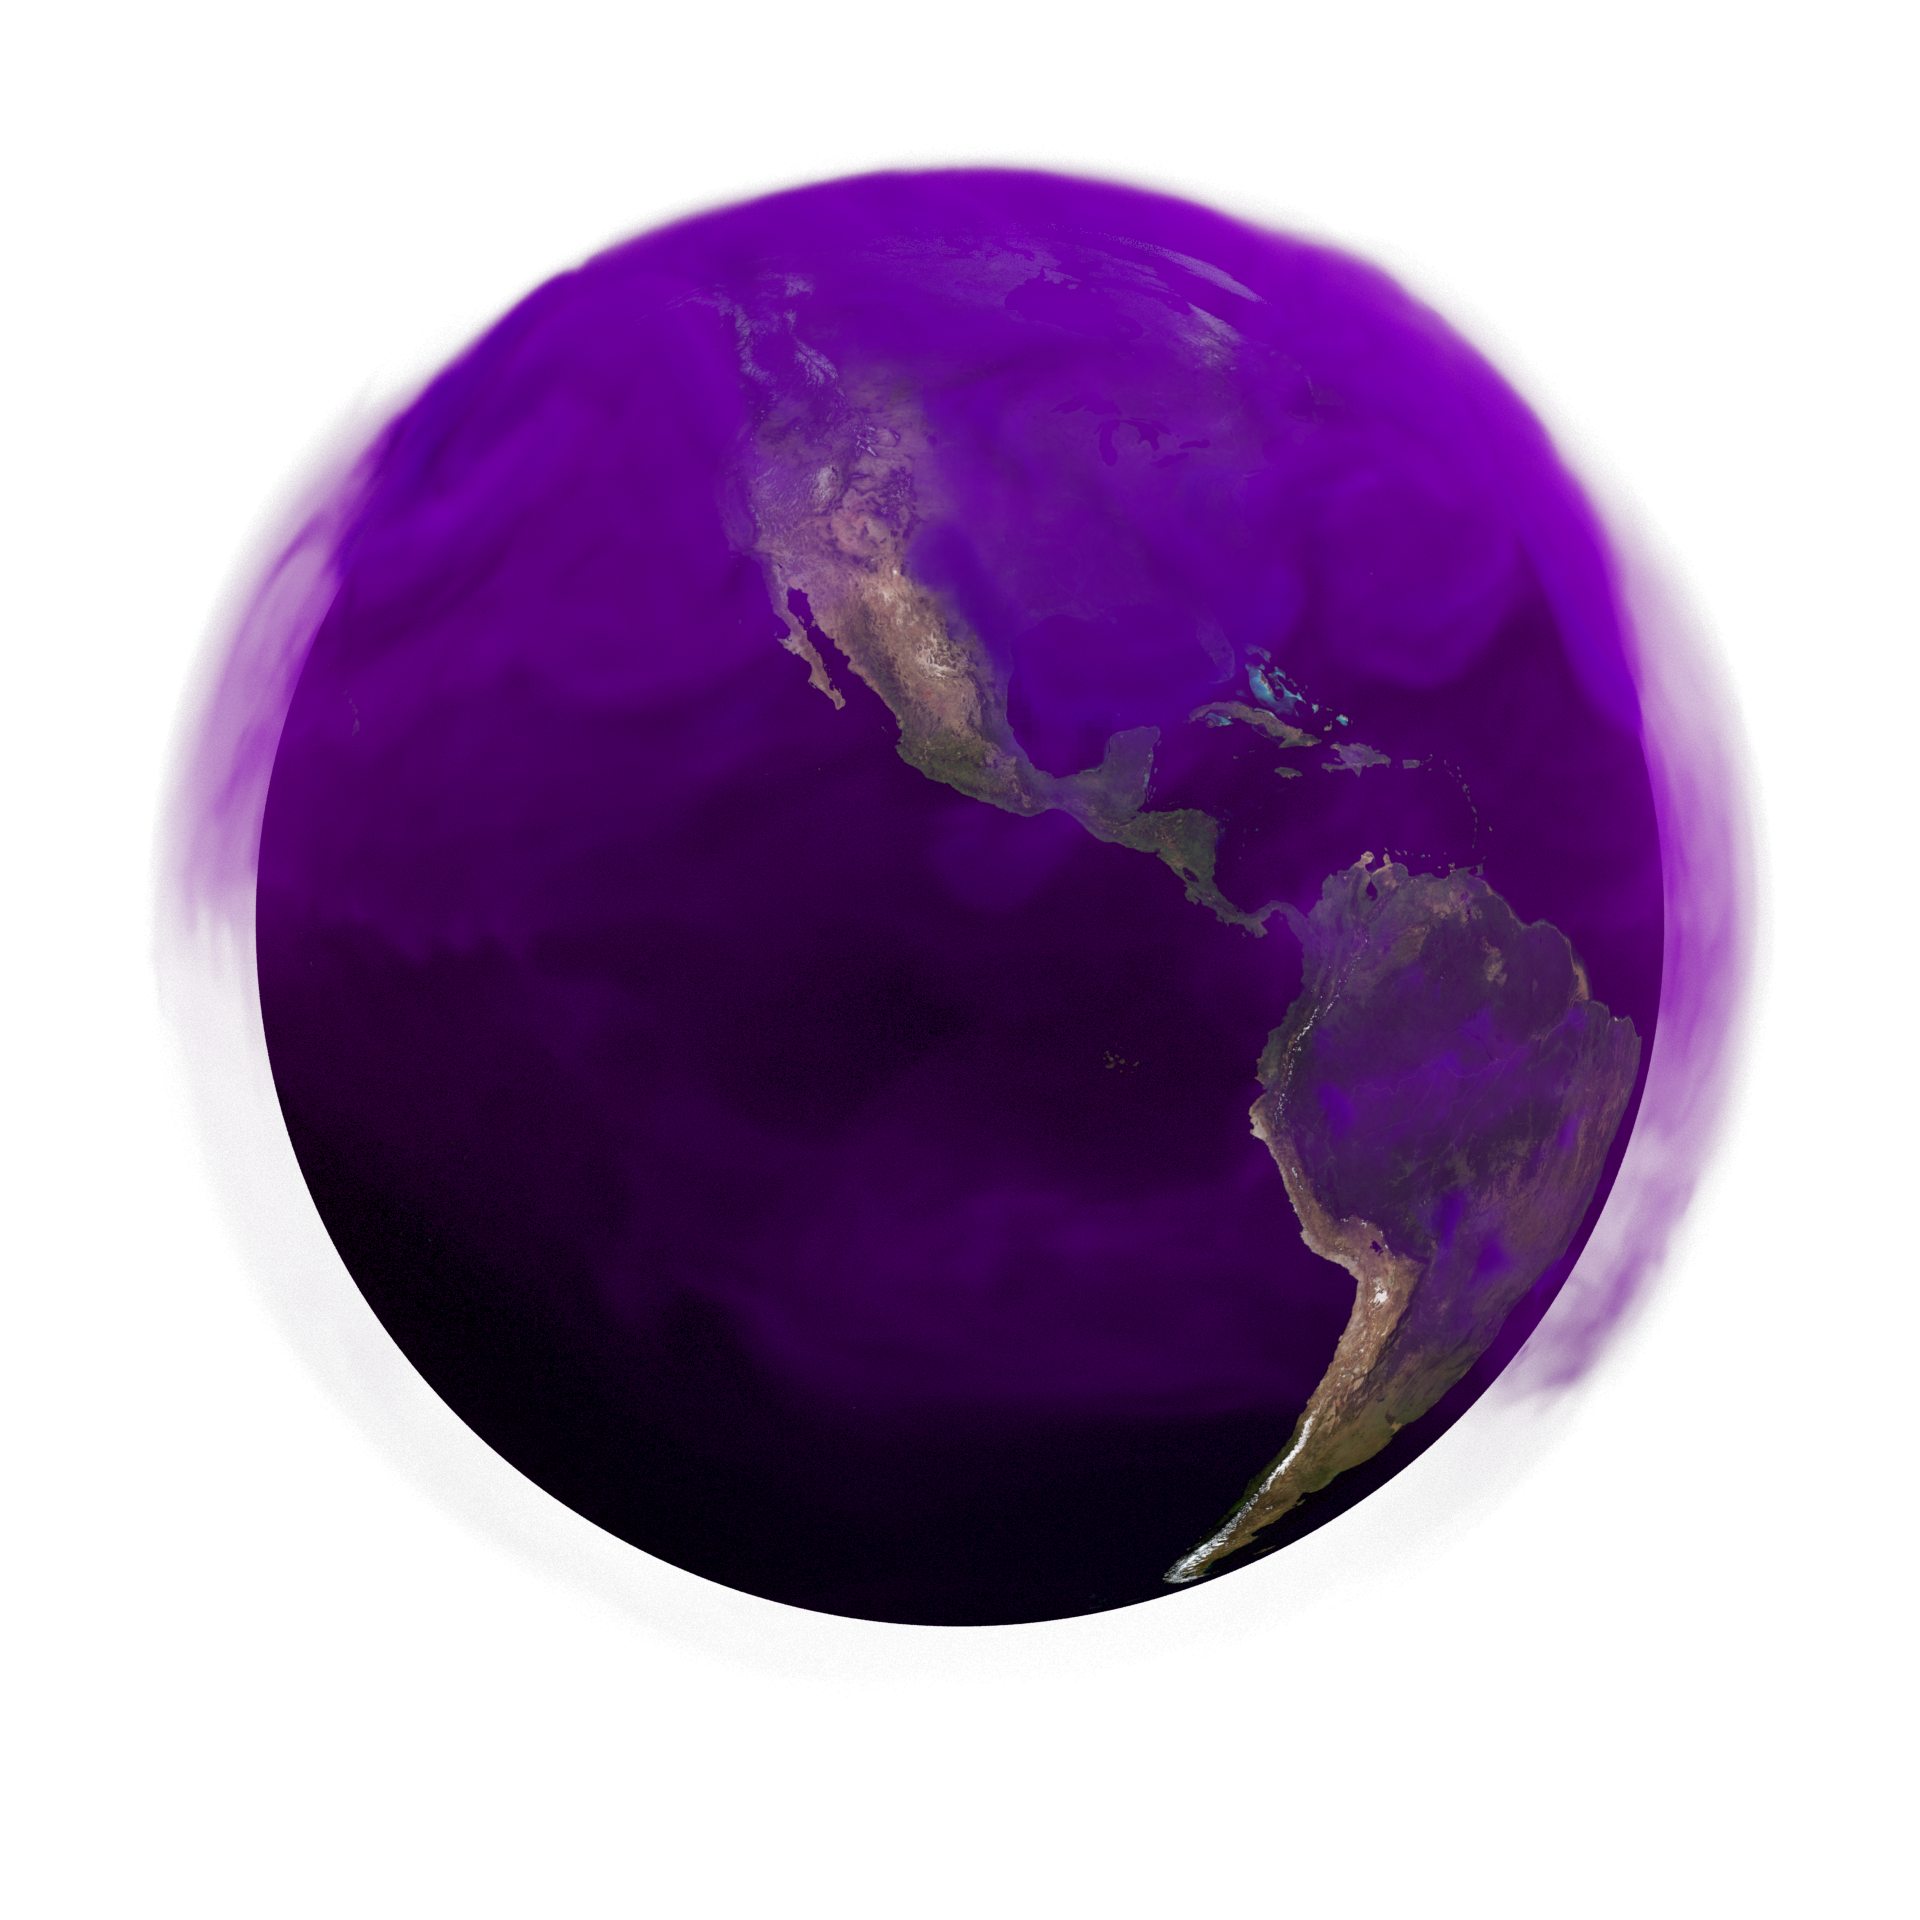
Methane (CH₄) is a powerful greenhouse gas that traps heat 28 times more effectively than carbon dioxide over a 100-year timescale. Concentrations of methane have increased by more than 150% since industrial activities and intensive agriculture began. After carbon dioxide, methane is responsible for about 20% of climate change in the twentieth century. Methane is produced under conditions where little to no oxygen is available. About 30% of methane emissions are produced by wetlands, including ponds, lakes and rivers. Another 20% is produced by agriculture, due to a combination of livestock, waste management and rice cultivation. Activities related to oil, gas, and coal extraction release an additional 30%. The remainder of methane emissions come from minor sources such as wildfire, biomass burning, permafrost, termites, dams, and the ocean. Scientists around the world are working to better understand the budget of methane with the ultimate goals of reducing greenhouse gas emissions and improving prediction of environmental change.
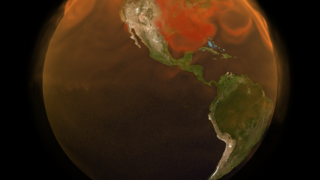
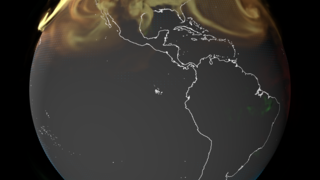
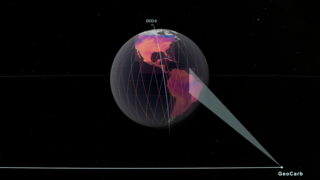
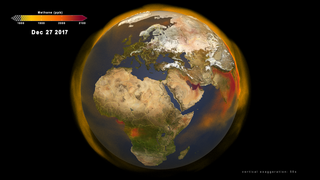
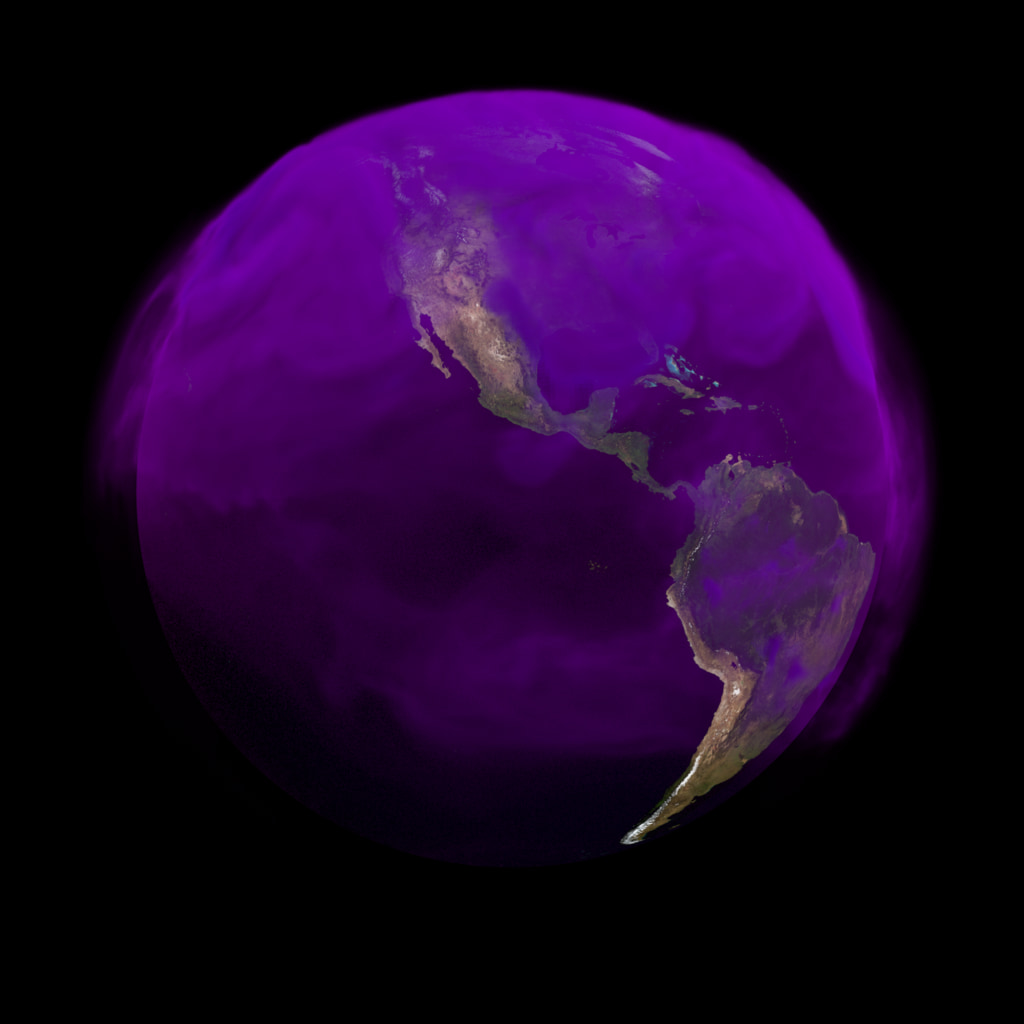
The NASA SVS visualization presented here shows the complex patterns of methane emissions produced around the globe and throughout the year from the different sources described above. The visualization was created using output from the Global Modeling and Assimilation Office, GMAO, GEOS modeling system, developed and maintained by scientists at NASA. Wetland emissions were estimated by the LPJ-wsl model, which simulates the temperature and moisture dependent methane emission processes using a variety of satellite data to determine what parts of the globe are covered by wetlands. Other methane emission sources come from inventories of human activity.
Data Sources:
Global Atmospheric Methane (CH₄)
The NASA SVS visualization presented here shows the complex patterns of methane emissions produced around the globe and throughout the year from the different sources described above. The visualization was created using output from the Global Modeling and Assimilation Office, GMAO, GEOS modeling system, developed and maintained by scientists at NASA. Wetland emissions were estimated by the LPJ-wsl model, which simulates the temperature and moisture dependent methane emission processes using a variety of satellite data to determine what parts of the globe are covered by wetlands. Other methane emission sources come from inventories of human activity.
Data Sources:
- Volumetric Methane extracted from NASA's Goddard Earth Observing System (GEOS) model, which is produced by the Global Modeling and Assimilation Office. The visualization featured on this page utilizes data for the period January 1 - December 31, 2021.
- Blue Marble: Next Generation was produced by Reto Stöckli, NASA Earth Observatory (NASA Goddard Space Flight Center). Citation: Reto Stöckli, Eric Vermote, Nazmi Saleous, Robert Simmon and David Herring.
The Blue Marble Next Generation – A true color earth dataset including seasonal dynamics from MODIS, October 17, 2005. The visualization on this page utilizes monthly Blue Marble data to map the water and land bodies around the globe and show seasonal changes. - Global 30 Arc-Second Elevation (GTOPO 30) from U.S. Geological Survey (USGS). GTOPO30 is a global raster digital elevation model (DEM) with a horizontal grid spacing of 30 arc seconds (approximately 1 kilometer). GTOPO30 was derived from several raster and vector sources of topographic information. The data-driven visualization featured on this page utilizes the GTOPO30 model to represent the three-dimensional features of over land terrain and submarine topography world-wide. doi:10.5066/F7DF6PQS.
Related


Visualization Credits
Helen-Nicole Kostis (USRA): Lead Visualizer
Andrew J Christensen (SSAI): Visualizer
Lesley Ott (NASA/GSFC): Lead Scientist
Brad Weir (USRA): Lead Scientist
Laurence Schuler (ADNET Systems, Inc.): Technical Support
Ian Jones (ADNET Systems, Inc.): Technical Support
Andrew J Christensen (SSAI): Visualizer
Lesley Ott (NASA/GSFC): Lead Scientist
Brad Weir (USRA): Lead Scientist
Laurence Schuler (ADNET Systems, Inc.): Technical Support
Ian Jones (ADNET Systems, Inc.): Technical Support
Please give credit for this item to:
NASA's Scientific Visualization Studio
NASA's Scientific Visualization Studio
Science Paper:
Sweeney, C., Chatterjee, A., Wolter, S., McKain, K., Bogue, R., Conley, S., Newberger, T., Hu, L., Ott, L., Poulter, B., Schiferl, L., Weir, B., Zhang, Z., and Miller, C. E.: Using atmospheric trace gas vertical profiles to evaluate model fluxes: a case study of Arctic-CAP observations and GEOS simulations for the ABoVE domain, Atmos. Chem. Phys., 22, 6347–6364, https://doi.org/10.5194/acp-22-6347-2022, 2022
Short URL to share this page:
https://svs.gsfc.nasa.gov/5116
Data Used:
Note: While we identify the data sets used in these visualizations, we do not store any further details nor the data sets themselves on our site.
Keywords:
DLESE >> Atmospheric science
SVS >> Methane
SVS >> Volume
GCMD >> Earth Science >> Human Dimensions >> Environmental Impacts
SVS >> Model Data
SVS >> GMAO
SVS >> Greenhouse Gases
SVS >> Atmospheric Science
NASA Science >> Earth
NASA Earth Science Focus Areas >> Atmospheric Composition
NASA Earth Science Focus Areas >> Carbon Cycle and Ecosystems
SVS >> Earth Information Center
GCMD keywords can be found on the Internet with the following citation: Olsen, L.M., G. Major, K. Shein, J. Scialdone, S. Ritz, T. Stevens, M. Morahan, A. Aleman, R. Vogel, S. Leicester, H. Weir, M. Meaux, S. Grebas, C.Solomon, M. Holland, T. Northcutt, R. A. Restrepo, R. Bilodeau, 2013. NASA/Global Change Master Directory (GCMD) Earth Science Keywords. Version 8.0.0.0.0
Sweeney, C., Chatterjee, A., Wolter, S., McKain, K., Bogue, R., Conley, S., Newberger, T., Hu, L., Ott, L., Poulter, B., Schiferl, L., Weir, B., Zhang, Z., and Miller, C. E.: Using atmospheric trace gas vertical profiles to evaluate model fluxes: a case study of Arctic-CAP observations and GEOS simulations for the ABoVE domain, Atmos. Chem. Phys., 22, 6347–6364, https://doi.org/10.5194/acp-22-6347-2022, 2022
Short URL to share this page:
https://svs.gsfc.nasa.gov/5116
Data Used:
GTOPO30 Topography and Bathymetry
Data Compilation - USGSTerra and Aqua/MODIS/Blue Marble: Next Generation also referred to as: BMNG
Credit:
The Blue Marble data is courtesy of Reto Stockli (NASA/GSFC).
The Blue Marble data is courtesy of Reto Stockli (NASA/GSFC).
GMAO GEOS Atmospheric Methane also referred to as: GMAO GEOS Atmospheric Methane
Model - GMAOKeywords:
DLESE >> Atmospheric science
SVS >> Methane
SVS >> Volume
GCMD >> Earth Science >> Human Dimensions >> Environmental Impacts
SVS >> Model Data
SVS >> GMAO
SVS >> Greenhouse Gases
SVS >> Atmospheric Science
NASA Science >> Earth
NASA Earth Science Focus Areas >> Atmospheric Composition
NASA Earth Science Focus Areas >> Carbon Cycle and Ecosystems
SVS >> Earth Information Center
GCMD keywords can be found on the Internet with the following citation: Olsen, L.M., G. Major, K. Shein, J. Scialdone, S. Ritz, T. Stevens, M. Morahan, A. Aleman, R. Vogel, S. Leicester, H. Weir, M. Meaux, S. Grebas, C.Solomon, M. Holland, T. Northcutt, R. A. Restrepo, R. Bilodeau, 2013. NASA/Global Change Master Directory (GCMD) Earth Science Keywords. Version 8.0.0.0.0


