Earth
ID: 5041
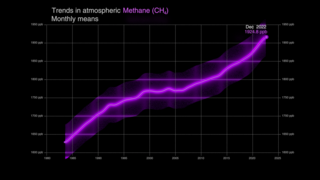
Methane is the second most important greenhouse gas contributing to climate change. While emissions are substantially lower than for carbon dioxide, the biggest driver of climate change, methane is more efficient at trapping heat on a molecule by molecule basis. As a result, understanding the sources of methane and how they can be reduced, quickly, is a major effort of policymakers and environmental managers around the world.
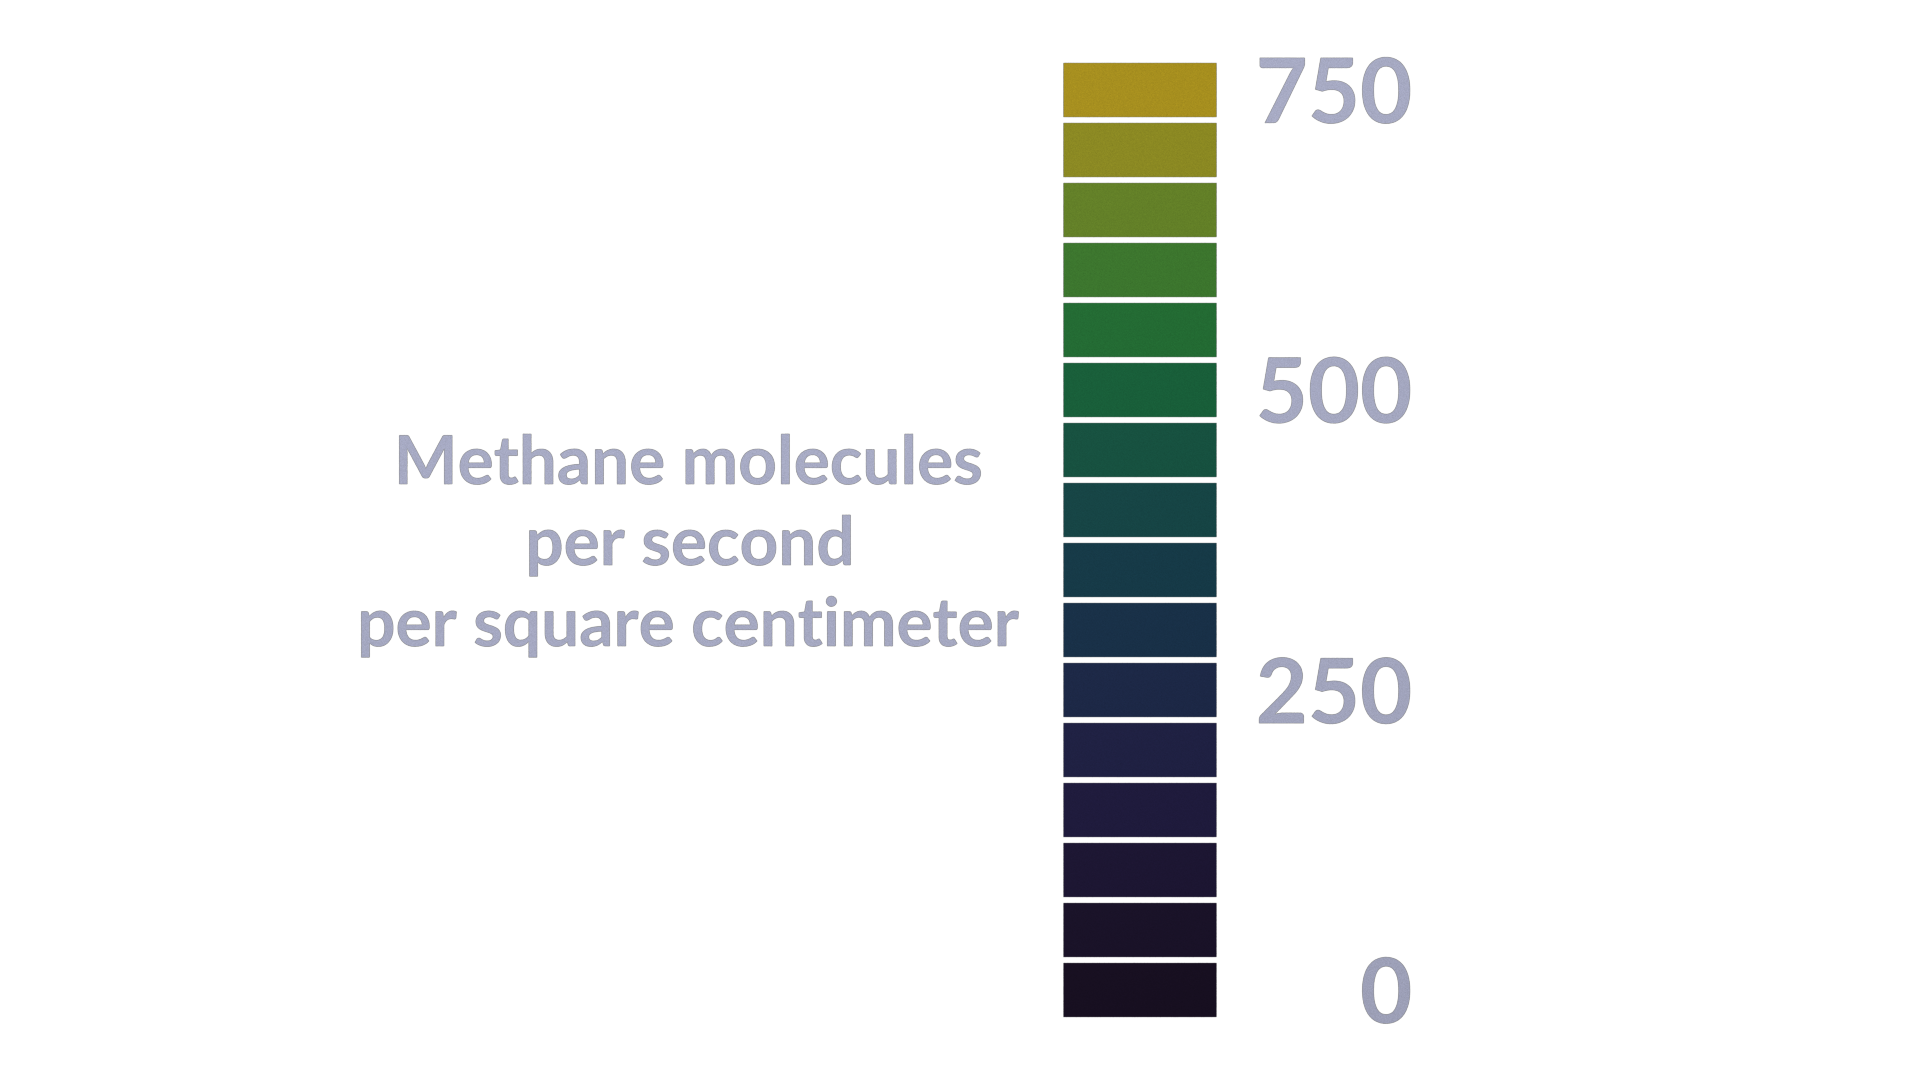
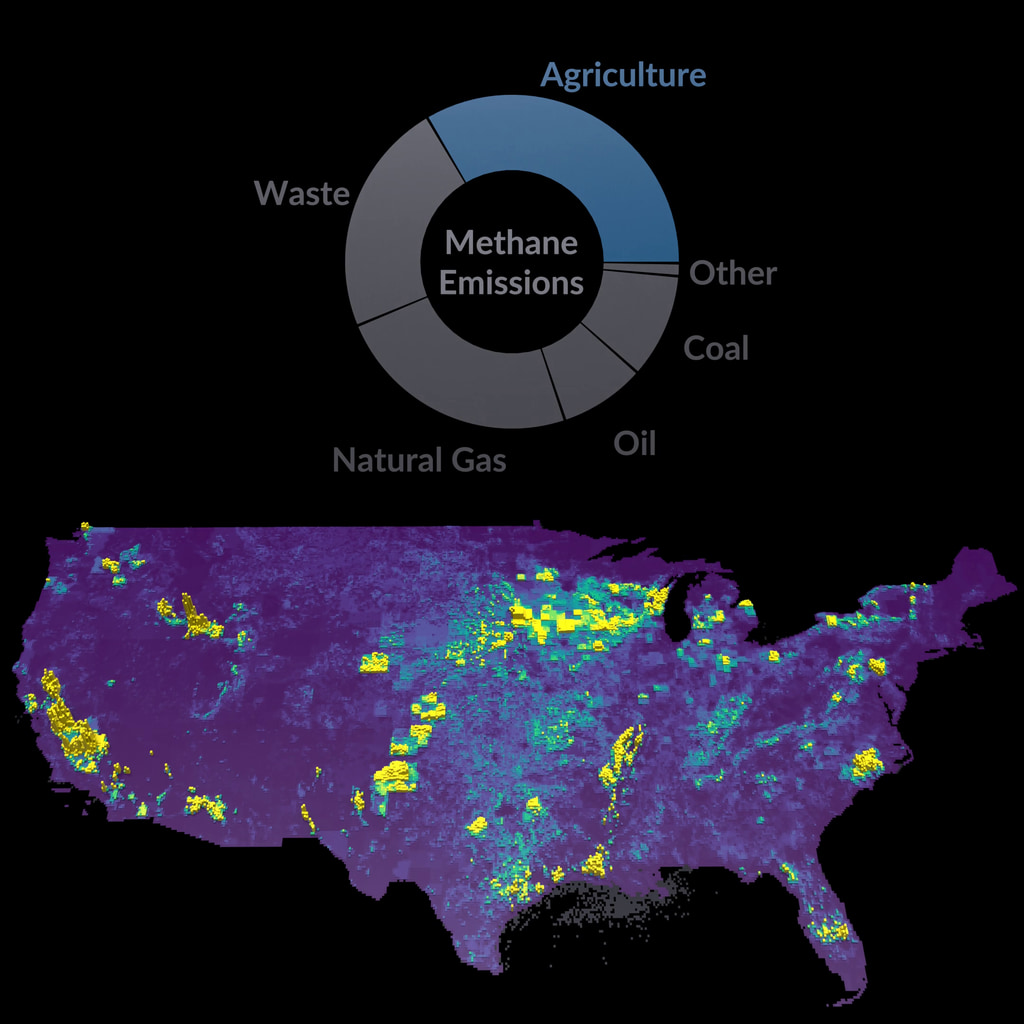
This visualization presents gridded methane emissions across the United States for the year 2012. The gridded methane inventory is designed to be consistent with EPA’s 2016 Inventory of U.S. Greenhouse Gas Emissions and Sinks for the year 2012, which presents national totals for different source types. Gridded estimates with 0.1 degree spatial resolution are produced using a wide range of databases at the state, county, local, and point source level to allocate the spatial and temporal distribution of emissions for individual source types. Gridded inventories, developed with support from NASA’s Carbon Monitoring System, help researchers use satellite, airborne, and in situ observations to independently evaluate EPA inventories and provide recommendations on refinements that may be needed. Additional detail and dataset access are available at the EPA website.
The gridded inventory presents totals for different major methane source types. Agriculture emissions in this visualization include manure management, enteric fermentation, rice cultivation, and field burning. Waste emissions include landfills, wastewater treatment, and composting. Natural Gas emissions include emissions from production, processing, and transmission. Coal emissions include both active and abandoned coal mines.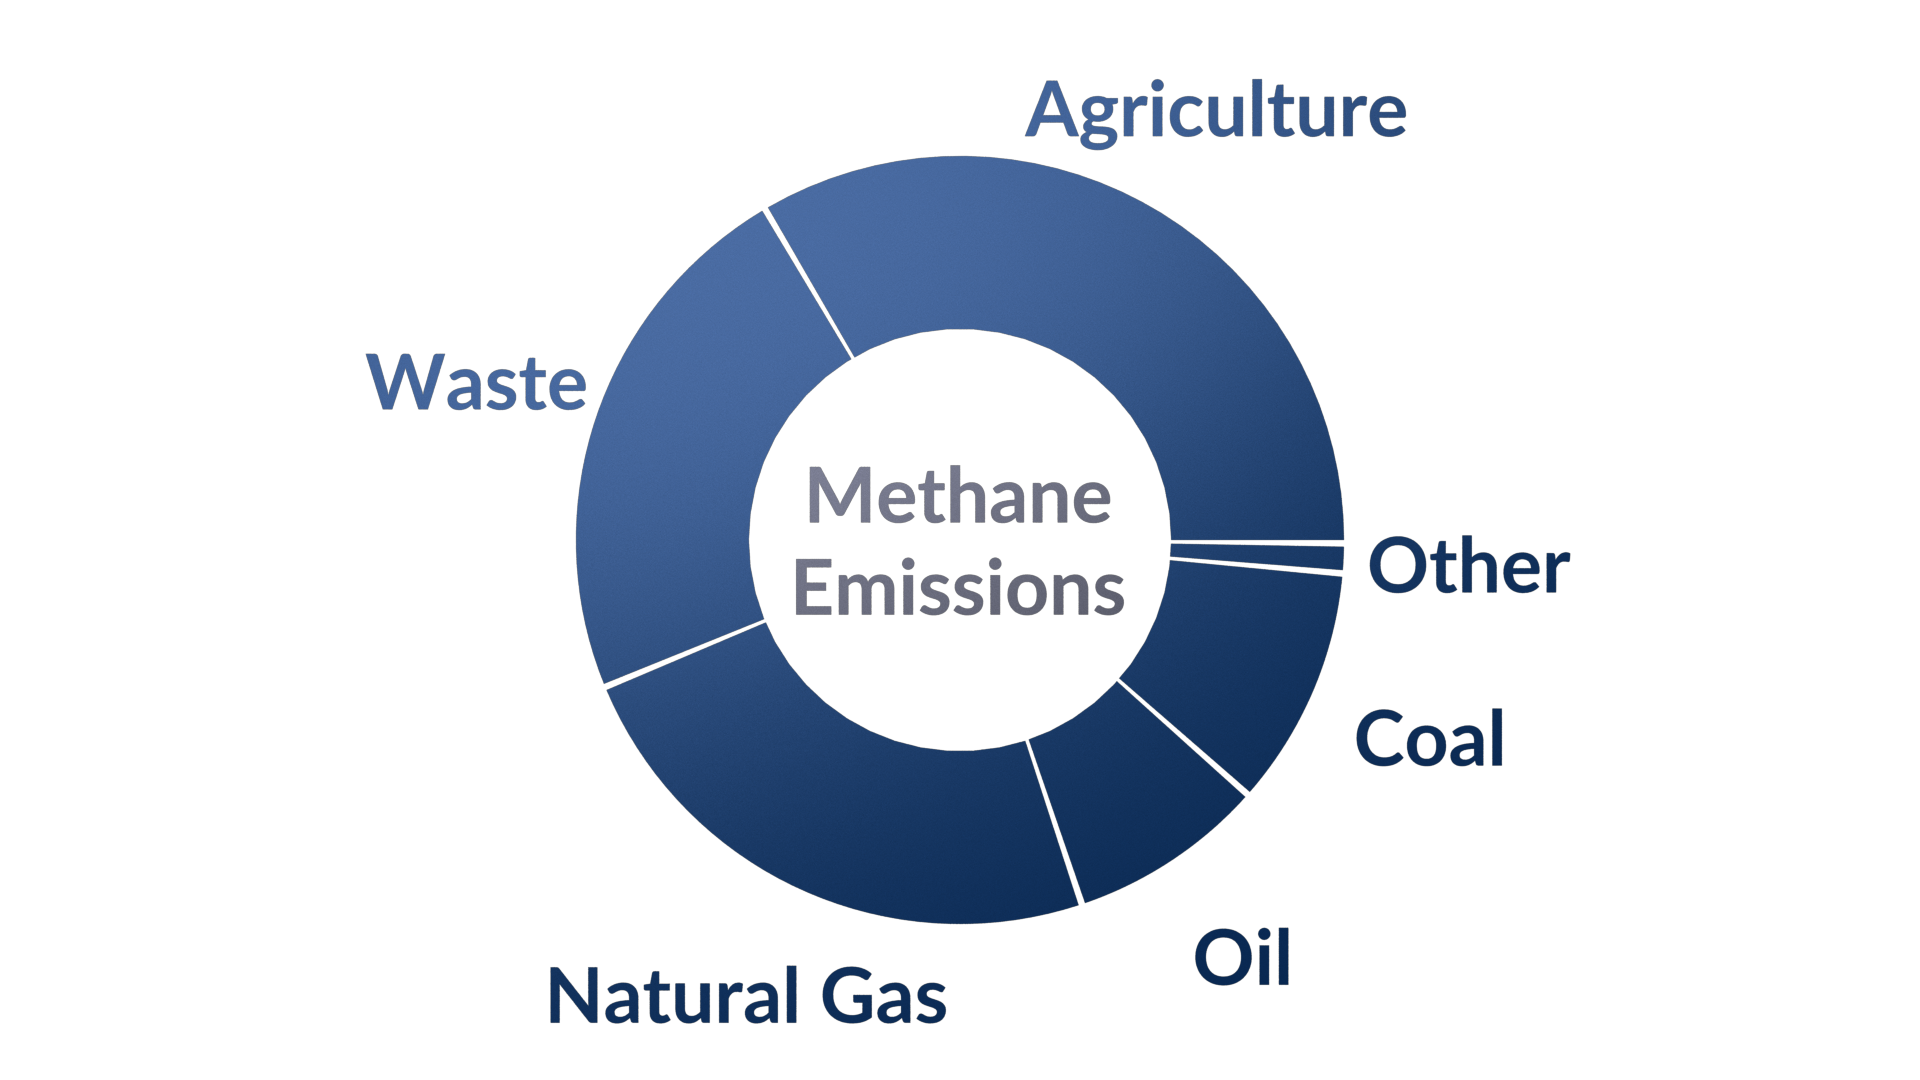
Methane Emissions in the United States
Methane is the second most important greenhouse gas contributing to climate change. While emissions are substantially lower than for carbon dioxide, the biggest driver of climate change, methane is more efficient at trapping heat on a molecule by molecule basis. As a result, understanding the sources of methane and how they can be reduced, quickly, is a major effort of policymakers and environmental managers around the world.
This visualization presents gridded methane emissions across the United States for the year 2012. The gridded methane inventory is designed to be consistent with EPA’s 2016 Inventory of U.S. Greenhouse Gas Emissions and Sinks for the year 2012, which presents national totals for different source types. Gridded estimates with 0.1 degree spatial resolution are produced using a wide range of databases at the state, county, local, and point source level to allocate the spatial and temporal distribution of emissions for individual source types. Gridded inventories, developed with support from NASA’s Carbon Monitoring System, help researchers use satellite, airborne, and in situ observations to independently evaluate EPA inventories and provide recommendations on refinements that may be needed. Additional detail and dataset access are available at the EPA website.
The gridded inventory presents totals for different major methane source types. Agriculture emissions in this visualization include manure management, enteric fermentation, rice cultivation, and field burning. Waste emissions include landfills, wastewater treatment, and composting. Natural Gas emissions include emissions from production, processing, and transmission. Coal emissions include both active and abandoned coal mines.
Related

Visualization Credits
Mark SubbaRao (NASA/GSFC): Lead Visualizer
Lesley Ott (NASA/GSFC): Lead Scientist
Laurence Schuler (ADNET Systems, Inc.): Technical Support
Ian Jones (ADNET Systems, Inc.): Technical Support
Eytan Kaplan (Global Science and Technology, Inc.): Web Administrator
Lesley Ott (NASA/GSFC): Lead Scientist
Laurence Schuler (ADNET Systems, Inc.): Technical Support
Ian Jones (ADNET Systems, Inc.): Technical Support
Eytan Kaplan (Global Science and Technology, Inc.): Web Administrator
Please give credit for this item to:
NASA's Scientific Visualization Studio
NASA's Scientific Visualization Studio
Science Paper:
A Gridded National Inventory of U.S. Methane Emissions, Maasakkers et. al. 2016
Short URL to share this page:
https://svs.gsfc.nasa.gov/5041
Data Used:
Note: While we identify the data sets used in these visualizations, we do not store any further details nor the data sets themselves on our site.
Keywords:
SVS >> EPA
SVS >> Methane
SVS >> Climate Change
SVS >> Greenhouse Gases
NASA Science >> Earth
A Gridded National Inventory of U.S. Methane Emissions, Maasakkers et. al. 2016
Short URL to share this page:
https://svs.gsfc.nasa.gov/5041
Data Used:
Gridded 2012 U.S. Methane Emissions also referred to as: Gridded 2012 U.S. Methane Emissions
Data Compilation - EPA
A gridded inventory of US anthropogenic methane emissions with 0.1° × 0.1° spatial resolution, monthly temporal resolution, and detailed scale-dependent error characterization. The inventory is designed to be consistent with the 2016 US Environmental Protection Agency (EPA) Inventory of US Greenhouse Gas Emissions and Sinks (GHGI) for 2012.
Credit:
Maasakkers et. al. 2016
Maasakkers et. al. 2016
Keywords:
SVS >> EPA
SVS >> Methane
SVS >> Climate Change
SVS >> Greenhouse Gases
NASA Science >> Earth


