GeoCarb Observes Greenhouse Gasses from Geosynchronous Orbit
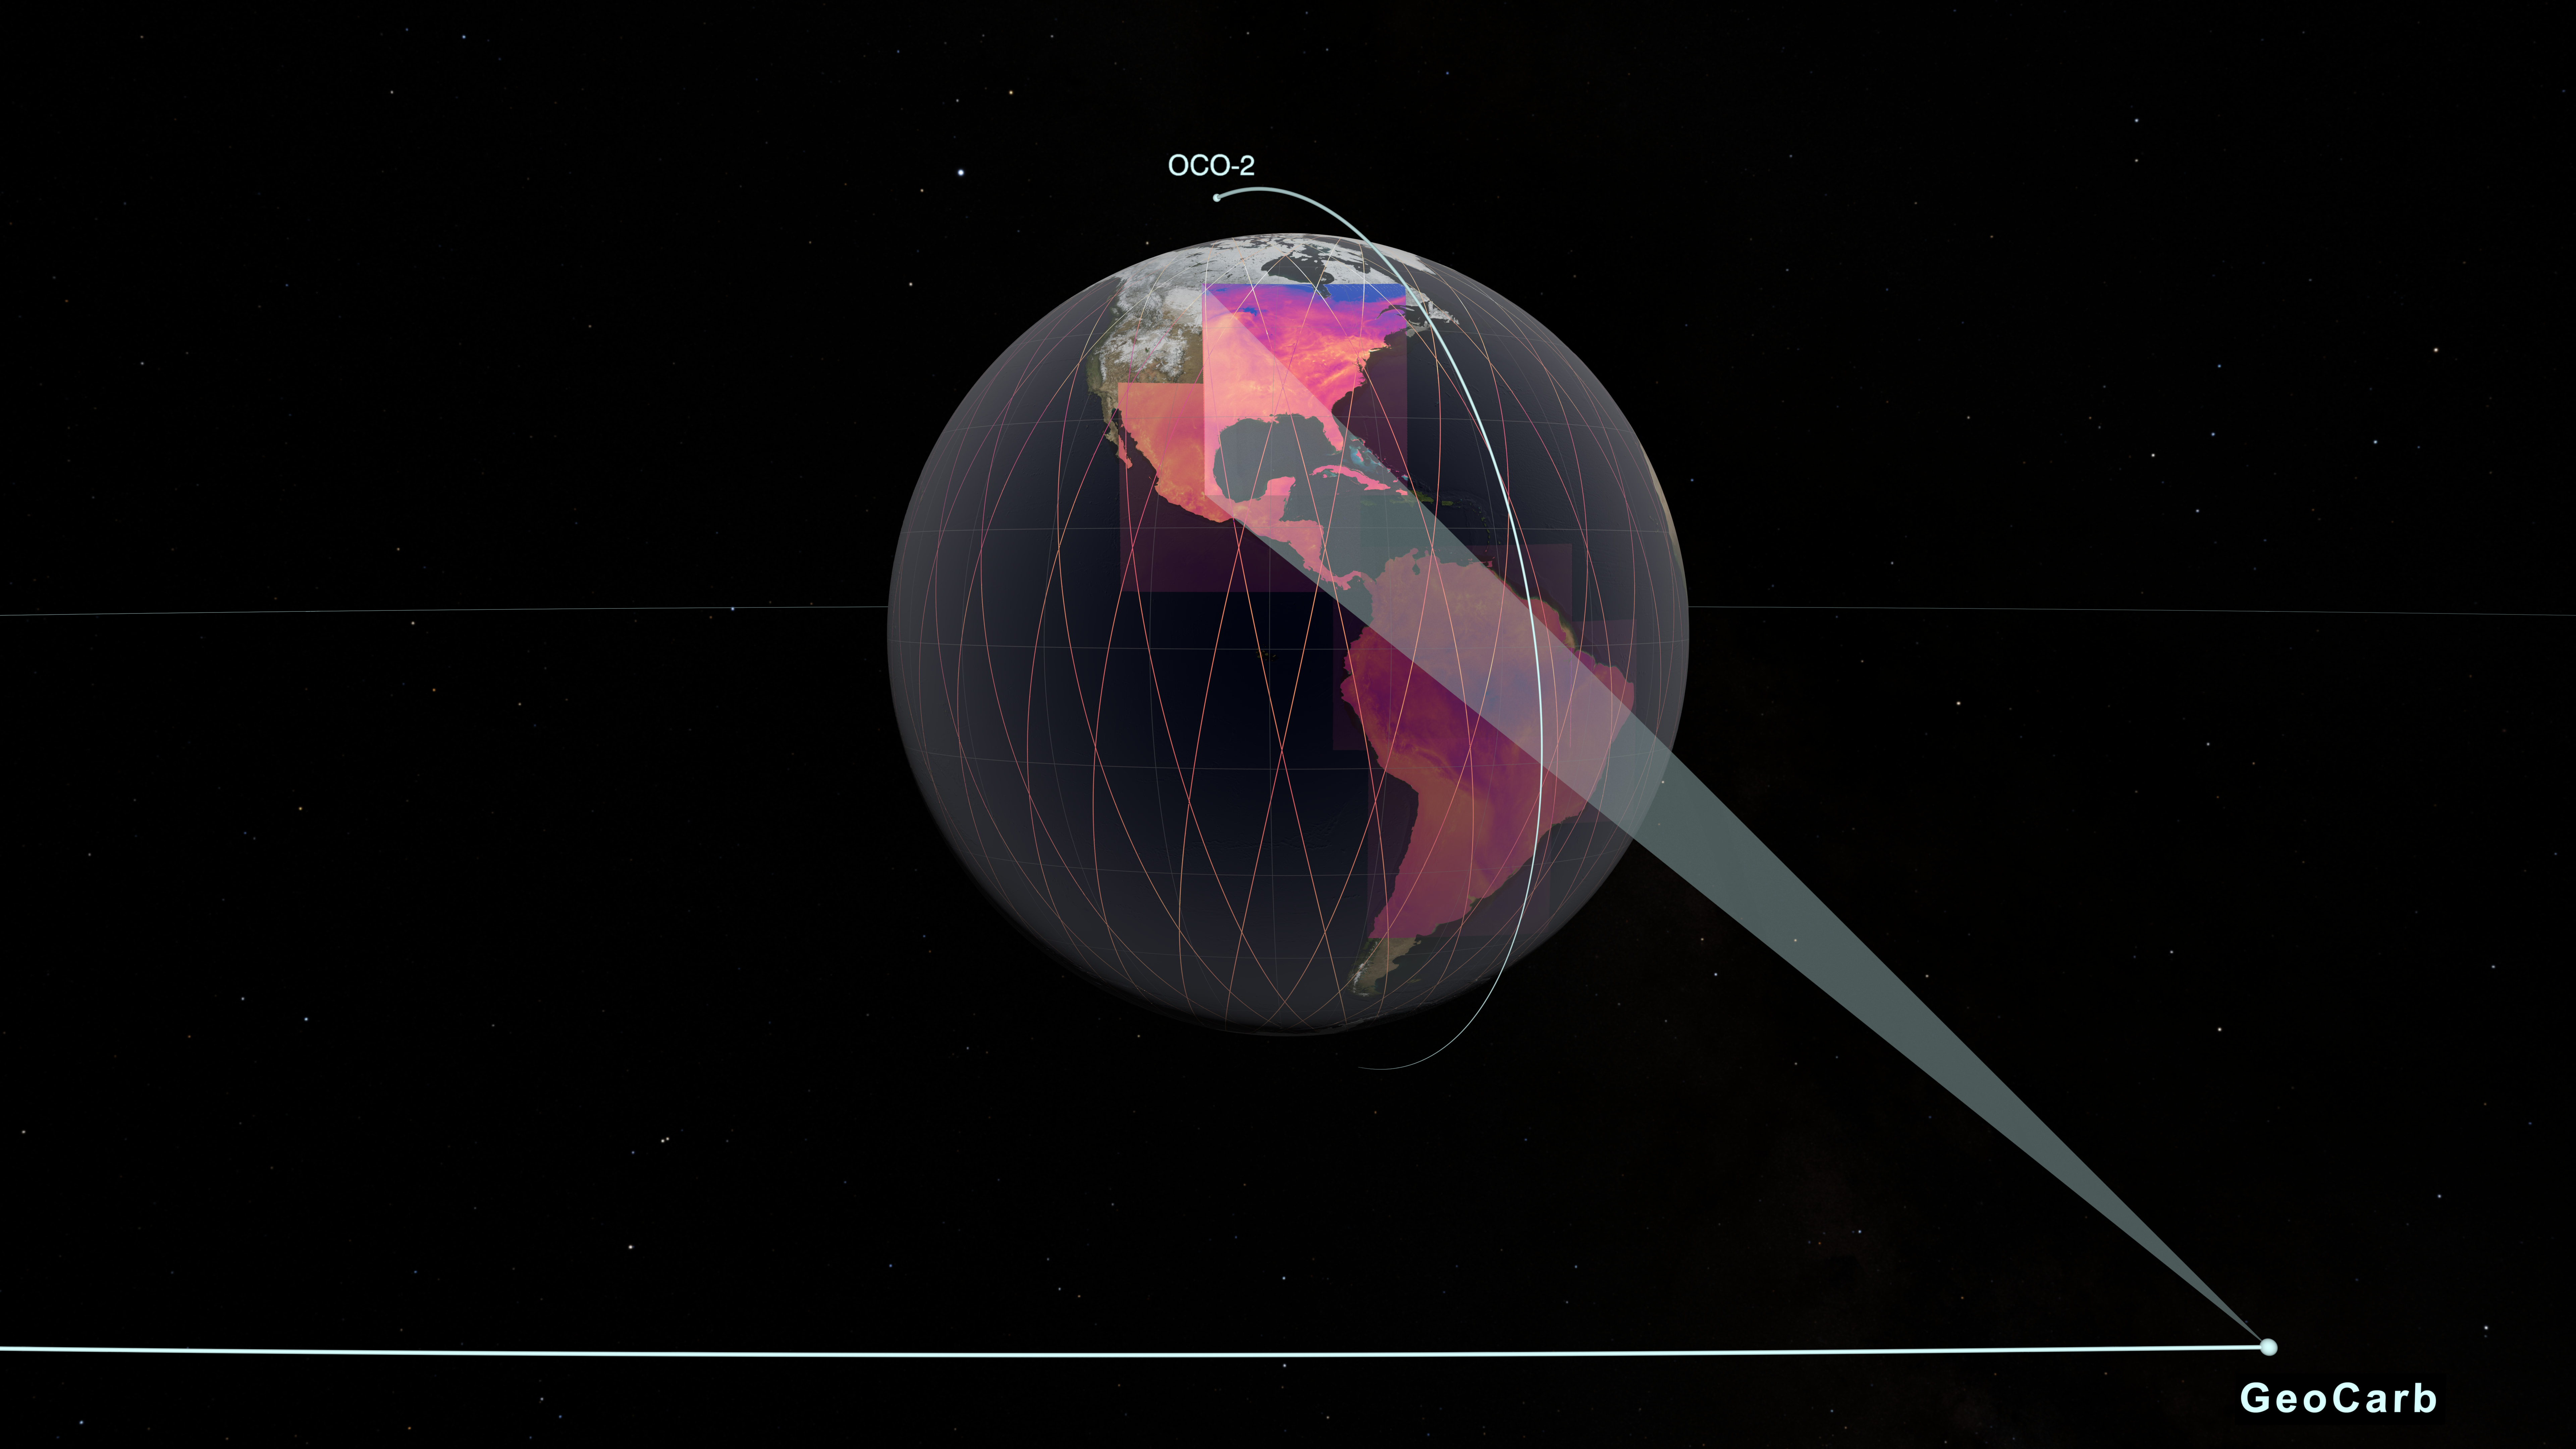
GeoCarb and OCO-2 measuring carbon dioxide from space
This visualization shows the GeoCarb spacecraft orbiting the Earth and taking data. The visualization starts close to the Earth with the Orbiting Carbon Observatory 2 (OCO-2) orbiting and taking carbon dioxide data shown as a thin trail underneath the spacecraft. These measurements are critical for our understanding of the climate. However, the OCO-2 swath is narrow and it takes a long time to cover a large region.
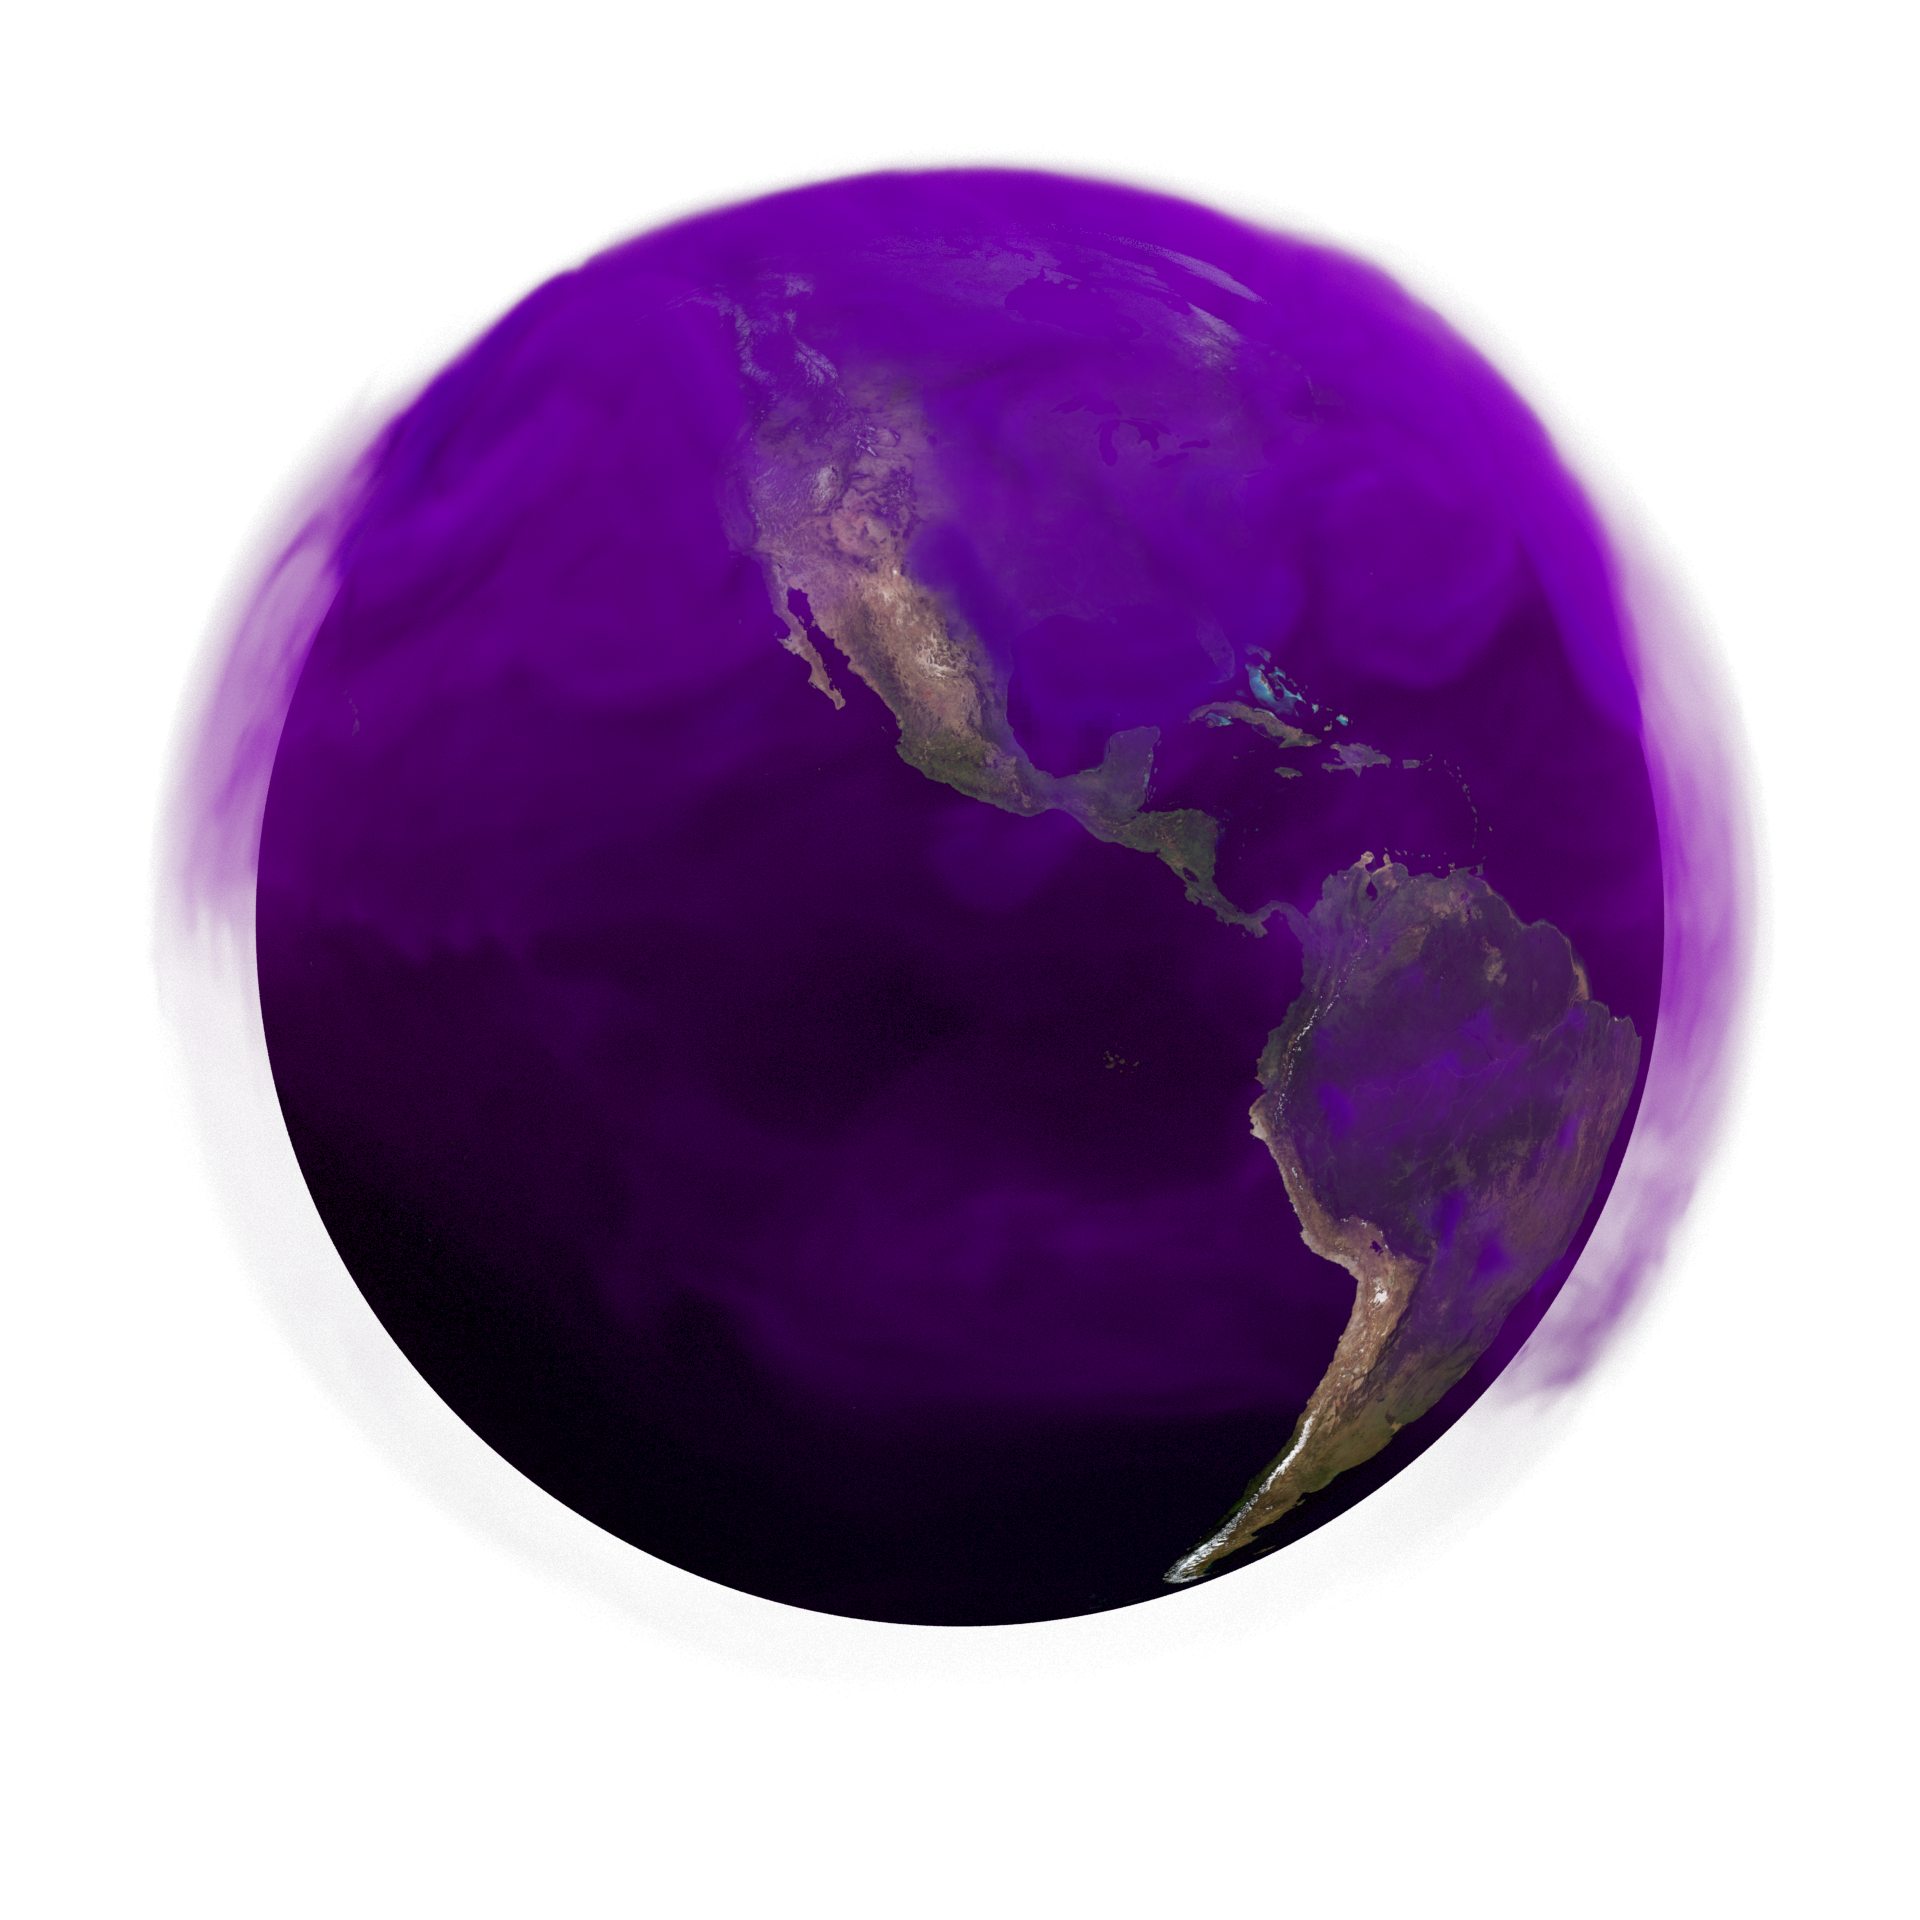
GeoCarb is a follow-on mission to OCO-2 which also measures carbon dioxide. However, GeoCarb's is in a geosynchronous orbit. This means that GeoCarb stays over the same location on the Earth, so it has a continuous view. GeoCarb orbits over North and South America. It is able to make scans of most of North and South America twice per day in the northern hemisphere summer. Geocarb has a resolution of 6km wide by 4km high; this means that each 'pixel' of GeoCarb data represents that area. Like OCO-2 GeoCarb can not make measurements at night.
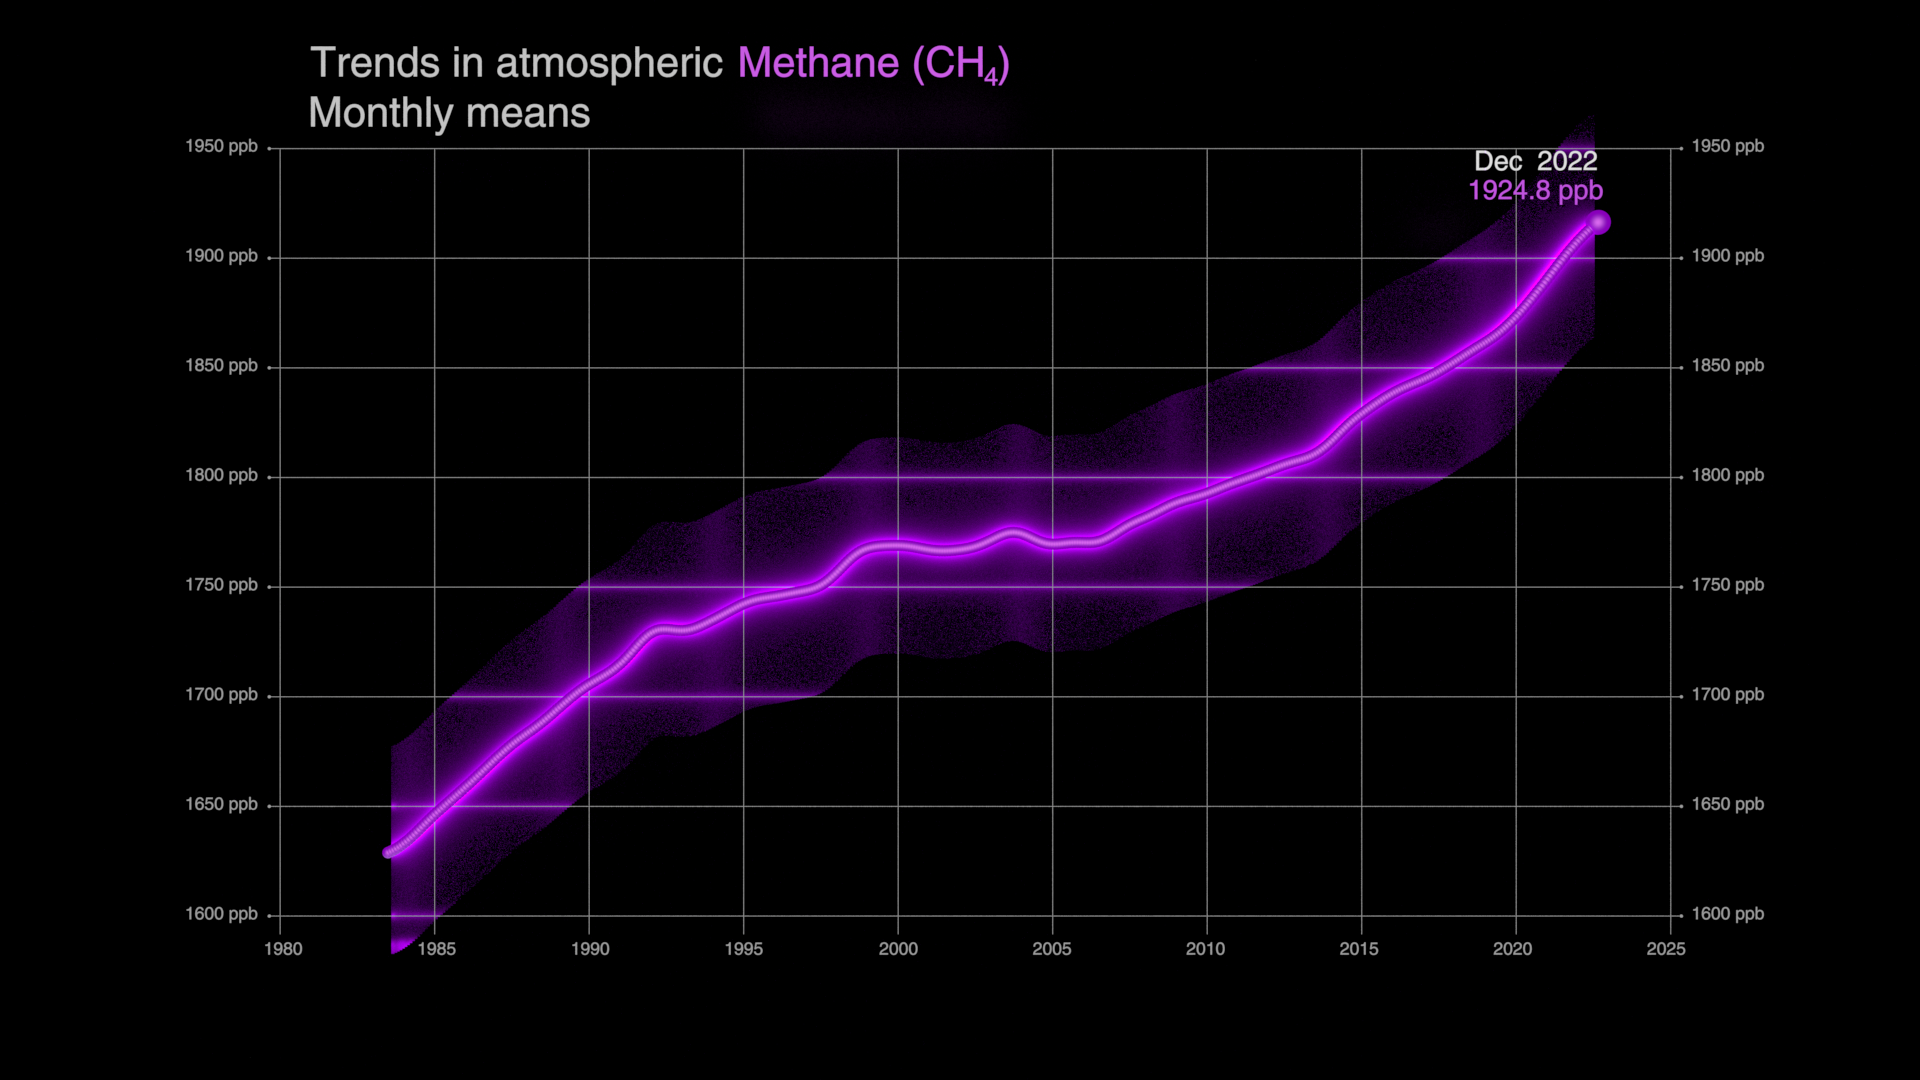
In addition to carbon dioxide, GeoCarb also measures carbon monoxide, methane, and solar induced fluorescence. Each of these constituents provide additional, vital information for climate research.
Print resolution still of GeoCarb scanning
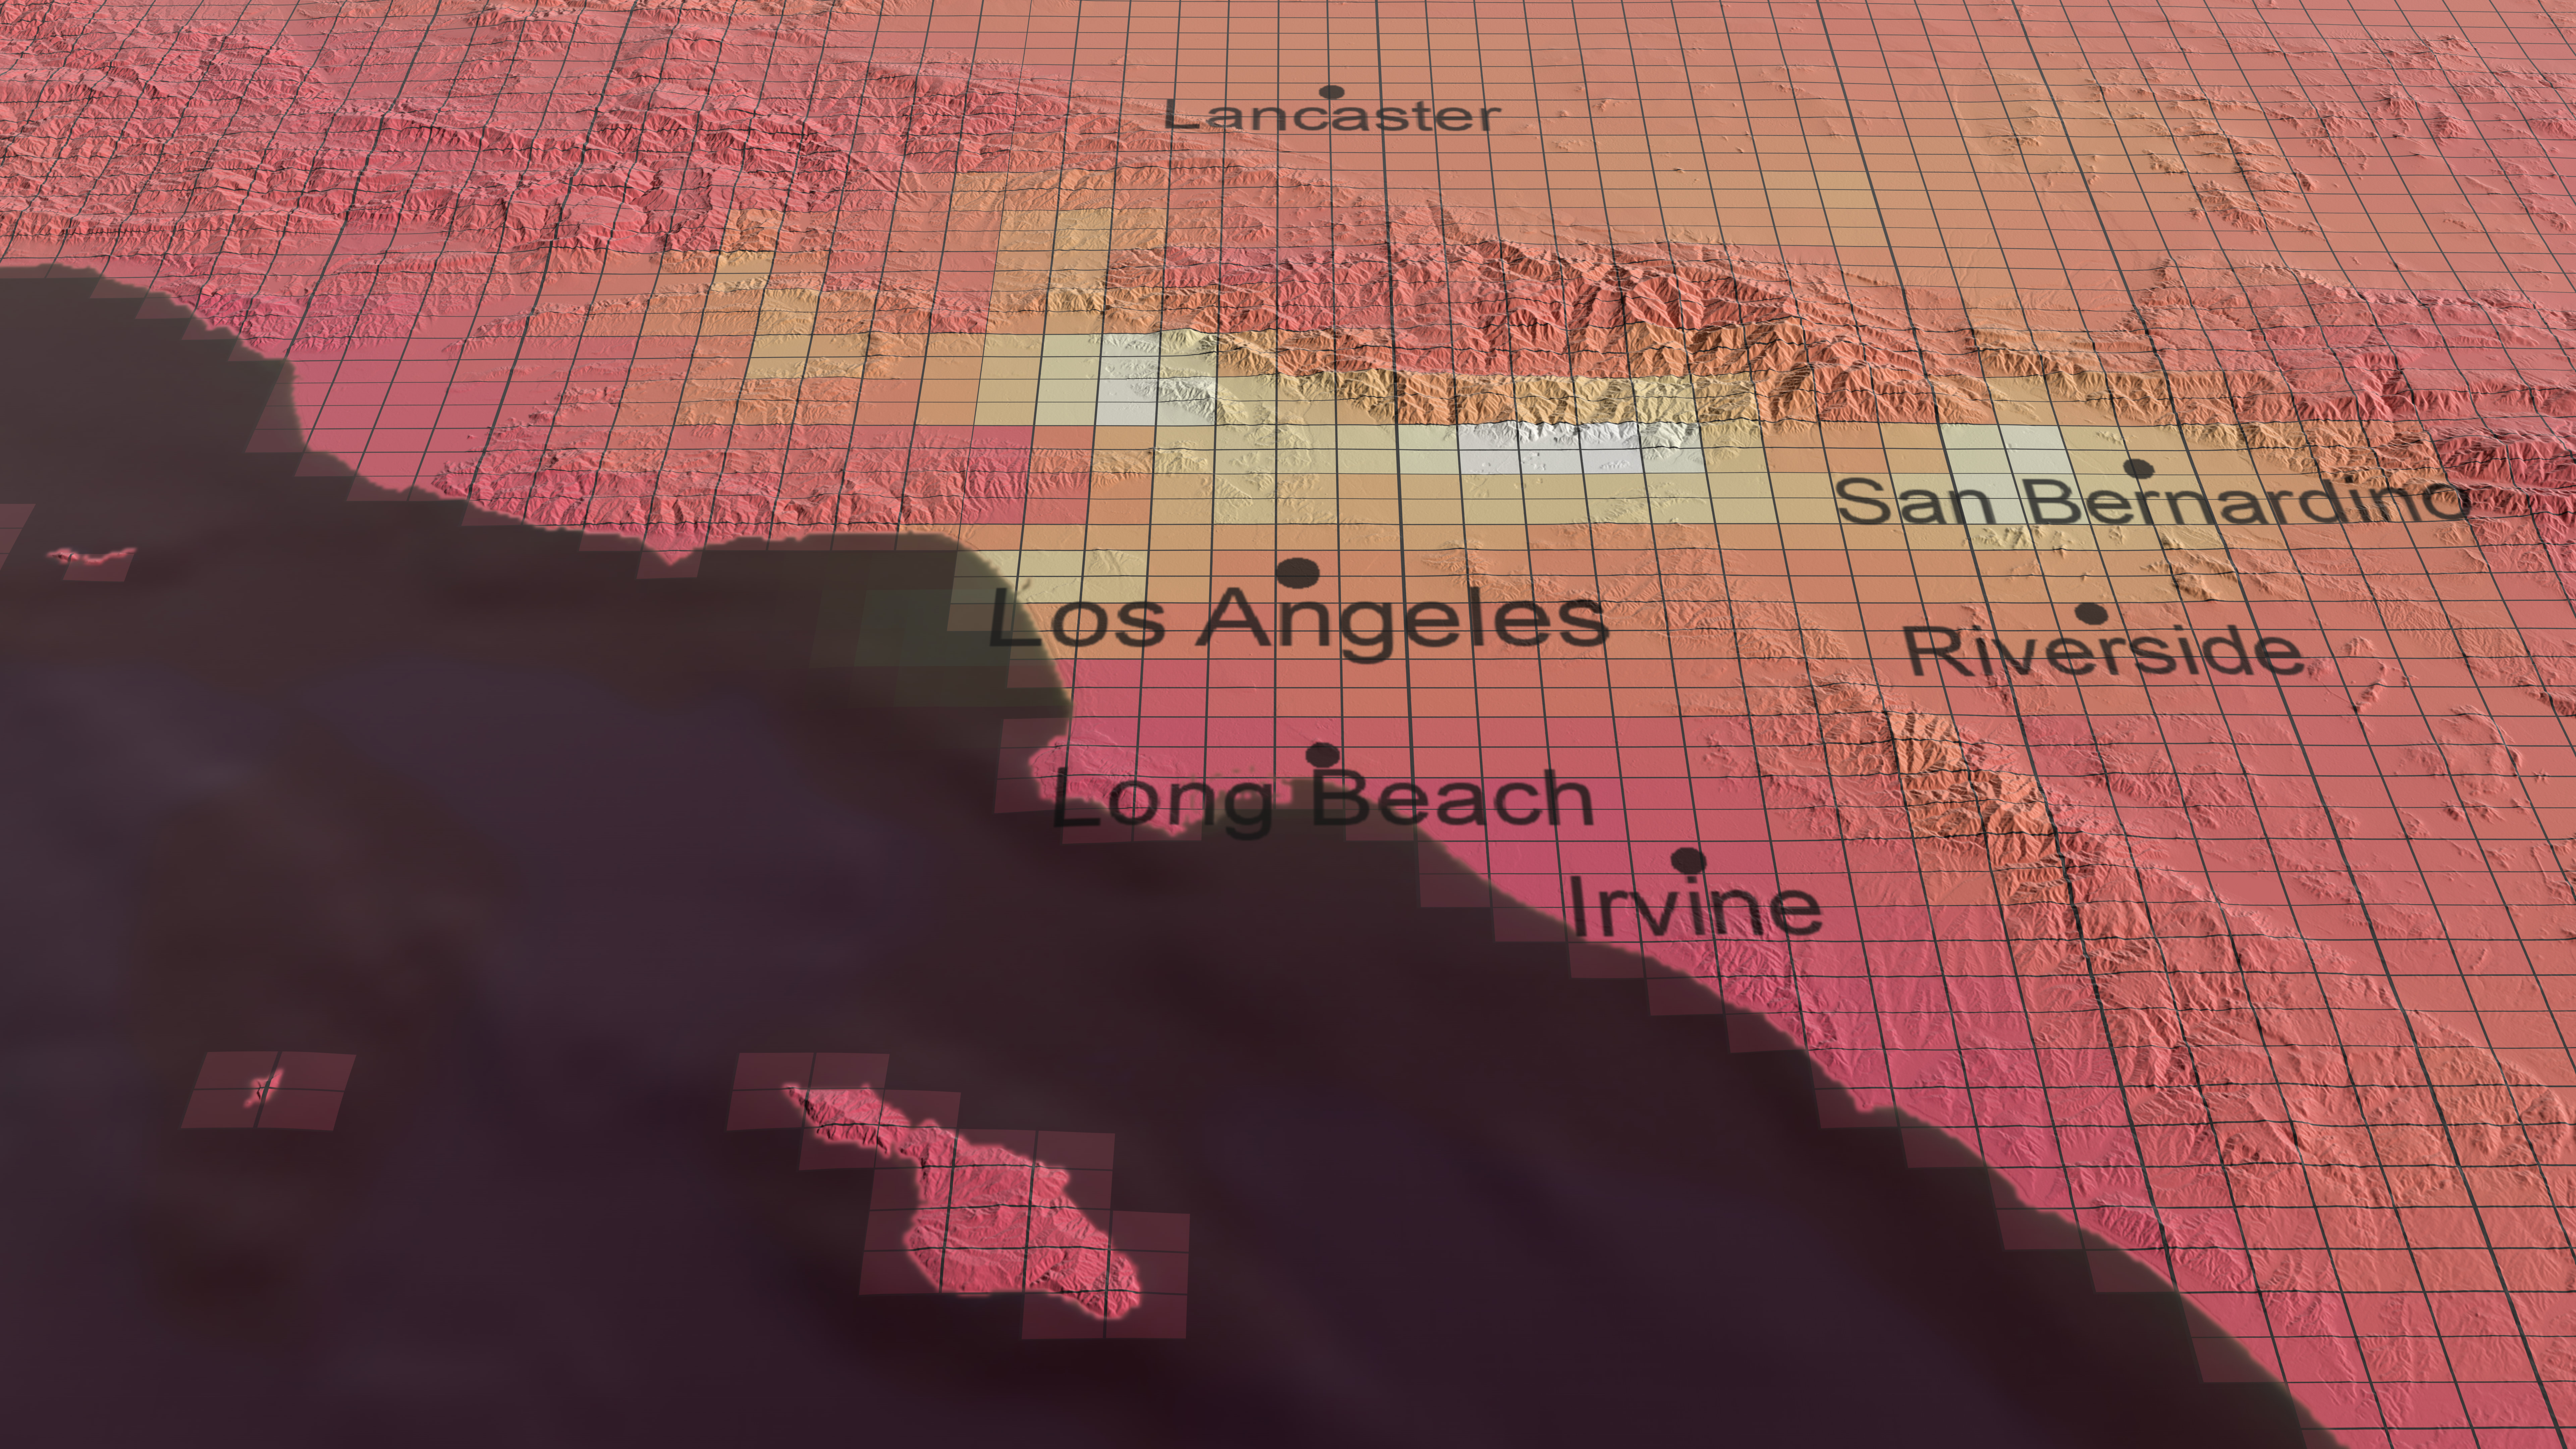
Print resolution still of Los Angeles region showing carbon dioxide and GeoCarb resolution. Each box is 6km wide by 3 km high which is the extent of each individual GeoCarb measurement
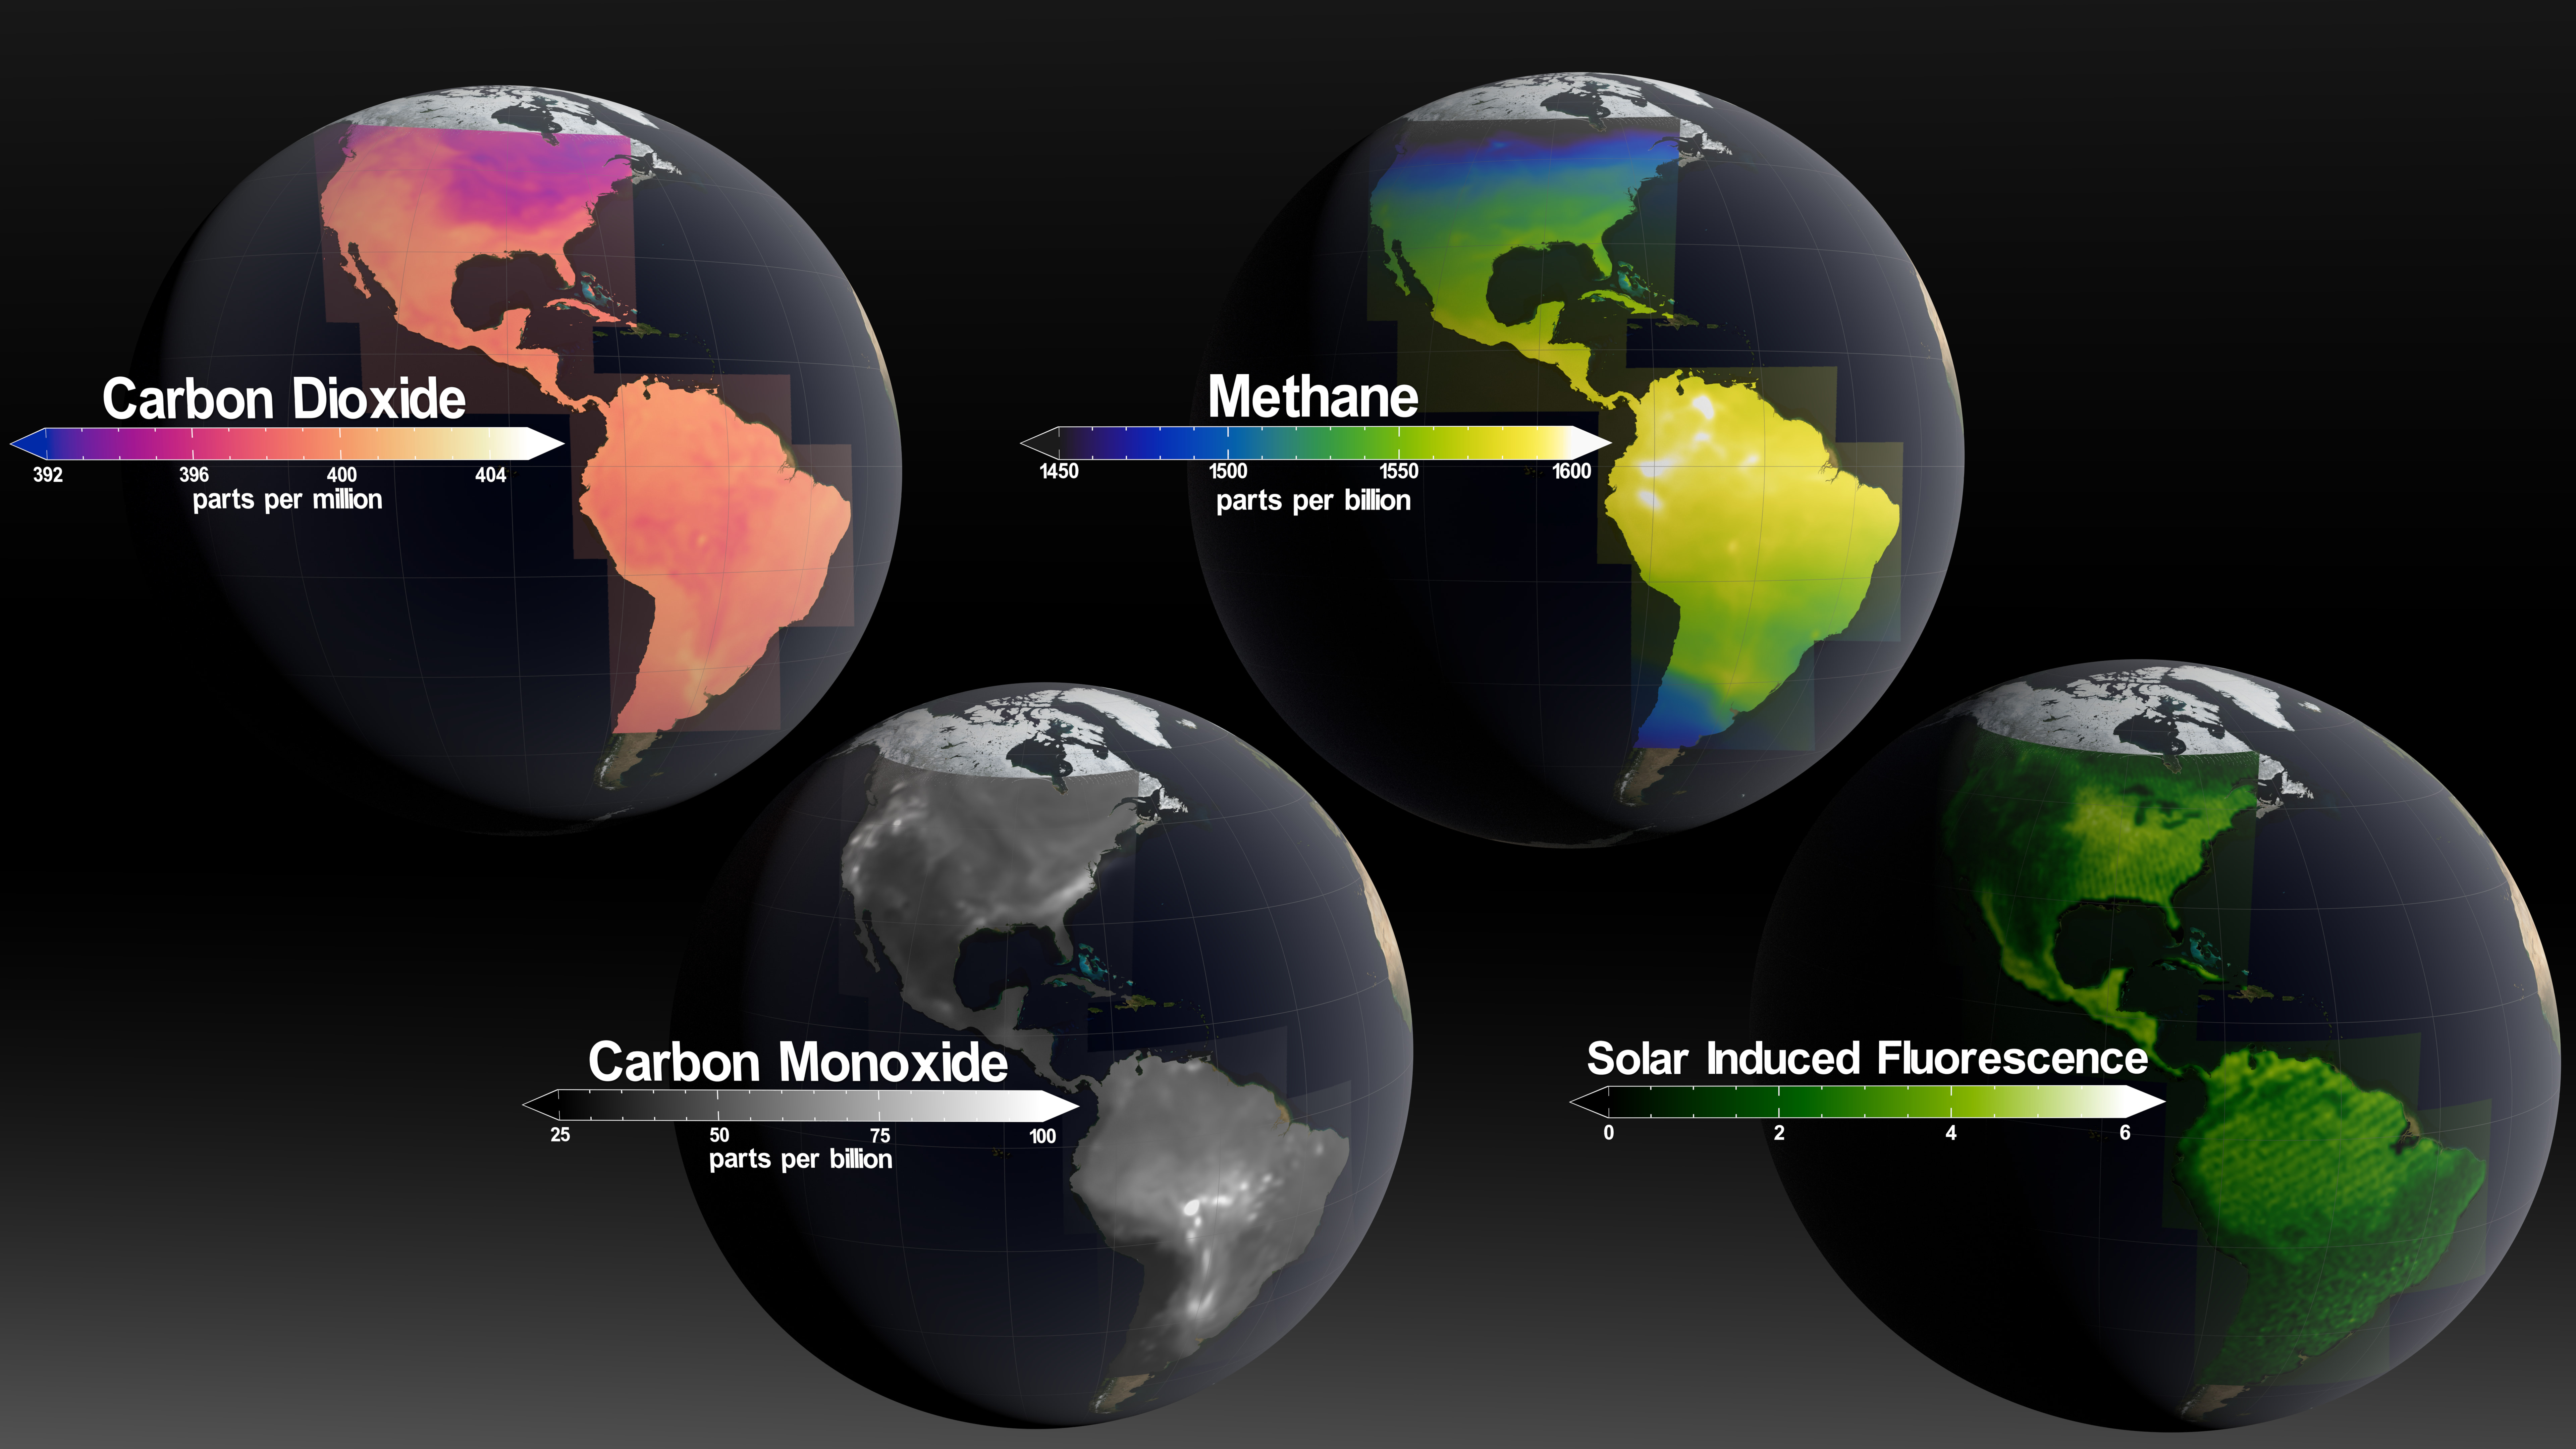
GeoCarb measures carbon dioxide, methane, cabon monoxide and solar induced fluorescence (also called SIF)
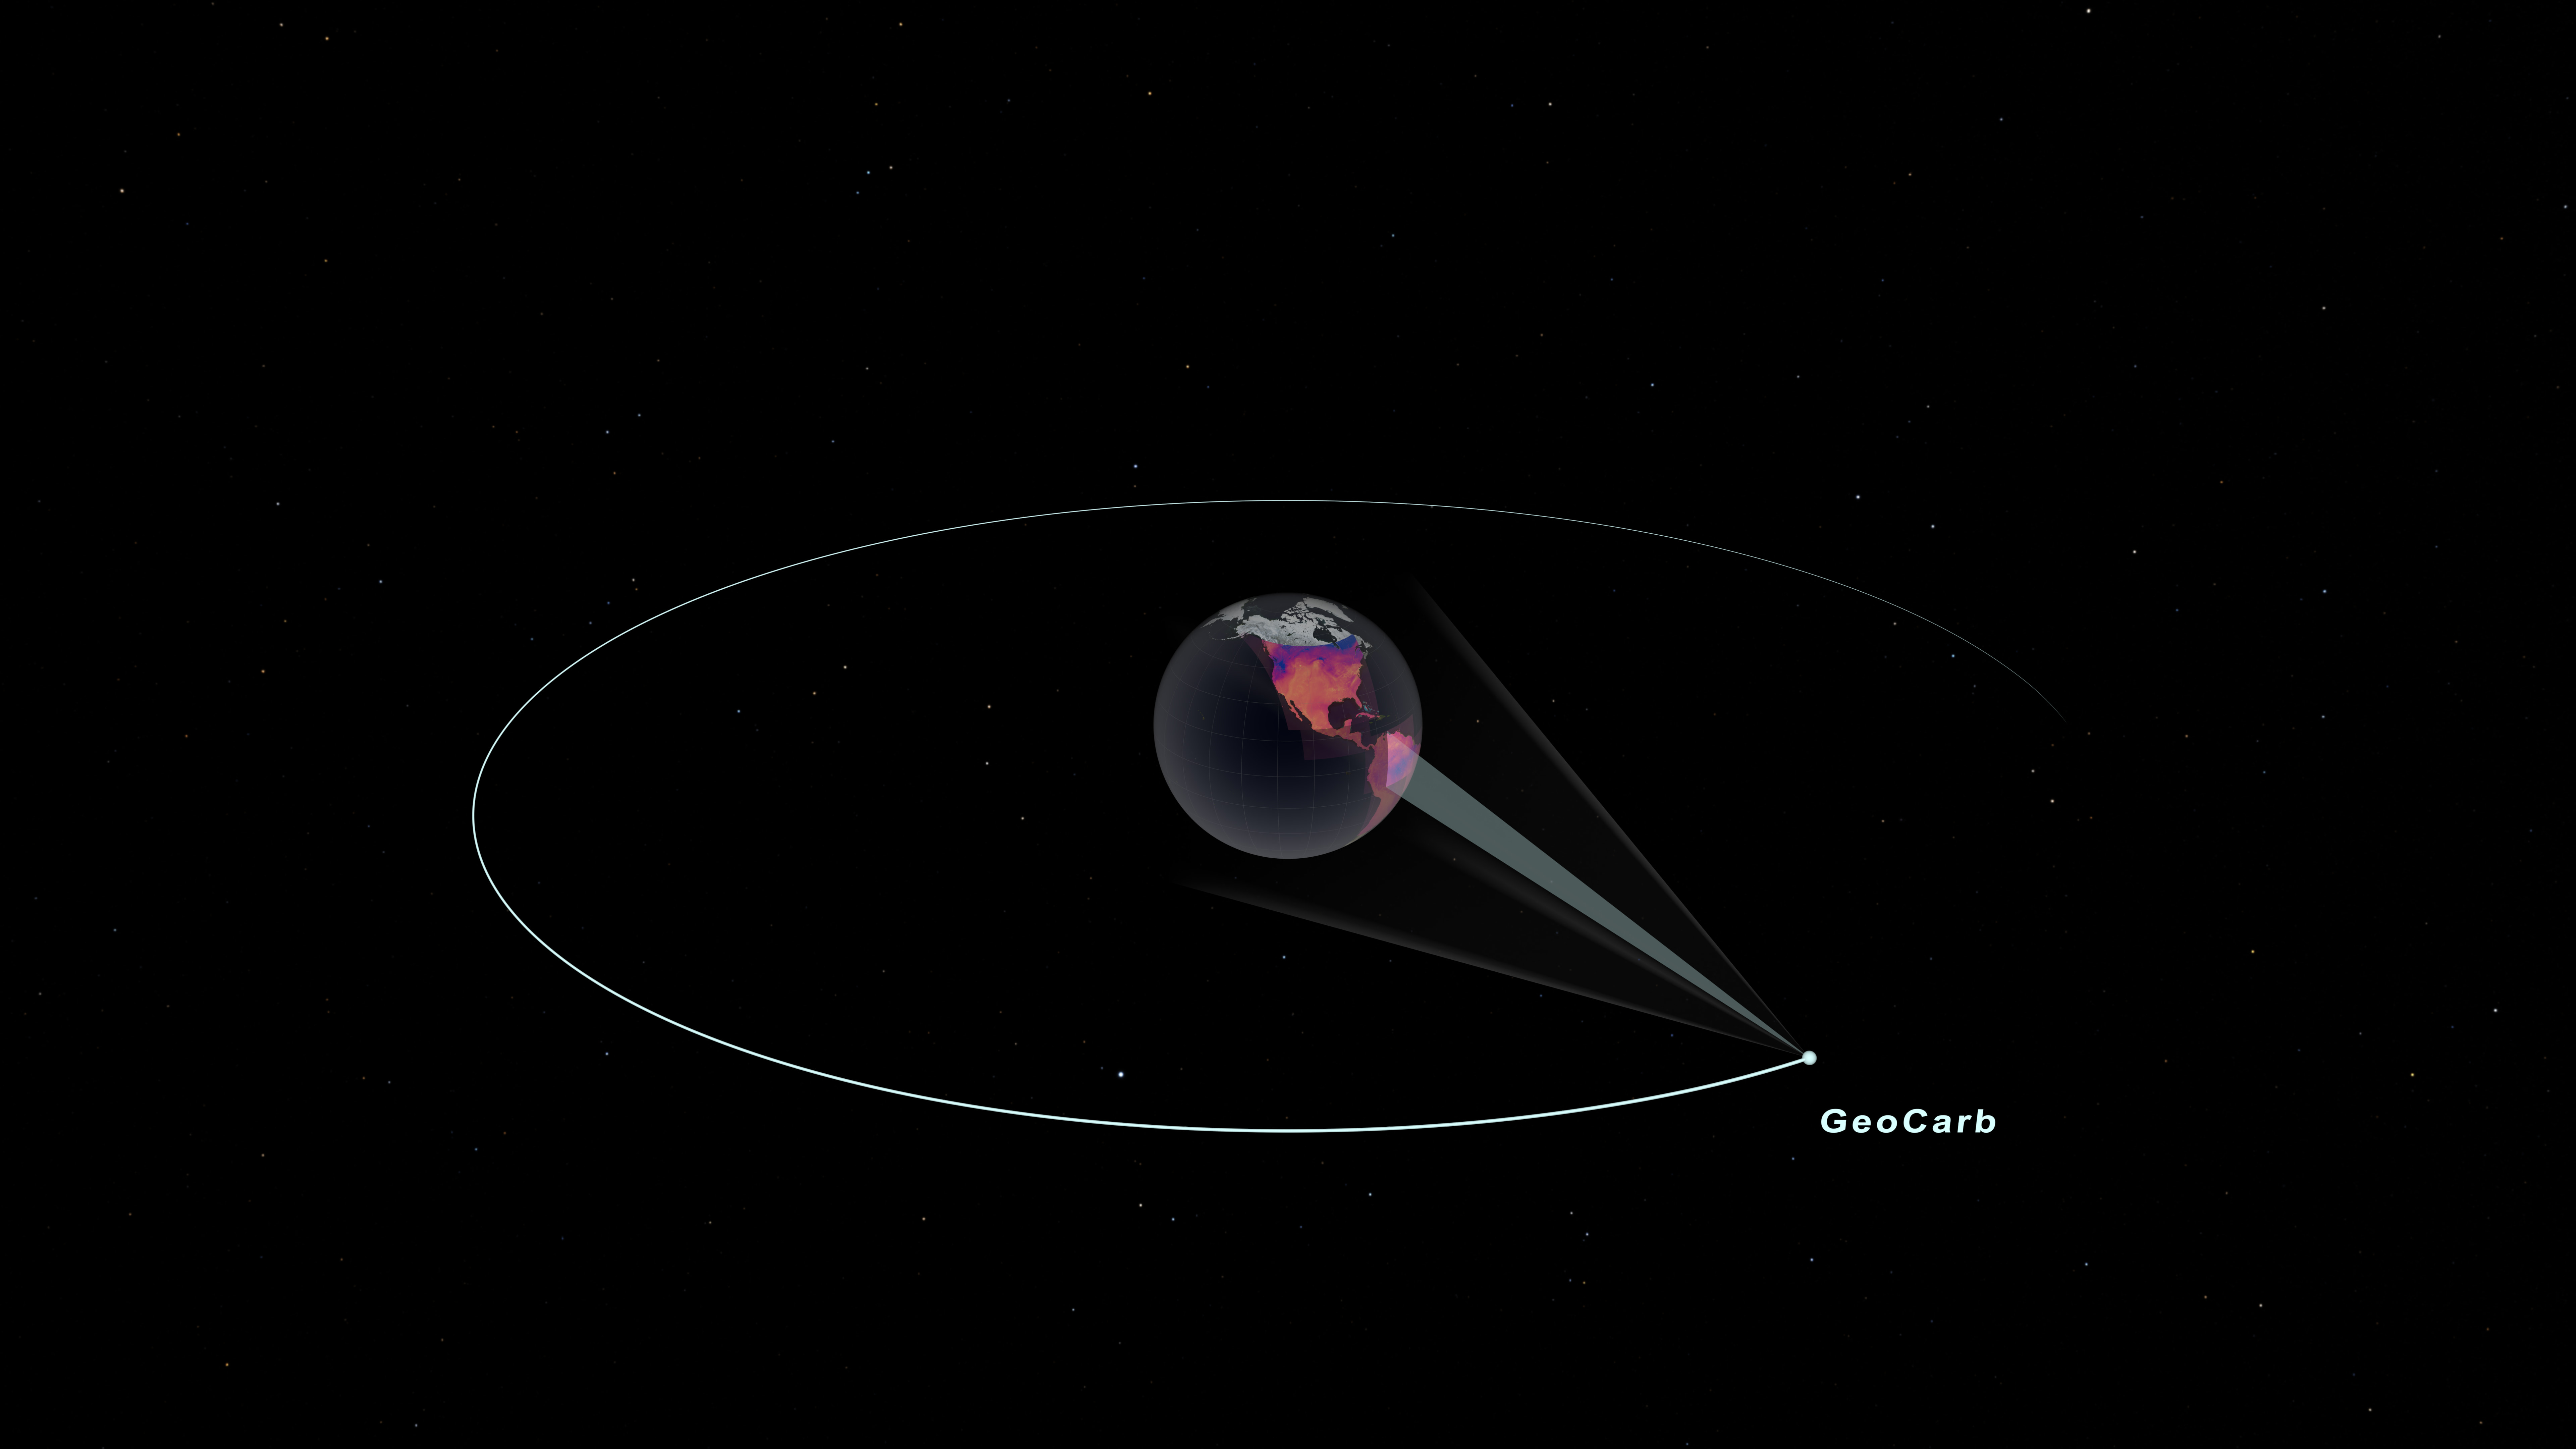
GeoCarb in geosynchronous orbit measuring carbon dioxide

Colarbar for carbon dioxide in parts per million from dark blues (392) through red and yellow to white (405)
Colarbar for methane in parts per billion from dark blues (1450) through green and yellow to white (405)
Colarbar for carbon monoxide in parts per billion from black (25) to white (100)
Colarbar for solar induced fluorescence in parts per million from black (0) tthrough greens to white (6)
Credits
Please give credit for this item to:
NASA's Scientific Visualization Studio
-
Visualizers
- Greg Shirah (NASA/GSFC)
- Cindy Starr (Global Science and Technology, Inc.)
- Lori Perkins (NASA/GSFC)
- Mark SubbaRao (NASA/GSFC)
-
Deputy principal investigator
- Sean Crowell (University of Oklahoma)
-
Deputy project manager
- Adam Matuszeski (NASA/GSFC)
-
Deputy instrument scientist
- Timothy Miller (University of Oklahoma)
-
Communications specialist
- Lauren Capraro (University of Oklahoma)
-
Principal investigator
- Berrien Moore (University of Oklahoma)
-
Project manager
- Todd King (NASA/GSFC)
-
Technical support
- Laurence Schuler (ADNET Systems, Inc.)
- Ian Jones (ADNET Systems, Inc.)
Release date
This page was originally published on Friday, April 2, 2021.
This page was last updated on Monday, November 27, 2023 at 12:16 AM EST.
Datasets used in this visualization
-
GTOPO30 Topography and Bathymetry
ID: 274 -
CelesTrak Spacecraft Orbit Ephemeris
ID: 454This dataset can be found at: http://celestrak.com
See all pages that use this dataset -
GOME-2 Solar Induced Fluorescence at 740 nm [MetOp: GOME-2]
ID: 792 -
G5NR-Chem (Chemistry) [GEOS-5: Nature Run]
ID: 946 -
GEOS Carbon Dioxide
ID: 962 -
GMAO GEOS Atmospheric Methane (GMAO GEOS Atmospheric Methane)
ID: 1066 -
Example GeoCarb Scanning Scenario
ID: 1111Example pre-launch scanning pattern for GeoCarb
See all pages that use this dataset
Note: While we identify the data sets used in these visualizations, we do not store any further details, nor the data sets themselves on our site.
Related
- ID: 5118
 Visualization
 - ID: 5116
 Visualization