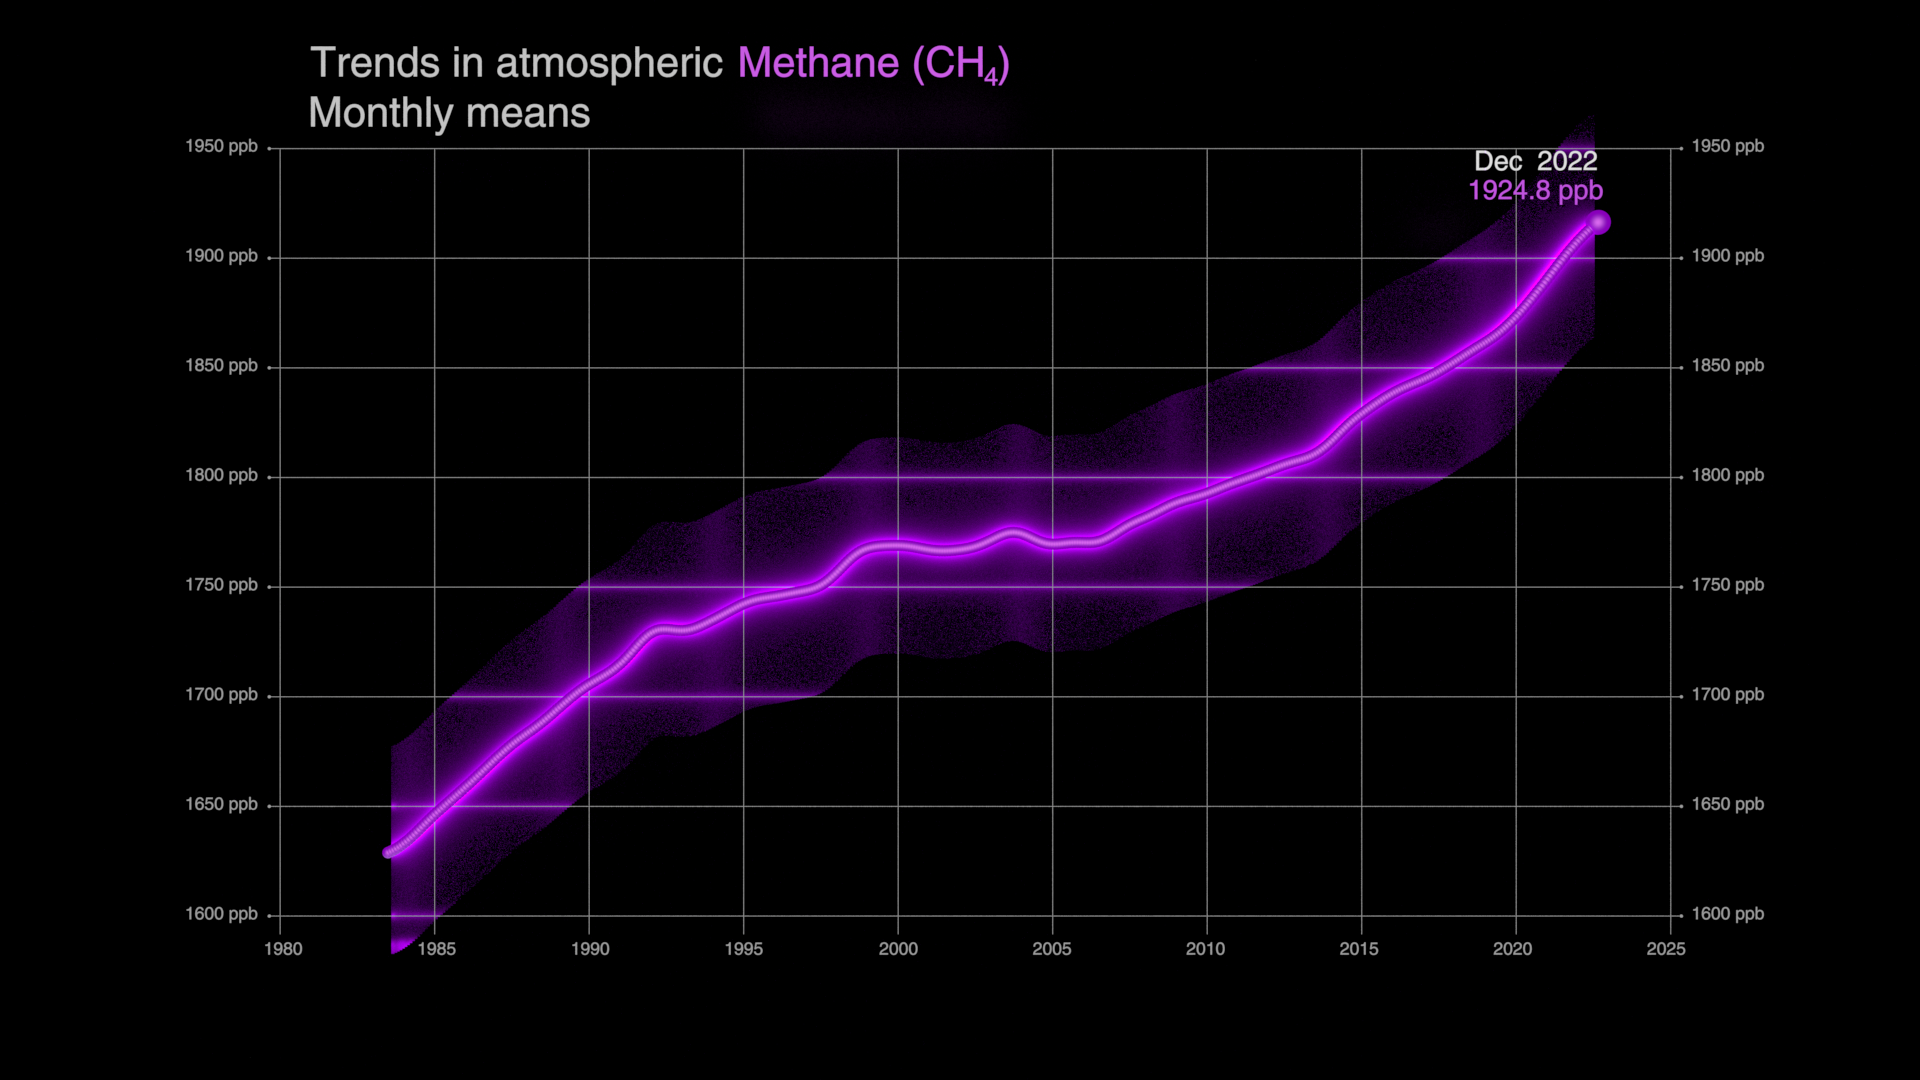
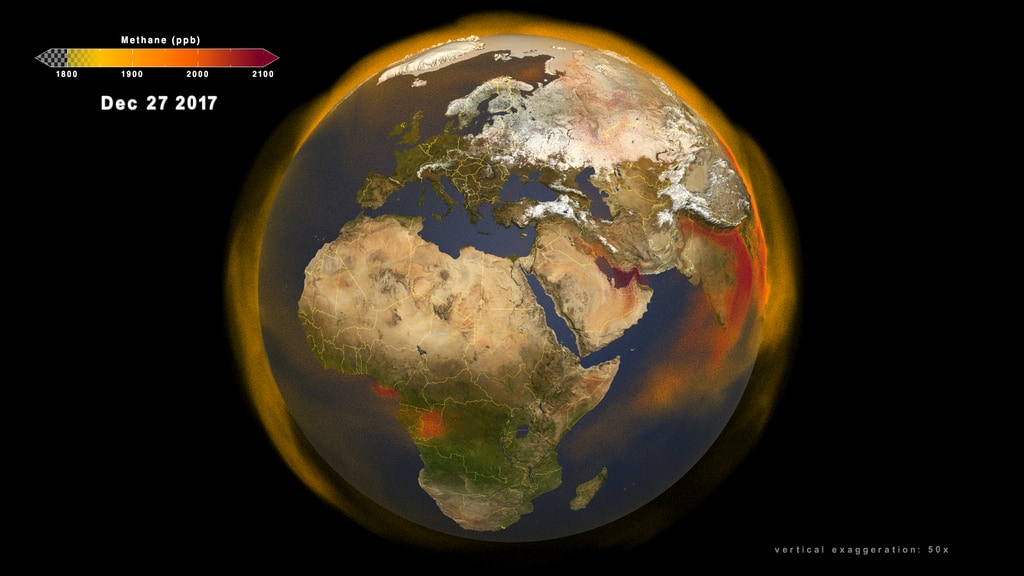
Trends in Global Atmospheric Methane (CH₄)
Timeplot of global atmospheric methane (CH4) showing the full NOAA record (September 1983-March 2022). This version is created with a dark background.
Timeplot of global atmospheric methane (CH4) showing the full NOAA record (September 1983-March 2022). This version is created with a light background.
Data Sources:
- Trends in Athmospheric Methane by NOAA. The visualizations featured on this page utilize the complete record from the Globally averaged marine surface monthly mean data for the period July 1983-March 2022 (accessed: August 4, 2022). Within the data record the globally averaged monthly mean values are centered on the middle of each month and are represented in the visualization as the jagged/wavy Average line. The continuous line shows the long-term Trend, where the average seasonal cycle has been removed.
Citation: Ed Dlugokencky, NOAA/GML (https://gml.noaa.gov/ccgg/trends_ch4/)
Citation: Dlugokencky, E. J., L. P. Steele, P. M. Lang, and K. A. Masarie (1994), The growth rate and distribution of atmospheric methane, J. Geophys. Res., 99, 17,021– 17,043, doi:10.1029/94JD01245.
Credits
Please give credit for this item to:
NASA's Scientific Visualization Studio
-
Visualizer
- Helen-Nicole Kostis (USRA)
-
Scientist
- Lesley Ott (NASA/GSFC)
-
Technical support
- Laurence Schuler (ADNET Systems, Inc.)
- Ian Jones (ADNET Systems, Inc.)
- Eric Sokolowsky (Global Science and Technology, Inc.)
Release date
This page was originally published on Thursday, August 11, 2022.
This page was last updated on Thursday, January 25, 2024 at 12:15 AM EST.
Papers used in this visualization
Dlugokencky, E. J., L. P. Steele, P. M. Lang and K. A. Masarie, (1994), The growth rate and distribution of atmospheric methane, Journal of Geophysical Research, 99, D8, 17, doi:10.1029/94JD01245
Datasets used in this visualization
-
NOAA Globall Averaged Marine Surface Monthly Mean Data
ID: 1151Credit: NOAA/GML, Ed Dlugokencky, gml.noaa.gov/ccgg/trends_ch4/
See all pages that use this dataset
Note: While we identify the data sets used in these visualizations, we do not store any further details, nor the data sets themselves on our site.
Related
- ID: 5118
 Visualization
 - ID: 5116
 Visualization
 - ID: 14257
 Produced Video
 - ID: 4799
 Visualization
 - ID: 4798
 Visualization
 - ID: 4789
 Visualization
Older Versions
- ID: 4964
 Visualization