Earth
ID: 4821
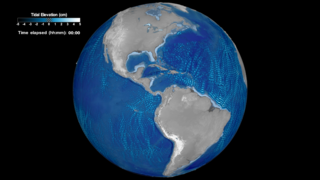
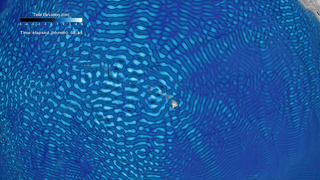
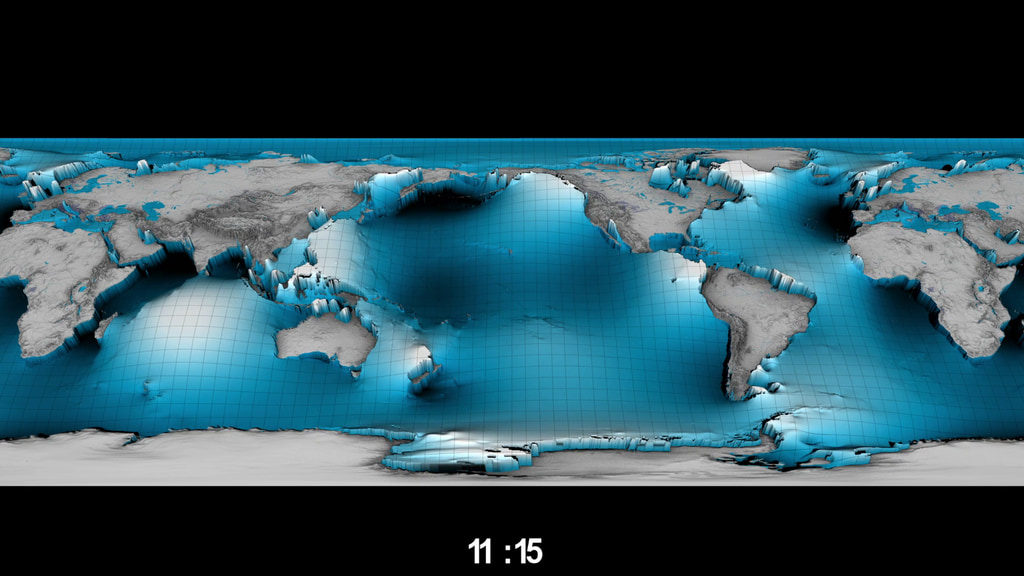
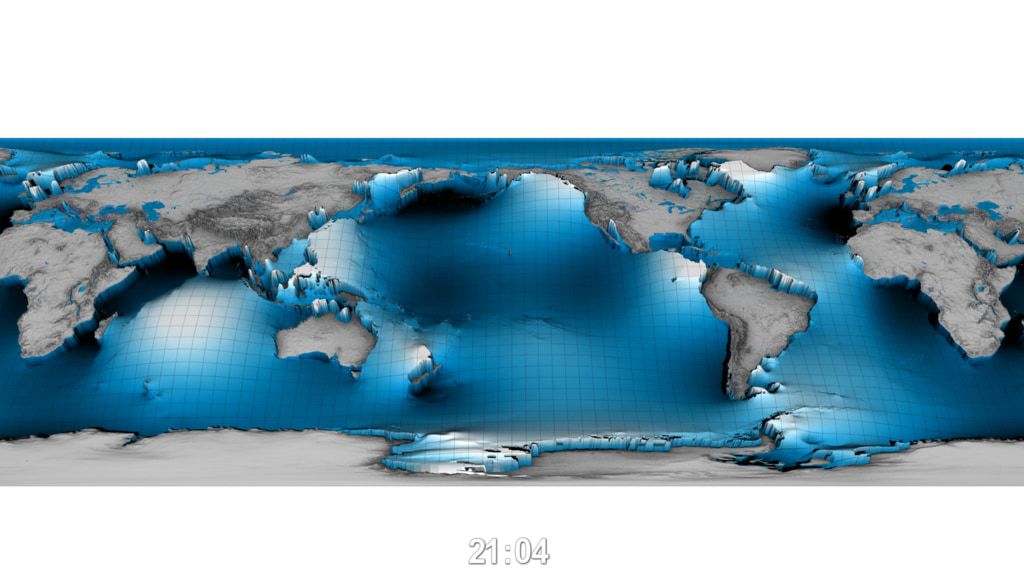
Ocean tides are not simple. If our planet had no continents, tides would be hemispheric-sized bulges of water moving westward with the moon and sun. This animation shows the tides as a complex system of rotating and trapped waves with a mixture of frequencies. Waves run relatively unimpeded westward only around Antarctica. Even there, we see a complicated pattern as waves merge from the north and others separate northwards or southwards under Antarctic ice shelves. In the North Atlantic, we see waves mainly rotating anti-clockwise, with small amplitudes in the middle of the ocean and high amplitudes around the boundaries, especially along the coasts of northwest Europe and Britain. Waves are trapped and rotating around New Zealand, causing a high tide on one side of the islands with a simultaneous low tide on the other side.
The Topex/Poseidon and Jason satellite altimeter missions were designed to observe and record this complexity. Altimeters, on these missions, acted as flying tide gauges. After several years collecting data, researchers could analyze the signals at each ocean location to determine the tidal characteristics. With that knowledge, plus near-perfect knowledge of the motion of the sun and moon, the tide can be predicted at any location and at any time in the future.
The data used in this visualization is from the Goddard Space Flight Center's barotropic tides simulation and runs for slightly longer than one Earth day. The level of the tides is exaggerated in order to show how the tides vary around the world.
Barotropic Global Ocean Tides
The Topex/Poseidon and Jason satellite altimeter missions were designed to observe and record this complexity. Altimeters, on these missions, acted as flying tide gauges. After several years collecting data, researchers could analyze the signals at each ocean location to determine the tidal characteristics. With that knowledge, plus near-perfect knowledge of the motion of the sun and moon, the tide can be predicted at any location and at any time in the future.
The data used in this visualization is from the Goddard Space Flight Center's barotropic tides simulation and runs for slightly longer than one Earth day. The level of the tides is exaggerated in order to show how the tides vary around the world.
Used Elsewhere In
Related

Visualization Credits
Greg Shirah (NASA/GSFC): Lead Visualizer
Richard Ray (NASA/GSFC): Scientist
Nadya Vinogradova-Shiffer (NASA/HQ): Scientist
Laurence Schuler (ADNET Systems, Inc.): Technical Support
Ian Jones (ADNET Systems, Inc.): Technical Support
Lori Perkins (NASA/GSFC): Narrator
Richard Ray (NASA/GSFC): Scientist
Nadya Vinogradova-Shiffer (NASA/HQ): Scientist
Laurence Schuler (ADNET Systems, Inc.): Technical Support
Ian Jones (ADNET Systems, Inc.): Technical Support
Lori Perkins (NASA/GSFC): Narrator
Please give credit for this item to:
NASA's Scientific Visualization Studio
NASA's Scientific Visualization Studio
Short URL to share this page:
https://svs.gsfc.nasa.gov/4821
Data Used:
Note: While we identify the data sets used in these visualizations, we do not store any further details nor the data sets themselves on our site.
This item is part of this series:
Narrated Movies
Keywords:
DLESE >> Physical oceanography
GCMD >> Earth Science >> Oceans
GCMD >> Earth Science >> Oceans >> Tides
SVS >> Hyperwall
NASA Science >> Earth
GCMD keywords can be found on the Internet with the following citation: Olsen, L.M., G. Major, K. Shein, J. Scialdone, S. Ritz, T. Stevens, M. Morahan, A. Aleman, R. Vogel, S. Leicester, H. Weir, M. Meaux, S. Grebas, C.Solomon, M. Holland, T. Northcutt, R. A. Restrepo, R. Bilodeau, 2013. NASA/Global Change Master Directory (GCMD) Earth Science Keywords. Version 8.0.0.0.0
https://svs.gsfc.nasa.gov/4821
Data Used:
Simulated Jupiter Wind Flow Field
ModelBarotropic Tides Simulation
Model - NASA/GSFC
More information about this dataset can be found in the following paper:
G. D. Egbert, R. D. Ray, B. G. Bills, Numerical modeling of the global semidiurnal tide in the present day and in the last glacial maximum, 10.1029/2003JC001973, (2004).
This item is part of this series:
Narrated Movies
Keywords:
DLESE >> Physical oceanography
GCMD >> Earth Science >> Oceans
GCMD >> Earth Science >> Oceans >> Tides
SVS >> Hyperwall
NASA Science >> Earth
GCMD keywords can be found on the Internet with the following citation: Olsen, L.M., G. Major, K. Shein, J. Scialdone, S. Ritz, T. Stevens, M. Morahan, A. Aleman, R. Vogel, S. Leicester, H. Weir, M. Meaux, S. Grebas, C.Solomon, M. Holland, T. Northcutt, R. A. Restrepo, R. Bilodeau, 2013. NASA/Global Change Master Directory (GCMD) Earth Science Keywords. Version 8.0.0.0.0


