Internal Ocean Tides
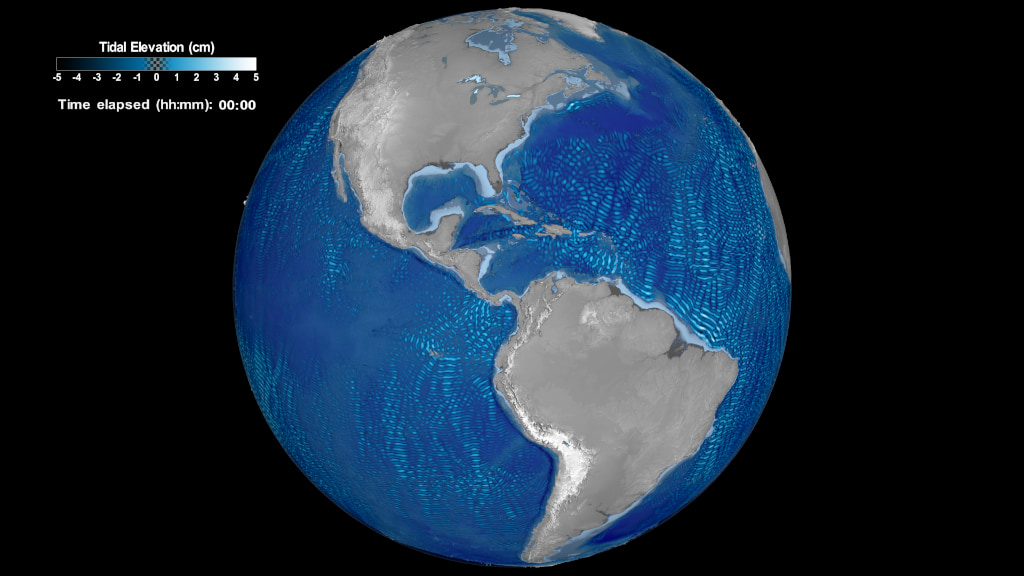
Data visualization featuring internal tides data from NASA Goddard's Space Flight Center simulation run. The visualization sequence starts with a view of the Americas and the Pacific Ocean and soon after exposes the undersea mountain range along the Hawaiian Ridge. Internal tides data appear on the water surface and the direction of the waves reveal the interplay between the steep bathymetry and the tidal energy generated in the region. Zooming out to a global view, we spot other areas around the globe where large tides are generated, such as Tahiti, Southwest Indian Ocean and Luzon Strait and observe the motions and patterns presented by data.
Across a long swath of the North Pacific Ocean sits the Hawaiian Ridge, a massive underwater structure, high enough in a few places to reach the ocean surface and form the islands of America's 50th state. As ocean tidal currents impact the ridge, deep dense water is forced upward; gravity and buoyancy forces then tug the water down and up again, setting up oscillations called internal waves. Since the waves oscillate at the tidal period (a little over 12 hours), they are internal tides.
Once generated along the ridge, the internal tides propagate away, both northwards and southwards. Their characteristic wavelength -- about 50 to 100 km from peak to trough -- is determined by details of the ocean's stratification, which depends on water temperature and salinity. The internal tides are evidently capable of propagating great distances away from the ridge, sometime thousands of kilometers.
Within the water column the vertical displacement of water in these waves is large, often tens of meters, and even larger in a few places. But at the ocean surface, the displacement is tiny, only a few cm. Yet satellite altimeters are capable of measuring those small surface waves if we average the altimeter measurements over many years. The data visualization featured on this page shows predicted internal tides based on such multi-year analyses of satellite altimetry. The methodology of such analyses is described in publications: doi.org/10.1175/JPO-D-18-0127.1doi.org/10.1175/JPO-D-15-0065.1
The visualization sequence starts with a view of the Americas and Pacific Ocean from space and slowly zooms into the Hawaiian Islands. Shortly the ocean surface becomes semi-transparent to expose the undersea mountain range of the Hawaiian Ridge that reaches above sea level. The sequence pauses at a distance to observe the steep bathymetry, the archipelago of the eight major Hawaiian (or Windward) Islands and of the Northwestern (Leeward) Islands, which consist of small uninhabited islands, atolls, reefs and seamounts. Soon after internal tides data from NASA Goddard’s Space Flight Center simulation gradually appear on the water surface, accompanied with a colormap and a timestamp. The direction of the hourly internal tides data reveals an outward motion along the Hawaiian Ridge and brings to light the relationship between the bathymetry and tidal energy generated in the region. The internal tides data utilize a dark blue-to-white sequential colormap to illustrate the elevation below (dark blue/deep) and above(white/high) mean sea level. The hourly tide data have been interpolated linearly to fade between the hourly steps and cycle through smoothly.
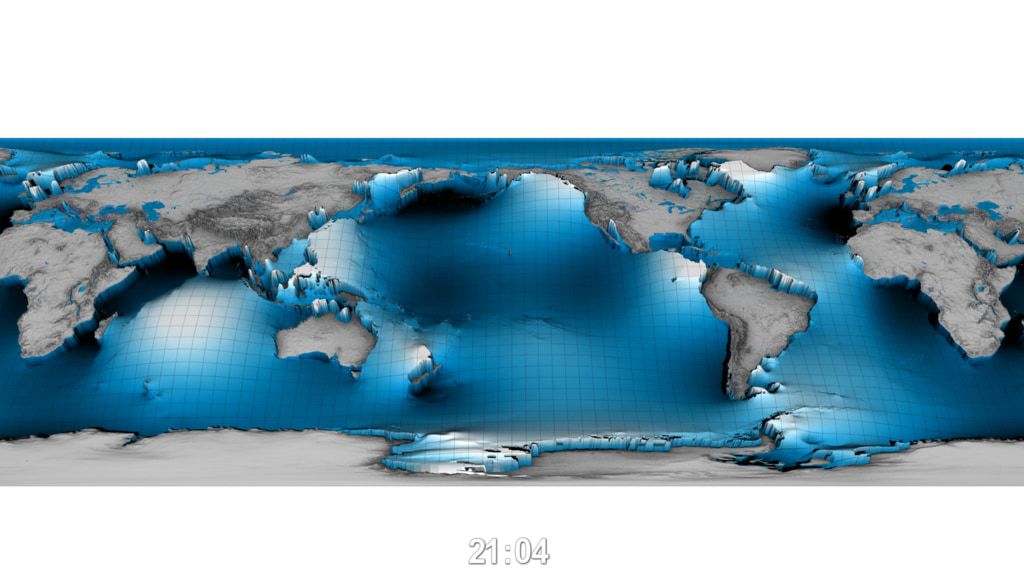
The sequence continues by zooming out of the Hawaiian Ridge and takes us on a tour around the world to spot regions with the largest internal tides all over the global ocean. This is implemented by dynamically altering the internal tides colormap and filtering out (making transparent) data values in the range [-0.75, 0.75] below/above mean sea level. The sequence shows us the strong tidal energies created over the ocean in regions with steep bathymetry and along mid-ocean ridges, such as Tahiti, Southwest Indian Ocean and Luzon Strait. The propagation patterns from these underwater regions interfere constructively and destructively, giving rise to the many complicated patterns seen in the data-driven visualizations.
Although the surface expression of internal tides, being only a few cm, seems insignificant, it provides oceanographers with a unique way to map and study the much larger internal water motion. These internal waves are an important source of mechanical energy in the ocean, and they are thought to play a key role in mixing warm upper water with cold deeper water, which is a key part of the ocean's thermohaline circulation.
Data Sources:
- Internal Tides data from NASA Goddard's Space Flight Center simulation run. The data are hourly over a period of a day (24 hours) with latitude bounds in the range [-66°, 66°]. For the visualizations featured on this page, the tide data have been interpolated linearly to fade between the hourly steps and cycle through smoothly.
- Shuttle Radar Topography Mission (SRTM) 3 Arc-Seconds version 2.1 for the Hawaiian Islands. For the purposes of this visualization, SRTM3 over land terrain data were added for the Hawaiian region with extents [18.45° – 22.47° N, 154.47° - 160.44°W]. Citation: NASA JPL. NASA Shuttle Radar Topography Mission Global 3 arc second. 2013, distributed by NASA EOSDIS Land Processes DAAC, doi: 10.5066/F7F76B1X. [Date Accessed: 11/02/2020]
- Coastlines for the Northwest Hawaiian Islands (NWHI), shared by the Hawaii Statewide GIS Program. The Northwest Hawaiian Islands are: French Frigate Shoals, Gardner Pinnacles, Kaula Rock, Kure Atoll, Laysa Island, Lisianski Island, Midway Islands, Necker Island, Nihoa Island, Pearl and Hermes Atoll. For the closeup looks at the Hawaiian Ridge the coastlines of the Northwest Hawaiian islands were incorporated. The coastline data were extracted and included as overland terrain for the subregion with extents [21.64° – 28.45°N, 160.53° – 178.37° W]. The data is shared by HawaiiStateGIS [Date Accessed: 11/25/20]
- Global 30 Arc-Second Elevation (GTOPO 30) from U.S. Geological Survey (USGS). GTOPO30 is a global raster digital elevation model (DEM) with a horizontal grid spacing of 30 arc seconds (approximately 1 kilometer). GTOPO30 was derived from several raster and vector sources of topographic information. Th data-driven visualizations featured on this page utilize the GTOPO30 model to represent the three-dimensional features of over land terrain and submarine topography world-wide. The vertically exaggerated by 15x GTOPO30 relief model, utilizes a divergent gray-to-blue colormap to separate over land terrain from bathymetry. The dry land is mapped to greys (dark gray/low to white/high) and bathymetry to blues. doi: 10.5066/F7DF6PQS.
- Blue Marble: Next Generation was produced by Reto Stöckli, NASA Earth Observatory (NASA Goddard Space Flight Center). Citation: Reto Stöckli, Eric Vermote, Nazmi Saleous, Robert Simmon and David Herring.
The Blue Marble Next Generation – A true color earth dataset including seasonal dynamics from MODIS, October 17, 2005.The visualization on this page utilizes Blue Marble data to mask water bodies from overland terrain.
The rest of this webpage offers additional versions, frames, layers and colorbar information, associated with the development of this data-driven visualization.

Frames of Earth layer for the entire duration of the visualization sequence. This set of frames is provided with transparency in 4K resolution.
Frames of colorbar and timestamp layer for the entire duration of the visualization sequence. This set of frames is provided with transparency in 4K resolution.
Colorbar of internal tides data.
Blue to white sequential colorbar to illustrate tidal elevation below (dark blue/deep) and above (white/high) mean sea level. The colorbar is animated throughout the visualization sequence by adding a linear gradient transparency on values [-0.75, 0.75] to showcase the largest tides around the world.
Colorbar created for the internal tides visualization sequence. Gray-blue divergent colorbar to separate the topograpy from bathymetry. The colorbar is applied to the Global 30 Arc-Second Elevation (GTOPO 30) relief model throughout the visualization. The bathymetry is mapped to blue hues (light blue/shallow to dark blue/deep) and the overland terrain to greys (gray/low to white/high). The colorbar is assymetrical; there are more levels below sea level than on dry land.
Credits
Please give credit for this item to:
NASA's Scientific Visualization Studio
-
Visualizers
- Helen-Nicole Kostis (USRA)
- Greg Shirah (NASA/GSFC)
- Alex Kekesi (Global Science and Technology, Inc.)
-
Scientists
- Nadya Vinogradova-Shiffer (NASA/HQ)
- Richard Ray (NASA/GSFC)
-
Technical support
- Laurence Schuler (ADNET Systems, Inc.)
- Ian Jones (ADNET Systems, Inc.)
-
Project support
- Leann Johnson (Global Science and Technology, Inc.)
- Eric Sokolowsky (Global Science and Technology, Inc.)
Release date
This page was originally published on Thursday, April 29, 2021.
This page was last updated on Wednesday, November 15, 2023 at 12:16 AM EST.
Papers used in this visualization
Zaron, E. D. (2019). Baroclinic Tidal Sea Level from Exact-Repeat Mission Altimetry, Journal of Physical Oceanography, 49(1), 193-210. Retrieved Jan 22, 2021, doi.org/10.1175/JPO-D-18-0127.1
Ray, R. D., & Zaron, E. D. (2016). M2 Internal Tides and Their Observed Wavenumber Spectra from Satellite Altimetry, Journal of Physical Oceanography, 46(1), 3-22. Retrieved Jan 22, 2021, doi.org/10.1175/JPO-D-15-0065.1
Datasets used in this visualization
-
GTOPO30 Topography and Bathymetry
ID: 274 -
DEM [SRTM: SIR-C]
ID: 481 -
BMNG (Blue Marble: Next Generation) [Terra and Aqua: MODIS]
ID: 508Credit: The Blue Marble data is courtesy of Reto Stockli (NASA/GSFC).
This dataset can be found at: http://earthobservatory.nasa.gov/Newsroom/BlueMarble/
See all pages that use this dataset -
Coastline - Northwest Hawaiian Islands (NWHI)
ID: 1106This dataset can be found at: https://geoportal.hawaii.gov/datasets/coastline-northwest-hawaiian-islands-nwhi
See all pages that use this dataset -
Internal Ocean Tides
ID: 1108Internal Tides data from NASA Goddard's Space Flight Center simulation run. The data are hourly over a period of a day (24 hours) with latitude bounds in the range [-66°, 66°]. POC: Richard Ray (NASA/GSFC)
Credit: NASA Goddard Space Flight Center
See all pages that use this dataset
Note: While we identify the data sets used in these visualizations, we do not store any further details, nor the data sets themselves on our site.
Related
- ID: 4879
 Visualization
 - ID: 4821
 Visualization
Used as a Source In
- ID: 13848
![Music: “Delightful Joy” by Eric Chevalier [SACEM]Complete transcript available.](/vis/a010000/a013800/a013848/Screen_Shot_2021-04-27_at_4.26.23_PM_print.jpg) Produced Video
Produced Video