Earth
ID: 4809
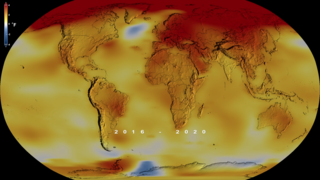
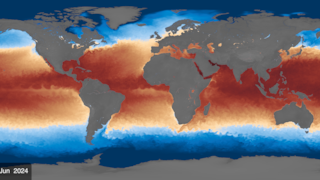
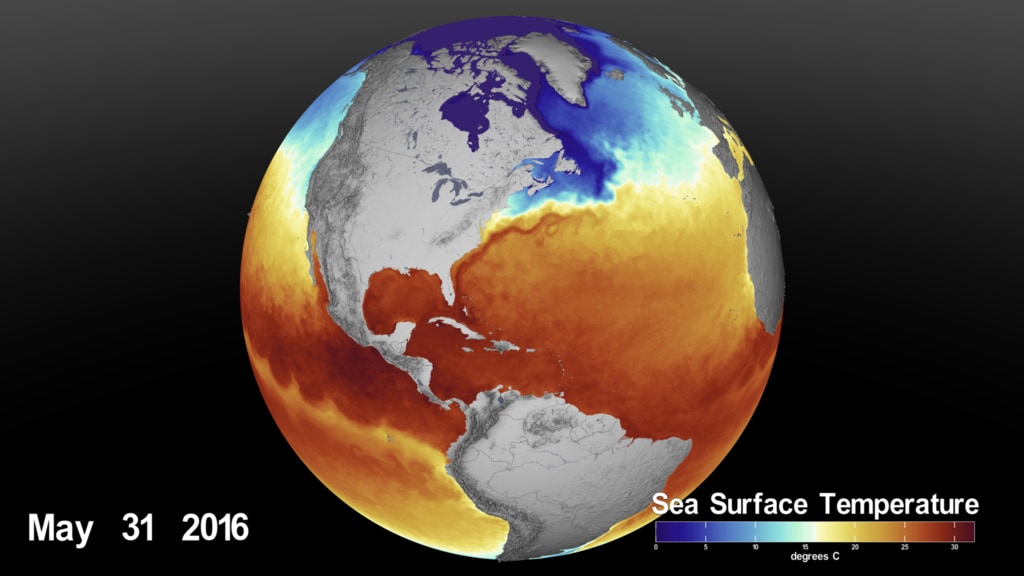
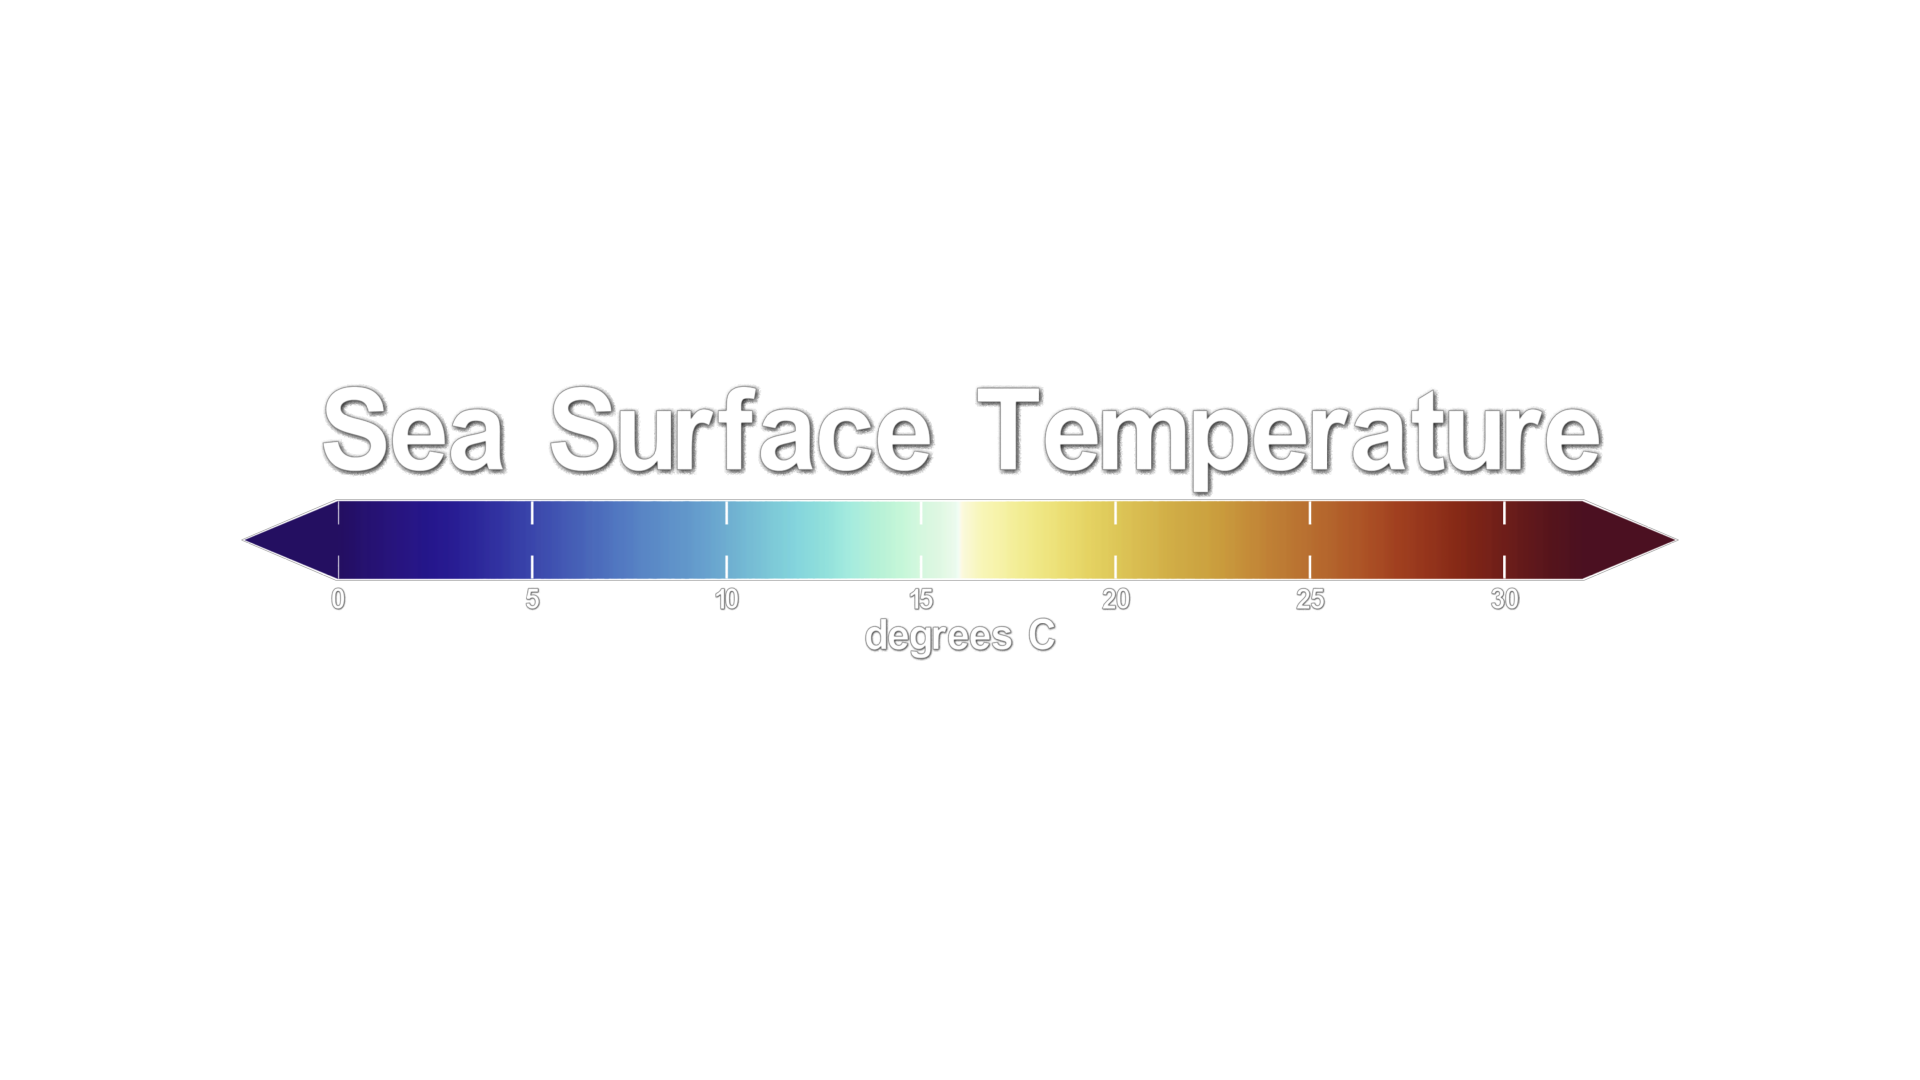
This visualization shows sea surface temperature (SST) data of the oceans from January 2016 through March 2020. The data set used is from the Jet Propulsion Laboratory (JPL) Multi-scale Ultra-high Resolution (MUR) Sea Surface Temperature Analysis. The ocean temperatures are displayed between 0 degrees celcius (C) and 32 degrees C.
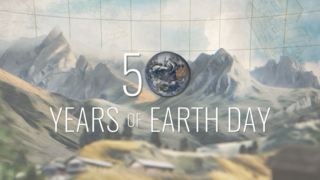
This visualization was created in part to support Earth Day 2020 media releases.
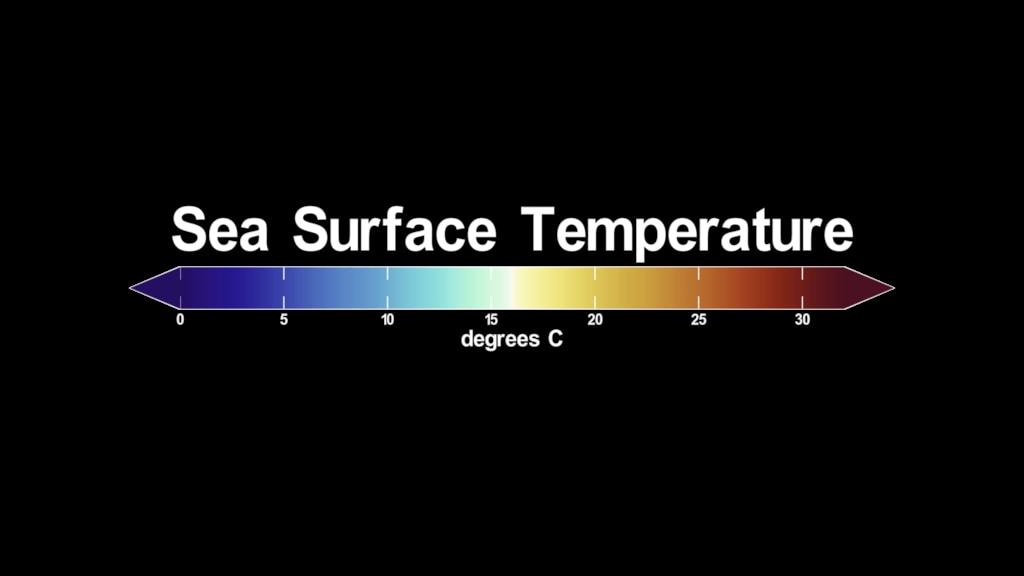
Earth Day 2020: Sea Surface Temperature (SST) from January 2016 through March 2020
This visualization was created in part to support Earth Day 2020 media releases.
Used Elsewhere In
Related

Visualization Credits
Greg Shirah (NASA/GSFC): Lead Visualizer
Horace Mitchell (NASA/GSFC): Visualizer
Ryan Fitzgibbons (USRA): Producer
Horace Mitchell (NASA/GSFC): Visualizer
Ryan Fitzgibbons (USRA): Producer
Please give credit for this item to:
NASA's Scientific Visualization Studio
NASA's Scientific Visualization Studio
Short URL to share this page:
https://svs.gsfc.nasa.gov/4809
Data Used:
Note: While we identify the data sets used in these visualizations, we do not store any further details nor the data sets themselves on our site.
This item is part of this series:
Earth Day 2020
Keywords:
SVS >> SST
SVS >> Hyperwall
NASA Science >> Earth
GCMD >> Earth Science >> Climate Indicators >> Atmospheric/ocean Indicators >> Temperature Indices
GCMD keywords can be found on the Internet with the following citation: Olsen, L.M., G. Major, K. Shein, J. Scialdone, S. Ritz, T. Stevens, M. Morahan, A. Aleman, R. Vogel, S. Leicester, H. Weir, M. Meaux, S. Grebas, C.Solomon, M. Holland, T. Northcutt, R. A. Restrepo, R. Bilodeau, 2013. NASA/Global Change Master Directory (GCMD) Earth Science Keywords. Version 8.0.0.0.0
https://svs.gsfc.nasa.gov/4809
Data Used:
Multi-scale Ultra-high Resolution (MUR) Sea Surface Temperature (SST) Analysis also referred to as: MUR SST
Analysis - JPL PO DAAC - 2016-2020This item is part of this series:
Earth Day 2020
Keywords:
SVS >> SST
SVS >> Hyperwall
NASA Science >> Earth
GCMD >> Earth Science >> Climate Indicators >> Atmospheric/ocean Indicators >> Temperature Indices
GCMD keywords can be found on the Internet with the following citation: Olsen, L.M., G. Major, K. Shein, J. Scialdone, S. Ritz, T. Stevens, M. Morahan, A. Aleman, R. Vogel, S. Leicester, H. Weir, M. Meaux, S. Grebas, C.Solomon, M. Holland, T. Northcutt, R. A. Restrepo, R. Bilodeau, 2013. NASA/Global Change Master Directory (GCMD) Earth Science Keywords. Version 8.0.0.0.0


