NASA Looks Back at 50 Years of Earth Day
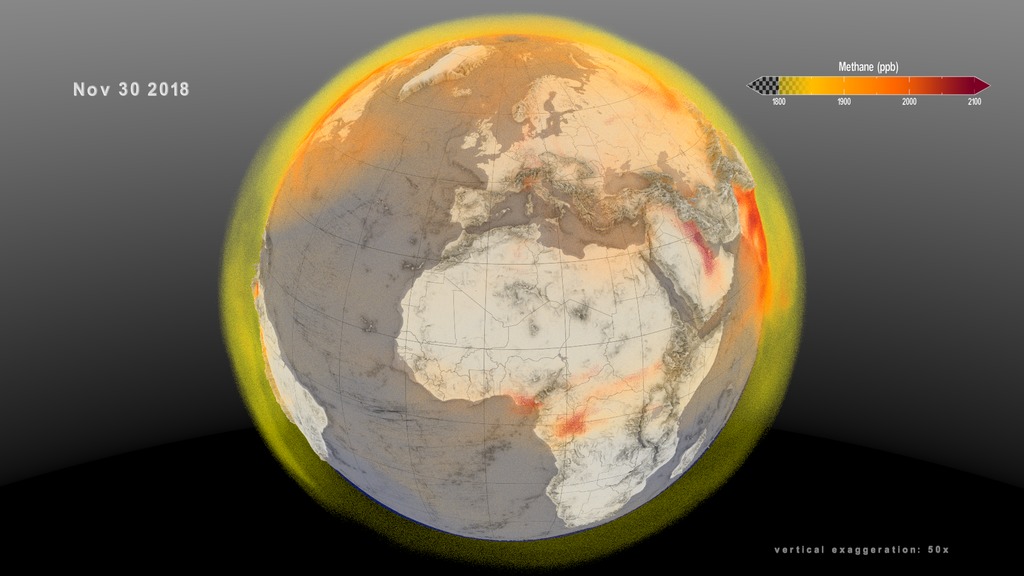
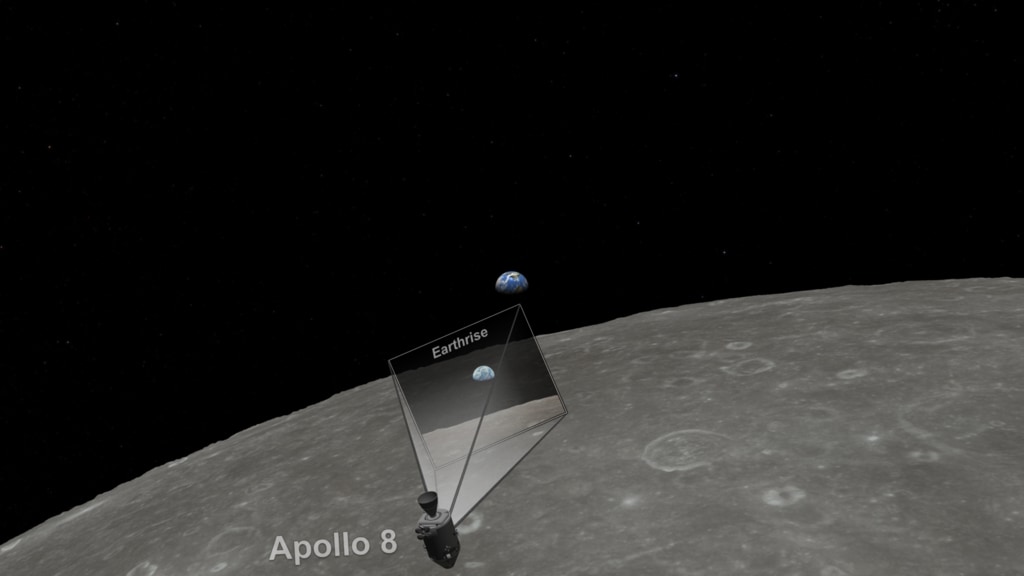
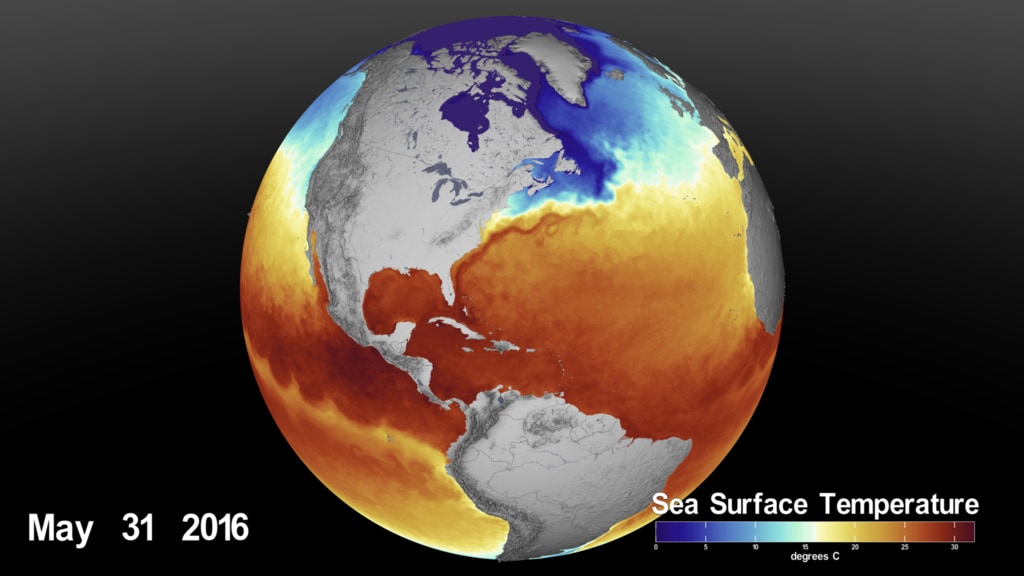
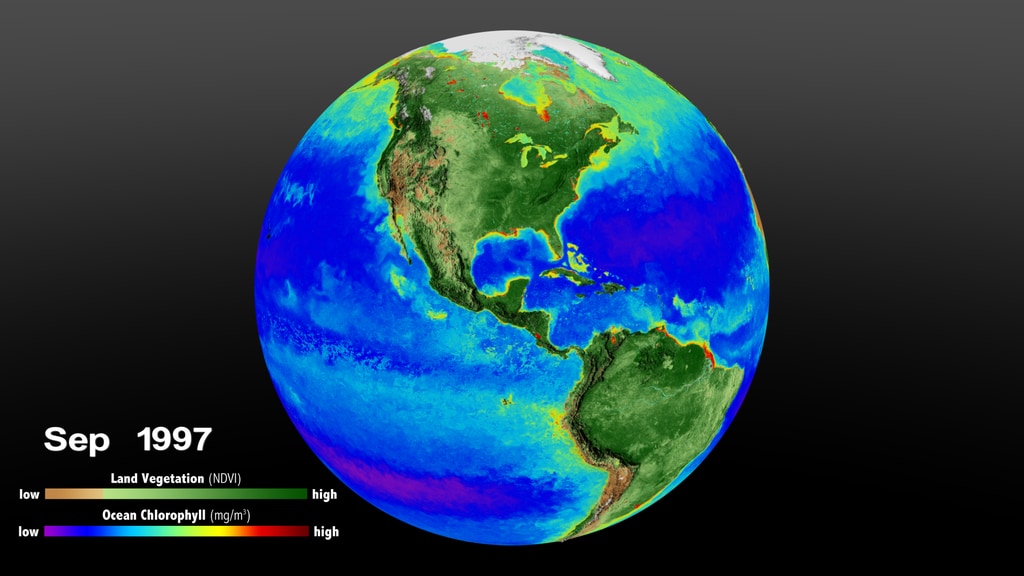
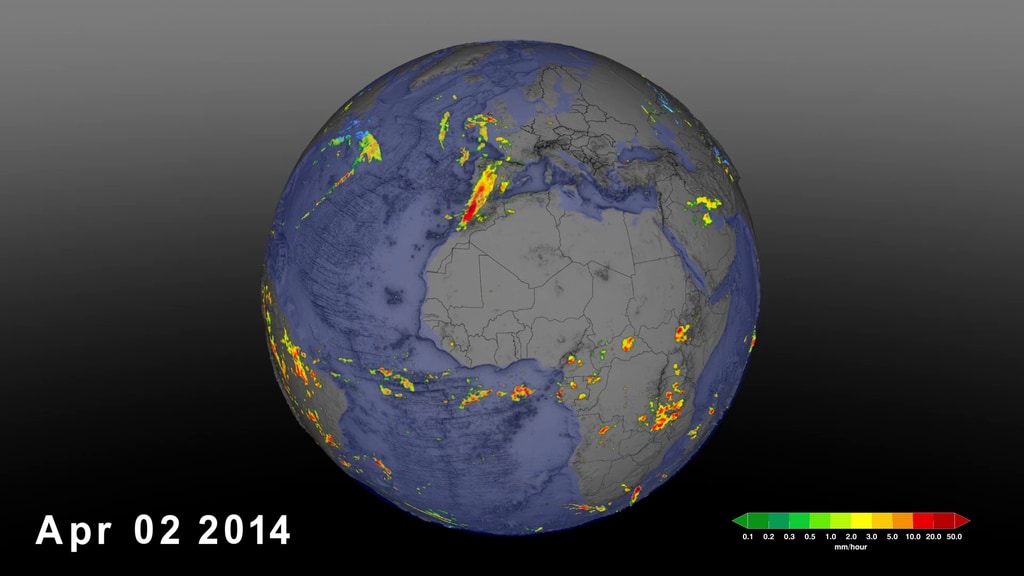
- Visualizations by:
- Krystofer Kim,
- Alex Kekesi,
- Cindy Starr,
- Greg Shirah,
- Horace Mitchell,
- Kel Elkins, and
- Trent L. Schindler
- Written by:
- Maria-Jose Vinas Garcia
- Edited by:
- Ryan Fitzgibbons
- Produced by:
- Jefferson Beck,
- Kathryn Mersmann, and
- Ryan Fitzgibbons
- View full credits
Movies
- EarthDay_prores.mov (1920x1080) [1.3 GB]
- EarthDay_v6.mp4 (1920x1080) [151.6 MB]
- EarthDay_prores.webm (1920x1080) [20.8 MB]
Captions
- EarthDay.en_US.srt [1.5 KB]
- EarthDay.en_US.vtt [1.5 KB]
Images
- ED_EN_thumb_print.jpg (1024x576) [96.2 KB]
- ED_EN_thumb.png (1920x1080) [3.1 MB]
- ED_EN_thumb_thm.png (80x40) [7.5 KB]
- ED_EN_thumb_searchweb.png (320x180) [99.2 KB]
Music: "Crest of a Wave," Lorenzo Castellarin, Universal Production Music
Complete transcript available.
Movies
- EarthDay_Spanish_v2.mp4 (1920x1080) [151.8 MB]
- EarthDay_SPANISH_prores.mov (1920x1080) [1.9 GB]
- EarthDay_SPANISH_prores.webm (1920x1080) [21.1 MB]
Images
- ED_ES_thumb_print.jpg (1024x576) [98.4 KB]
- ED_ES_thumb.png (1920x1080) [3.1 MB]
- ED_ES_thumb_thm.png (80x40) [7.5 KB]
- ED_ES_thumb_searchweb.png (320x180) [99.4 KB]
Spanish version of the video.
Credits
Please give credit for this item to:
NASA's Goddard Space Flight Center
Animator
- Krystofer Kim (KBRwyle) [Lead]
Visualizers
- Alex Kekesi (GST) [Lead]
- Cindy Starr (GST) [Lead]
- Greg Shirah (NASA/GSFC) [Lead]
- Horace Mitchell (NASA/GSFC) [Lead]
- Kel Elkins (USRA) [Lead]
- Trent L. Schindler (USRA) [Lead]
Writer
- Maria-Jose Vinas Garcia (Telophase) [Lead]
Editor
- Ryan Fitzgibbons (KBRwyle) [Lead]
Producers
- Jefferson Beck (KBRwyle) [Lead]
- Kathryn Mersmann (KBRwyle) [Lead]
- Ryan Fitzgibbons (KBRwyle) [Lead]
- Samson K. Reiny (Wyle Information Systems)
Technical support
- Aaron E. Lepsch (ADNET)
Series
This visualization can be found in the following series:Related pages
Celebrate Earth Day with NASA’s World-Wide View of Our Changing Climate Live Shots
April 19th, 2021
Read moreQuick link to associated BROLL for the live shots.Quick link to canned interview with Dr. Gavin SchmidtQuick link to canned interview in Spanish with Erika Podest Canned interview with Dr. Gavin Schmidt, acting NASA Senior Climate Advisor. TRT 6:12 Canned interview in Spanish with Erika Podest. TRT 7:15 Most people know NASA as the forefront of space exploration, from landing robots on Mars to sending humans into space. But did you know that one of NASA’s biggest fields of study is planet Earth? Studying Earth’s land, sea and air not only refines the spacecraft that we send to space, it also tells us an incredible amount about our home planet. From the International Space Station to NASA’s Earth observing satellites, NASA instruments create a continuous data record that track global changes over time. Coupled with observations from the air, sea and land, these records are used across the globe in myriad ways, from improving the planting of crops to understanding the impacts of sea level rise. NASA experts are available virtually for live or taped interviews on Thursday, April 22 from 8:00 a.m. to 1:00 p.m. EDT to share with your viewers how they can celebrate with NASA’s Earth Day activities and explain NASA’s role in studying Earth. To Schedule an interview: Please fill out this form**: https://forms.gle/Zv5Ximf2bpHf7pAk8**Please note: requests received after 5:00 p.m. EDT on Wednesday, April 21 may not be accommodated.Interviews will be conducted using video chat programs including Zoom and Skype, in 15-minute slots. For example 600-615 ET, 615-630 EDT, etc. Our preferred program is Zoom and stations will have to send us a Zoom link to use. Satellite interviews are not available. Please do not use an IFB unless necessary.*Spanish Interviews are available*Participating Scientists/Engineers:Karen St. Germain, Earth Science Division DirectorDouglas Terrier, Chief TechnologistDoug Morton, Chief of the Biospheric Sciences LaboratoryLiz Hoy, Senior Support ScientistLesley Ott, Climate ScientistJohn Bolten, Physical Research ScientistIvona Cetinić, OceanographerRachel Tilling, Research ScientistDenis Felikson, Research ScientistMatt Rodell, Acting Deputy Director of Earth Sciences for Hydrosphere, Biosphere, and GeophysicsBridget Seegers, Research ScientistSandra Cauffman, Deputy Director, Earth Science Division [Interviews in Spanish]Alfonso Delgado-Bonal, Associate Scientist [Interviews in Spanish]Erika Podest, Scientist [Interviews in Spanish]Suggested Questions:1. When most people think of NASA, they might think of space exploration. What is NASA’s connection to Earth Day?2. NASA will launch a crew to the International Space Station tomorrow morning. What are some of the missions and instruments on the International Space Station that benefit Earth?3. Climate change is one of the major issues of our generation. What has studying Earth from space taught us about climate change?4. How does climate change impact* [*Please select the question that you believe will hold the most interest for your viewers.]Hurricane trends after the record-breaking 30 named storms last year? Wildfires?Sea level rise?Floods and droughts?General weather trends that impact viewers all over the country?5. One of NASA’s longest running Earth science missions, Landsat, is launching a new satellite later this year. Can you tell us a little bit more about this mission?6. Where can people learn more about NASA Earth Day activities? Longer Interview Questions:1. NASA also observes Earth from a bit closer to the ground. Can you talk about some of your field and airborne campaigns?2. NASA has started a recent “Grow to Launch” campaign. What is that campaign and how can people get involved?Suggested Anchor Intro: “WHEN YOU THINK OF NASA, YOU MIGHT THINK OF ROCKETS LAUNCHING TO ANOTHER PLANET AND HUMANS WALKING ON THE MOON. BUT NASA ACTUALLY HAS A VARIETY OF MISSIONS THAT FOCUS ON STUDYING CHANGES ON EARTH, FROM SEA LEVEL RISE TO HURRICANES. HERE TO CELEBRATE EARTH DAY WITH US IS NASA….” For More InformationSee [https://earthobservatory.nasa.gov/features/videos/window-on-the-world](https://earthobservatory.nasa.gov/features/videos/window-on-the-world) Related pages
NASA Observes the 50th Anniversary of Earth Day Live Shots
April 16th, 2020
Read moreClick here for quick link to B-ROLLClick here for EARTH DAY TOOLKIT including how you can learn more about NASA at HomeQuick link to canned interview in Spanish with Sandra CauffmanQuick link to canned interview with Michelle Thaller B-roll for Earth day Live Shot. Canned interview in Spanish with Sandra Cauffman / Acting Director, Earth Science Division, NASA HQ. TRT 3:43 Canned interview with Dr. Michelle Thaller. TRT 4:39. Transcript included In 1968 William Anders, an astronaut on the Apollo 8 mission, captured “Earthrise” — a photo of Earth appearing above the Moon’s horizon. The photo helped unite a generation to appreciate the fragility and beauty of our planet and inspire the first Earth Day less than two years later. To mark the 50th anniversary of Earth Day, NASA is reflecting on what we’ve learned about our home planet. Chat with NASA scientists on Wednesday, April 22 from 6:00 a.m. to 1:00 p.m. EDT to find out how NASA satellites have changed our understanding of Earth, how different technologies have benefited the environment and how viewers can join NASA in observing Earth Day from home. * Interviews will be conducted using video chat programs including Skype and Facetime *To Schedule an interview fill out this form: https://forms.gle/1vHuKfhheLid7TKu8 NASA has been at the forefront of space exploration, from landing robots on Mars to sending humans into space. But one of NASA’s biggest fields of study is our planet, Earth. Of all the planets that NASA studies, none have matched the complexity of Earth. NASA’s Earth observing satellites provide a global mosaic of change over time. That coupled with observations from the air, sea and land provide a robust view of our dynamic planet. NASA technology is all around us. The very technology that helps us understand planets in the solar system also helps us understand and protect Earth. NASA’s aeronautics division is using ‘spinoff’ technology right now to develop an all-electric aircraft that will make airline travel greener. Another division is testing a strong, lightweight composite material that will make wind turbines larger and more efficient. Participating IntervieweesDouglas Terrier / Chief Technologist, NASA HQSandra Cauffman / Acting Director, Earth Science Division, NASA HQ [interviews in Spanish]Carlos Del Castillo / NASA Scientist [interviews in Spanish]Annmarie Eldering/ NASA ScientistPeter Griffith/ NASA ScientistSuggested QuestionsWhen most people think of NASA, they think space exploration. What is NASA’s connection to Earth Day?What has NASA learned about Earth in the last five decades?How does NASA help to protect our environment here on Earth?NASA technology is everywhere. What are some space technologies that can benefit the environment here on Earth? Where can people learn more about NASA Earth Day activities? Find out more on Twitter @NASAEarth and online at nasa.gov/earthday Related pages
Earth Day 2020: Global Atmospheric Methane
April 20th, 2020
Read moreThis 3D volumetric visualization shows a global view of the methane emission and transport between December 1, 2017 and November 30, 2018. This visualizaion of the rotating global view is designed to be played in a continuous loop.This video is also available on our YouTube channel. The global methane visualization alone in OpenExr format.(Note: This frame set was converted to the sRGB color space on 6/16/2020) A high resolution still of the global methane on January 26, 2018 with transparency. The colorbar with transparency The date sequence alone in OpenExr format.(Note: This frame set was converted to the sRGB color space on 6/16/2020) The background sequence alone in OpenExr format.(Note: This frame set was converted to the sRGB color space on 6/16/2020) The overlay with the colorbar and the exaggeration. THis version shows the volumetric global methane emission and transport between Dec 1 and Nov 30. It is designed to show methane emissions greater than 1800 parts per billion. Methane is a powerful greenhouse gas that traps heat 28 times more effectively than carbon dioxide over a 100-year timescale. Concentrations of methane have increased by more than 150% since industrial activities and intensive agriculture began. After carbon dioxide, methane is responsible for about 20% of climate change in the twentieth century. Methane is produced under conditions where little to no oxygen is available. About 30% of methane emissions are produced by wetlands, including ponds, lakes and rivers. Another 20% is produced by agriculture, due to a combination of livestock, waste management and rice cultivation. Activities related to oil, gas, and coal extraction release an additional 30%. The remainder of methane emissions come from minor sources such as wildfire, biomass burning, permafrost, termites, dams, and the ocean. Scientists around the world are working to better understand the budget of methane with the ultimate goals of reducing greenhouse gas emissions and improving prediction of environmental change. For additional information, see the Global Methane Budget.The NASA SVS visualization presented here shows the complex patterns of methane emissions produced around the globe and throughout the year from the different sources described above. The visualization was created using output from the Global Modeling and Assimilation Office, GMAO, GEOS modeling system, developed and maintained by scientists at NASA. Wetland emissions were estimated by the LPJ-wsl dynamic global vegetation model, which simulates the temperature and moisture dependent methane emission processes using a variety of satellite data to determine what parts of the globe are covered by wetlands. Other methane emission sources come from inventories of human activity. The height of Earth’s atmosphere and topography have been vertically exaggerated and appear approximately 50-times higher than normal in order to show the complexity of the atmospheric flow while the bathymetry below sea level is exaggerated by 11.6-times. Outflow from different regions result from different sources. For example, high methane concentrations over South America are driven by wetland emissions while over Asia, emissions reflect a mix of agricultural and industrial activities. Emissions are transported through the atmosphere as weather systems move and mix methane around the globe. In the atmosphere, methane is eventually removed by reactive gases that convert it to carbon dioxide. Understanding the three-dimensional distribution of methane is important for NASA scientists planning observations that sample the atmosphere in very different ways. Satellites like GeoCarb, a planned geostationary mission to observe both carbon dioxide and methane, look down from space and will estimate the total number of methane molecules in a column of air. Aircraft, like those launched during NASA’s Arctic Boreal Vulnerability Experiment (ABOVE) sample the atmosphere along very specific flight lines, providing additional details about the processes controlling methane emissions at high latitudes. Atmospheric models help place these different types of measurements in context so that scientists can refine estimates of sources and sinks, understand the processes controlling them and reduce uncertainty in future projections of carbon-climate feedbacks. Related pages
Earth Day 2020: Apollo-8 to Earth observing fleet
April 20th, 2020
Read morePush in from the far side of the Moon to Apollo-8 take the "Earthrise" photo; then push in to NASA's Earth observing fleet in 1970 (the first Earth Day), then transition to the Earth observing fleet in 2020 (the 50th anniversary of Earth Day)This video is also available on our YouTube channel. This visualization was created as an introductory shot to video celebrating the 50th anniersary of Earth Day. The camera approaches the moon from the far side, with Earth behind the moon. The camera moves over the limb revealing Apollo-8, when Bill Anders took the iconic "Earthrise" photo that inspired Earth Day and the environmental movement.The camera then pushes in quickly to the Earth revealing the Earth observing spacecraft that were in orbit in 1970, the year of the first Earth Day. Finally, the orbits from other years are flashed on until we reach the orbits for 2020, the 50th anniversary of Earth Day. Related pages
Earth Day 2020: Gulf Stream ocean current pull out to Earth observing fleet
April 20th, 2020
Read moreOcean currents from the ECCO-2 model: starting underwater, then pulling back to see the Gulf Stream, pulling back farther revealing the Earth observing fleetThis video is also available on our YouTube channel. The ocean currents are colored by depth from white (5 meters below the surface) down to dark blue (5906 meters below the surface). The color bar is non-linear; there are more levels near the surface than deeper. This visualization was created to be one of the final shots of a video celebrating the 50th anniversary of Earth Day. The camera starts under water off the coast of the Eastern United States showing layers of ocean currents from a computational model called ECCO-2. The camera slowly pulls back revealing the Gulf Stream, one of the most powerful ocean currents on Earth. The camera continues to pull back revealing NASA's Earth observing fleet. Related pages
Earth Day 2020: Sea Surface Temperature (SST) from January 2016 through March 2020
April 20th, 2020
Read moreSea Surface Temperature - composited version with all layers includedThis video is also available on our YouTube channel. Sea Surface Temperature (SST) data layer with alpha Dates layer with alpha Background layer Sea Surface Temperature color bar: color range is blue - cyan -gray - yellow - red; value range is 0 to 32 degrees Celcius This visualization shows sea surface temperature (SST) data of the oceans from January 2016 through March 2020. The data set used is from the Jet Propulsion Laboratory (JPL) Multi-scale Ultra-high Resolution (MUR) Sea Surface Temperature Analysis. The ocean temperatures are displayed between 0 degrees celcius (C) and 32 degrees C.This visualization was created in part to support Earth Day 2020 media releases. Related pages
Earth Day 2020: Biosphere
April 20th, 2020
Read moreGlobal Biosphere data from 1997 through 2017 with corresponding colorbars and date stamp.This video is also available on our YouTube channel. Rotating globe showing the Earth's biosphere over a 20 year period. Date overlay. Normalized Difference Vegetation Index (NDVI) colorbar. More commonly known as Land Vegetation. Ocean Chlorophyll colorbar. By monitoring the color of reflected light via satellite, scientists can determine how successfully plant life is photosynthesizing. A measurement of photosynthesis is essentially a measurement of successful growth, and growth means successful use of ambient carbon. This data visualization represents twenty years' worth of data taken primarily by SeaStar/SeaWiFS, Aqua/MODIS, and Suomi NPP/VIIRS satellite sensors, showing the abundance of life both on land and in the sea. In the ocean, dark blue to violet represents warmer areas where there is little life due to lack of nutrients, and greens and reds represent cooler nutrient-rich areas. The nutrient-rich areas include coastal regions where cold water rises from the sea floor bringing nutrients along and areas at the mouths of rivers where the rivers have brought nutrients into the ocean from the land. On land, green represents areas of abundant plant life, such as forests and grasslands, while tan and white represent areas where plant life is sparse or non-existent, such as the deserts in Africa and the Middle East and snow-cover and ice at the poles. Related pages
Earth Day 2020: IMERG Precipitation
April 19th, 2020
Read moreIMERG Visualization, With LabelsThis video is also available on our YouTube channel. IMERG Visualization, No Labels This visualization shows the IMERG precipitation product for April, May, and June of 2014.This visualization was created in part to support Earth Day 2020 media releases. Related pages
Earth Day 2020: Normalized Difference Vegetation Index (NDVI) Seasonal Cycles
April 19th, 2020
Read moreNDVI Seasonal Cycles, With LabelsThis video is also available on our YouTube channel. NDVI Seasonal Cycles, No Labels This visualization shows the Normalized Difference Vegetation Index (NDVI) over seaveral seasonal cycles. This NDVI dataset is part of the Next Generation Blue Marble product.This visualization was created in part to support Earth Day 2020 media releases. Related pages
Earth Day 2020: GRACE Groundwater Storage
April 19th, 2020
Read moreGRACE Groundwater Storage, With LabelsThis video is also available on our YouTube channel. GRACE Groundwater Storage, No Labels This visualization shows groundwater storage as measured by the Gravity Recovery and Climate Experiment (GRACE) between August 2005 and June 2014 (the date range for the visualization was chosen for convenience rather than scientific significance).This visualization was created in part to support Earth Day 2020 media releases. Related pages
Earth Day 2020: GEOS-5 Modeled Cloud Cover
April 19th, 2020
Read moreGEOS-5 Modeled Cloud Cover, With LabelsThis video is also available on our YouTube channel. GEOS-5 Modeled Cloud Cover, No Labels This visualization shows cloud cover as modeled by the GEOS-5 atmospheric model, using observations as its input, over the course of three days. The time period repeats halfway through the animation.This visualization was created in part to support Earth Day 2020 media releases. Related pages
Earth Day 2020: CERES Net TOA Radiation
April 16th, 2020
Read moreCERES Net TOA Radiation, WIth LabelsThis video is also available on our YouTube channel. CERES Net TOA Radiation, No Labels Colorbar This visualization shows top-of-atmosphere (TOA) net radiation for the Earth, as measured from space by the CERES instrument, for the period of August 2005 to July 2014 (this period was chosen for convenience rather than for scientific significance). The net radiation is the difference between absorbed solar radiation and outgoing longwave radiation.This visualization was created in part to support Earth Day 2020 media releases. Related pages
Earth Day 2020: Sea Surface Salinity (SSS) from August 2011 through July 2014
April 14th, 2020
Read moreSea Surface Salinity This visualization shows sea surface salinity (SSS) data of the oceans from August 2011 through July 2014. The data set used is from the Aquarius satellite. Aquarius is a collaboration between NASA and the Space Agency of Argentina to measure global sea surface salinity (the amount of dissolved salts in water). Measuring salinity can help us better understand the water cycle and can also lead to improved climate models.This visualization was created in part to support Earth Day 2020 media releases. Related pages
SVS Demo Reel 2020
Feb. 17th, 2021
Read moreThis is the SVS Demo Reel submitted to SIGGRAPH 2021.Coming soon to our YouTube channel. Music Credit:"Always A Way" by Stefan Rodescu [SACEM], Yannick Kalfayan [SACEM], Universal Production Music Related pages