Earth
ID: 5161
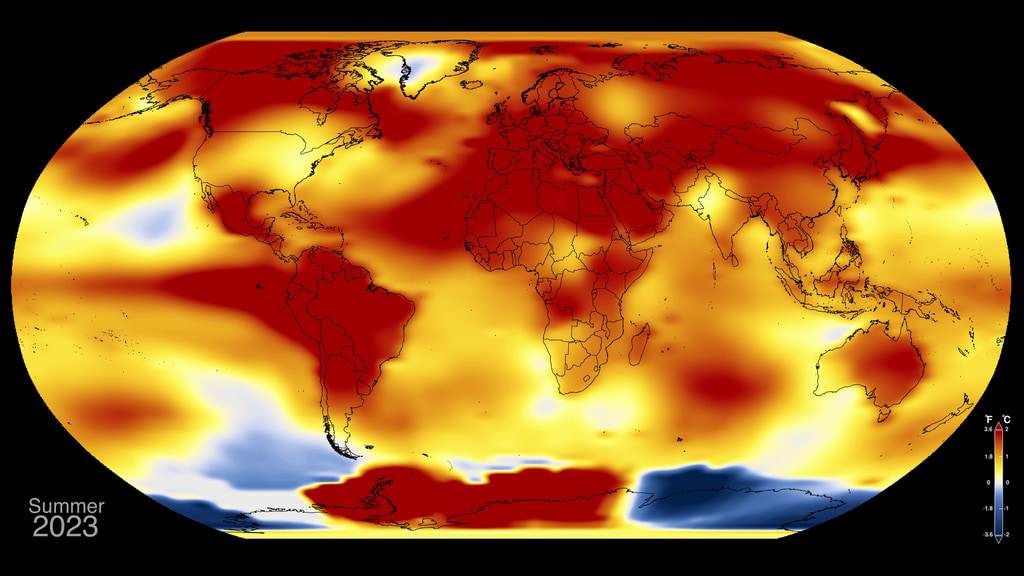
The summer of 2023 was Earth’s hottest since global records began in 1880, according to an analysis by scientists at NASA’s Goddard Institute of Space Studies (GISS) in New York.
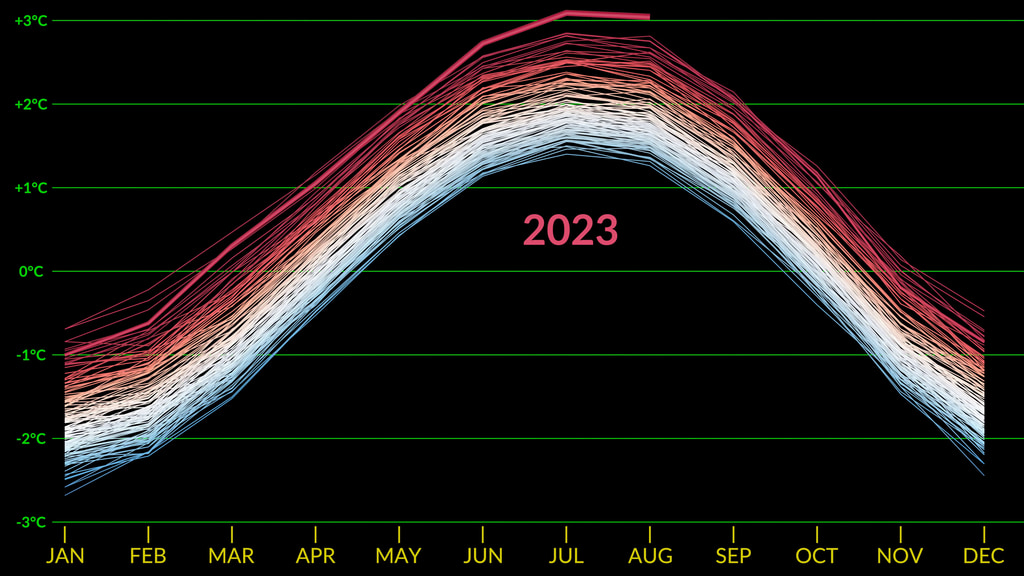
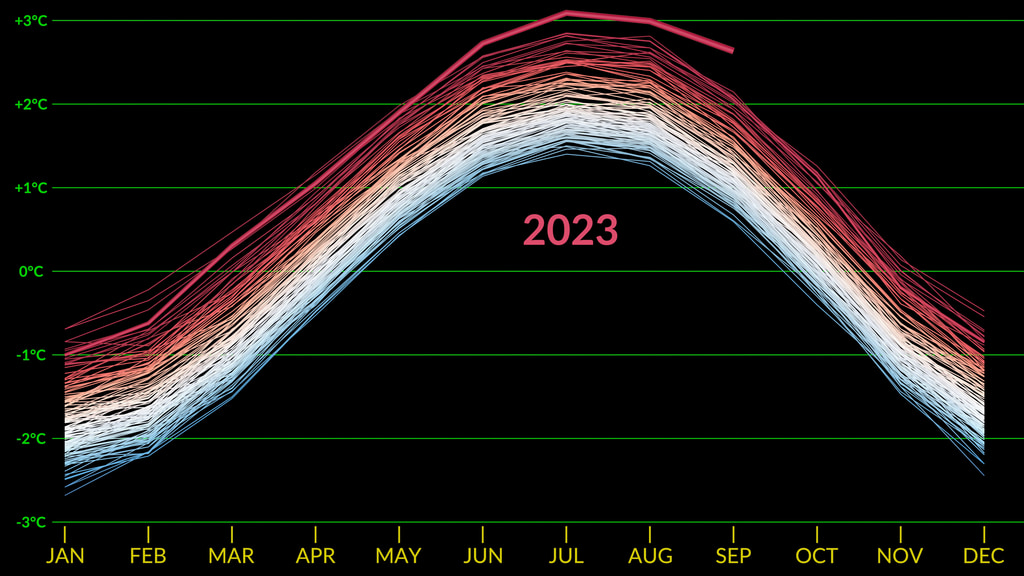
The months of June, July, and August combined were 0.41 degrees Fahrenheit (0.23 degrees Celsius) warmer than any other summer in NASA’s record, and 2.1 degrees F (1.2 C) warmer than the average summer between 1951 and 1980. August alone was 2.2 F (1.2 C) warmer than the average. June through August is considered meteorological summer in the Northern Hemisphere.
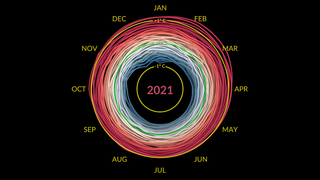
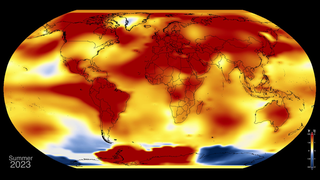
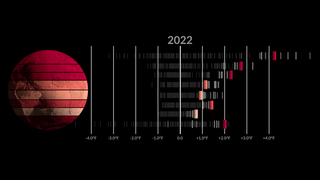
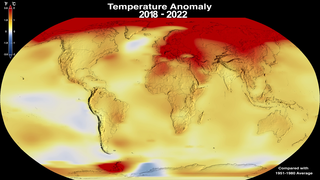
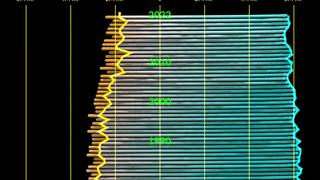
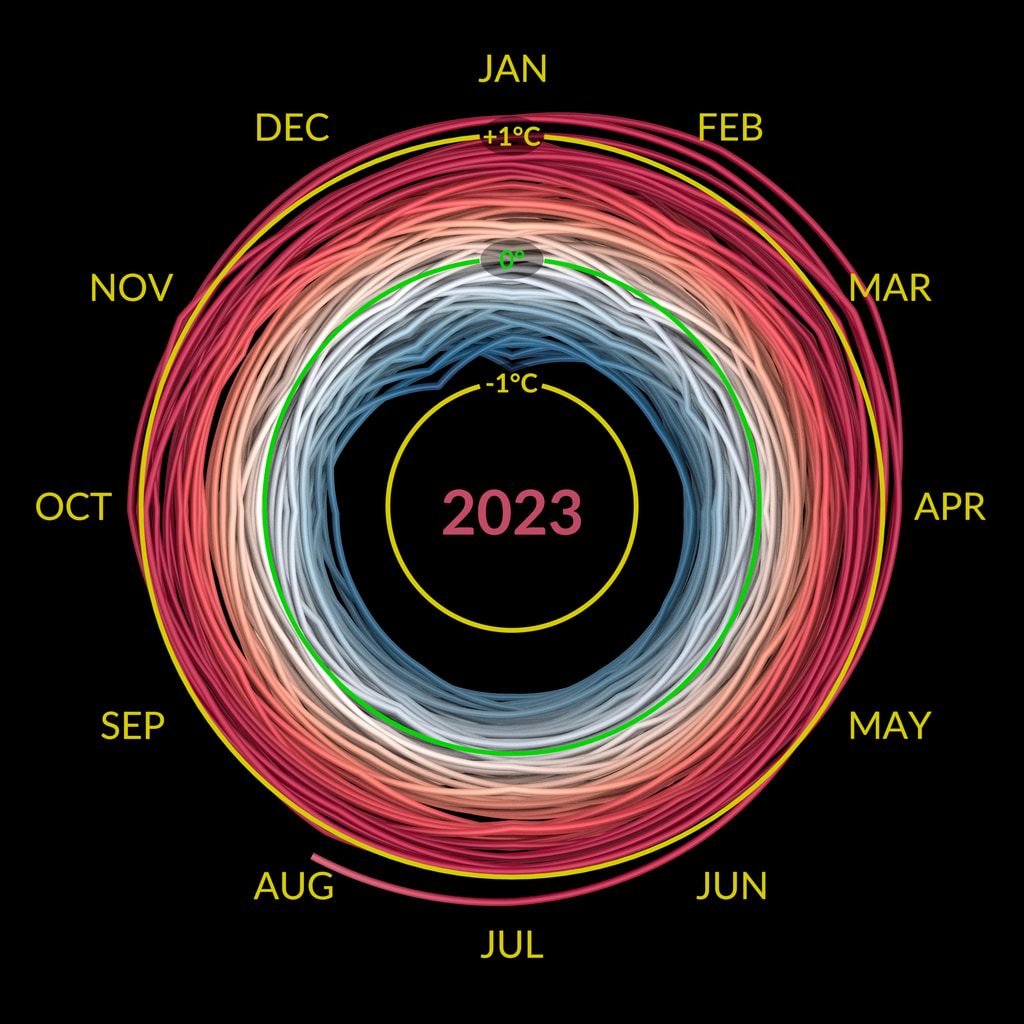
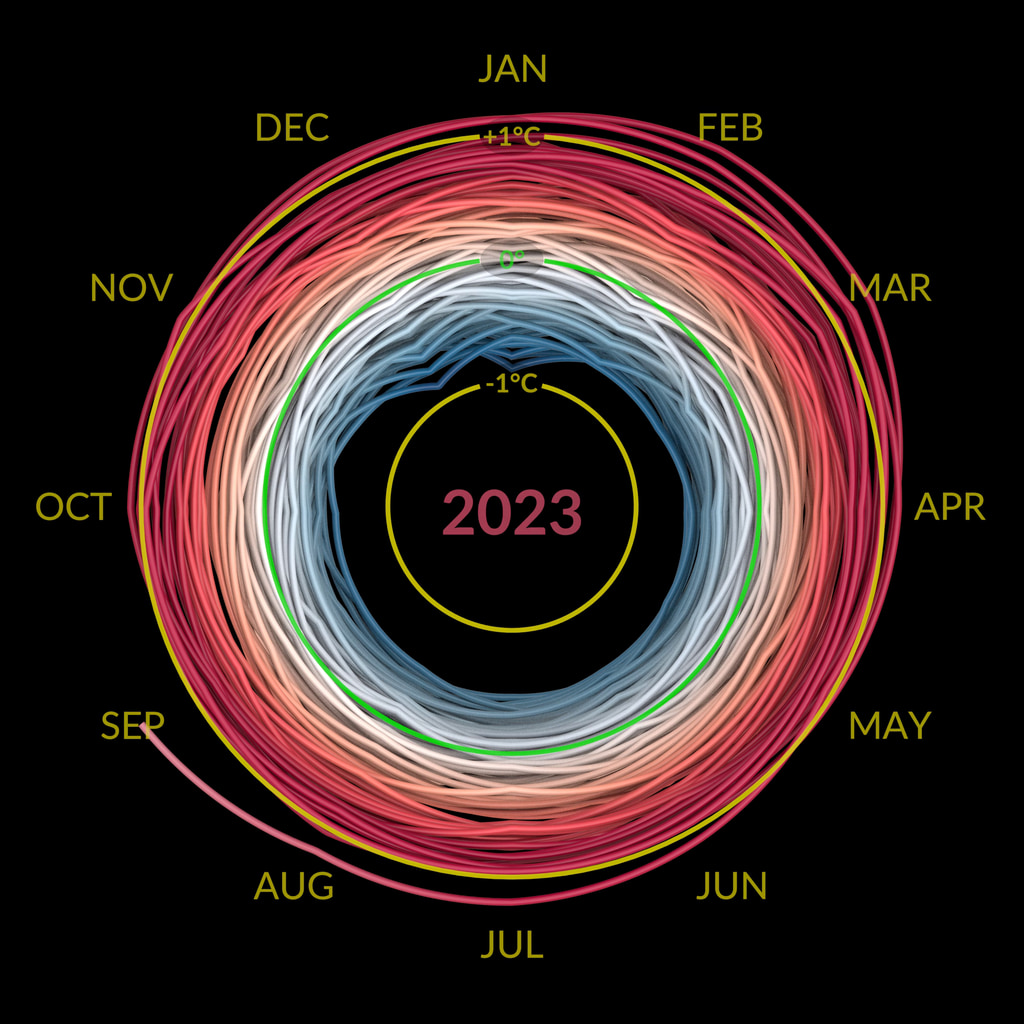
Three graphics are provided here. A map showing the regional variation of temperature anomalies, a plot of monthly temperature anomalies with the seasonal cycle included, and a climate spiral graphic plotting monthly temperature anomalies without the seasonal cycle.
Temperature anomalies are deviations from a long term global average. In this case the period 1951-1980 is used to define the baseline for the anomaly. These temperature anomalies are based on the GISS Surface Temperature Analysis (GISTEMP v4), an estimate of global surface temperature change. The data file used to create this visualization is publicly accessible here.
The Goddard Institute of Space Studies (GISS) is a NASA laboratory managed by the Earth Sciences Division of the agency’s Goddard Space Flight Center in Greenbelt, Maryland. The laboratory is affiliated with Columbia University’s Earth Institute and School of Engineering and Applied Science in New York.
Additional versions of these graphics labeled in Fahrenheit and Spanish are below.
Summer 2023 Record High Global Temperatures
The months of June, July, and August combined were 0.41 degrees Fahrenheit (0.23 degrees Celsius) warmer than any other summer in NASA’s record, and 2.1 degrees F (1.2 C) warmer than the average summer between 1951 and 1980. August alone was 2.2 F (1.2 C) warmer than the average. June through August is considered meteorological summer in the Northern Hemisphere.
Three graphics are provided here. A map showing the regional variation of temperature anomalies, a plot of monthly temperature anomalies with the seasonal cycle included, and a climate spiral graphic plotting monthly temperature anomalies without the seasonal cycle.
Temperature anomalies are deviations from a long term global average. In this case the period 1951-1980 is used to define the baseline for the anomaly. These temperature anomalies are based on the GISS Surface Temperature Analysis (GISTEMP v4), an estimate of global surface temperature change. The data file used to create this visualization is publicly accessible here.
The Goddard Institute of Space Studies (GISS) is a NASA laboratory managed by the Earth Sciences Division of the agency’s Goddard Space Flight Center in Greenbelt, Maryland. The laboratory is affiliated with Columbia University’s Earth Institute and School of Engineering and Applied Science in New York.
Additional versions of these graphics labeled in Fahrenheit and Spanish are below.
Older Version
Related

Visualization Credits
Mark SubbaRao (NASA/GSFC): Lead Visualizer
Ed Hawkins (National Centre for Atmospheric Science, University of Reading): Visualizer
Laurence Schuler (ADNET Systems, Inc.): Technical Support
Ian Jones (ADNET Systems, Inc.): Technical Support
Eytan Kaplan (Global Science and Technology, Inc.): Web Administrator
Gavin A. Schmidt (NASA/GSFC GISS): Lead Scientist
Peter H. Jacobs (NASA/GSFC): Lead Science Support
Please give credit for this item to:
NASA's Scientific Visualization Studio
NASA's Scientific Visualization Studio
Short URL to share this page:
https://svs.gsfc.nasa.gov/5161
Data Used:
Note: While we identify the data sets used in these visualizations, we do not store any further details nor the data sets themselves on our site.
Keywords:
SVS >> Climate
SVS >> Climate Change
SVS >> Spanish
NASA Science >> Earth
NASA Earth Science Focus Areas >> Climate Variability and Change
SVS >> Earth Information Center
https://svs.gsfc.nasa.gov/5161
Data Used:
GISS Surface Temperature Analysis (GISTEMP)/GISTEMP
Model - NASA/GISSMERRA-2 also referred to as: MERRA-2
Model - GMAOKeywords:
SVS >> Climate
SVS >> Climate Change
SVS >> Spanish
NASA Science >> Earth
NASA Earth Science Focus Areas >> Climate Variability and Change
SVS >> Earth Information Center


