Arctic Sea Ice Minimum 2023
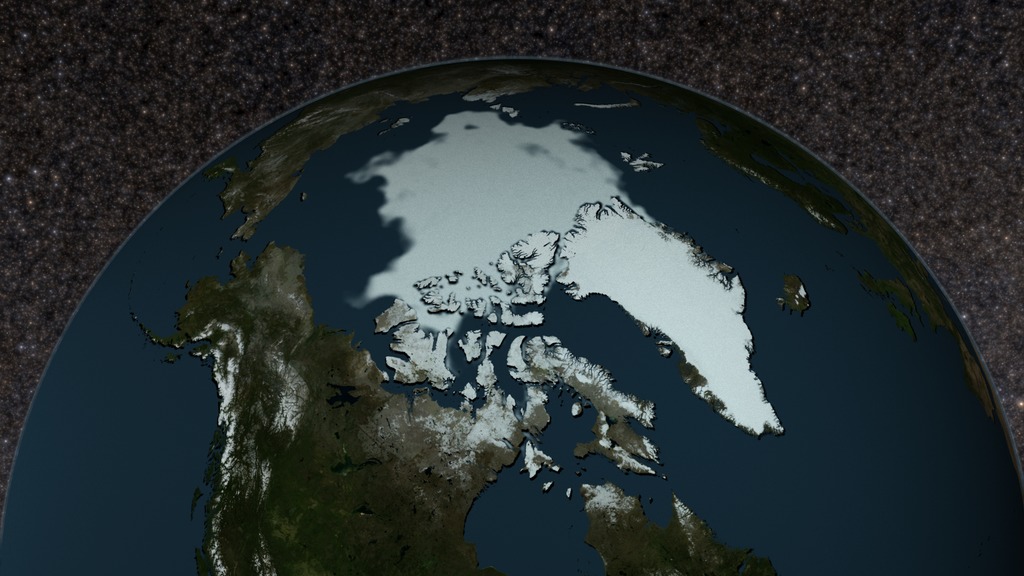
Animation of Arctic sea ice maximum extent, March 6 2023, to its minimum, September 19, 2023
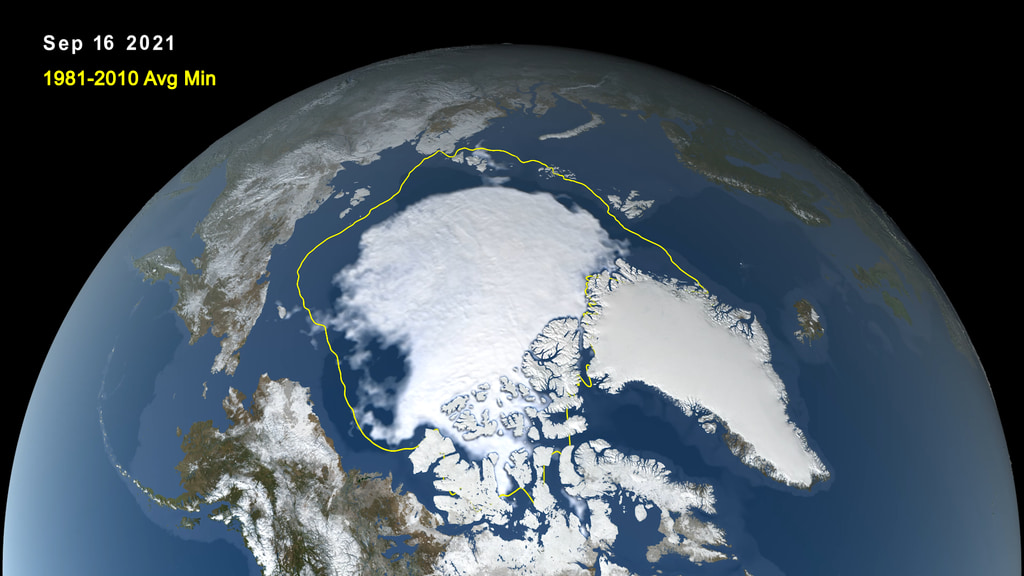
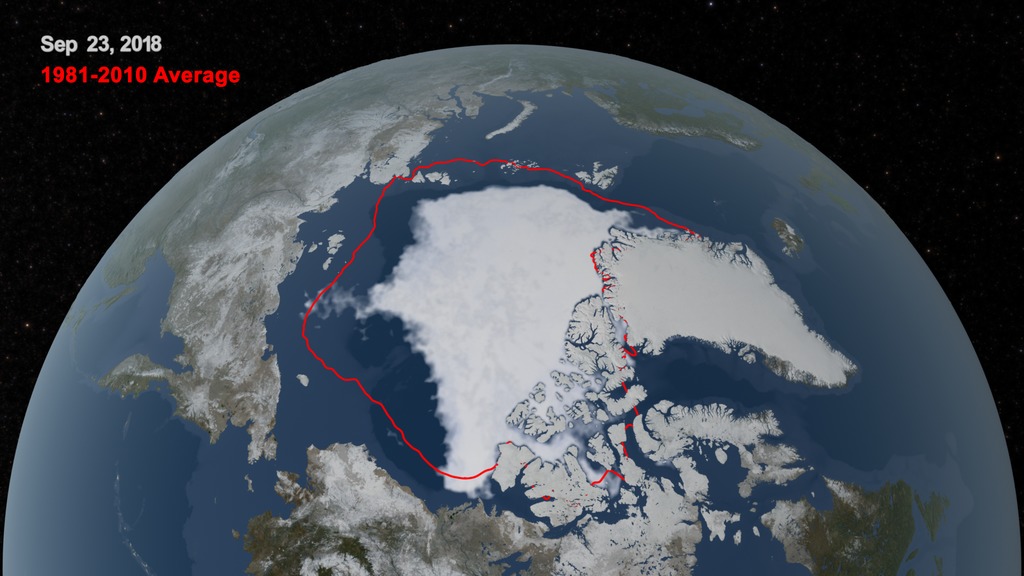
Satellite-based passive microwave images of the sea ice have provided a reliable tool for continuously monitoring changes in the Arctic ice since 1979. Every summer the Arctic ice cap melts down to what scientists call its "minimum" before colder weather begins to cause ice cover to increase. An analysis of satellite data by NASA and the National Snow and Ice Data Center (NSIDC) at the University of Colorado Boulder shows that the 2023 minimum extent, which was likely reached on Sept. 19, measured 1.63 million square miles (4.23 million square kilometers). This is the 6th lowest measured sea ice extent for the arctic on record.
The Japan Aerospace Exploration Agency (JAXA) provides many water-related products derived from data acquired by the Advanced Microwave Scanning Radiometer 2 (AMSR2) instrument aboard the Global Change Observation Mission 1st-Water "SHIZUKU" (GCOM-W1) satellite. Two JAXA datasets used in this animation are the 10-km daily sea ice concentration and the 10 km daily 89 GHz Brightness Temperature.
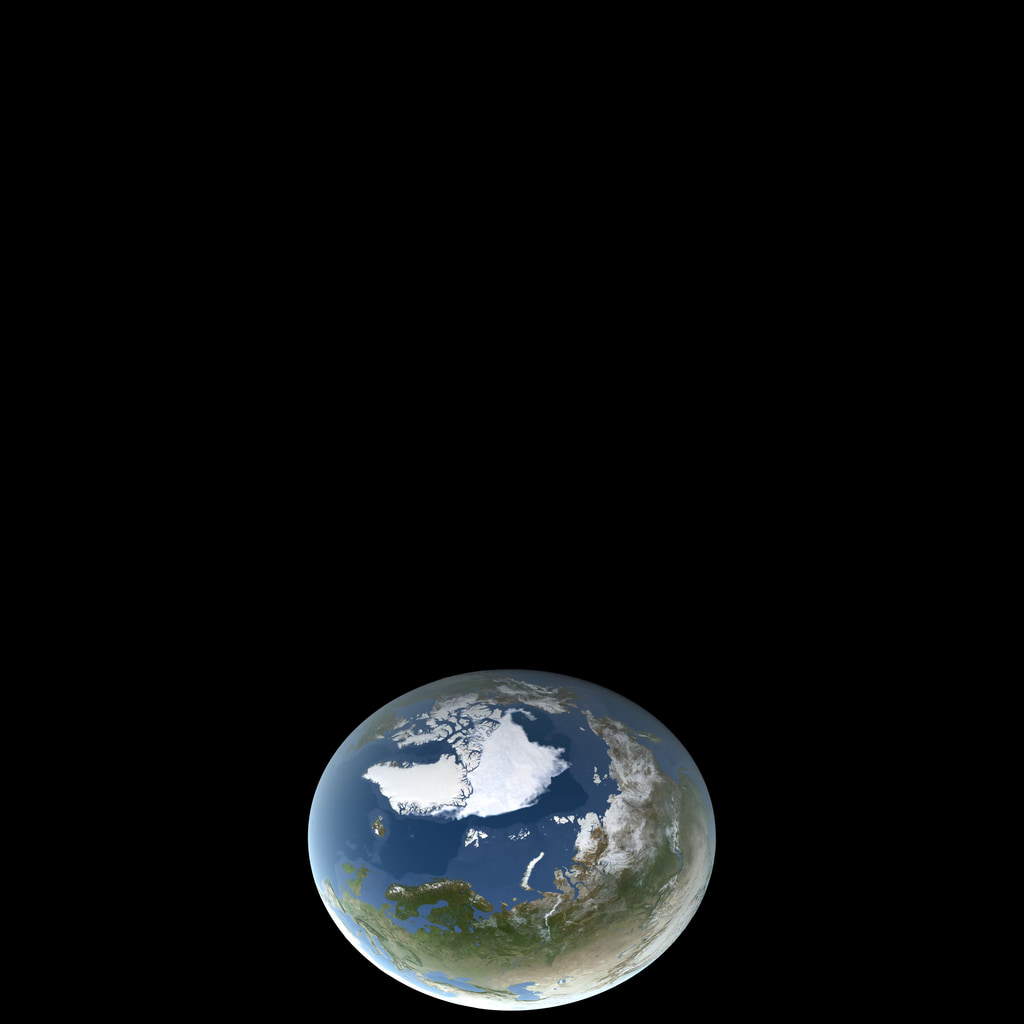
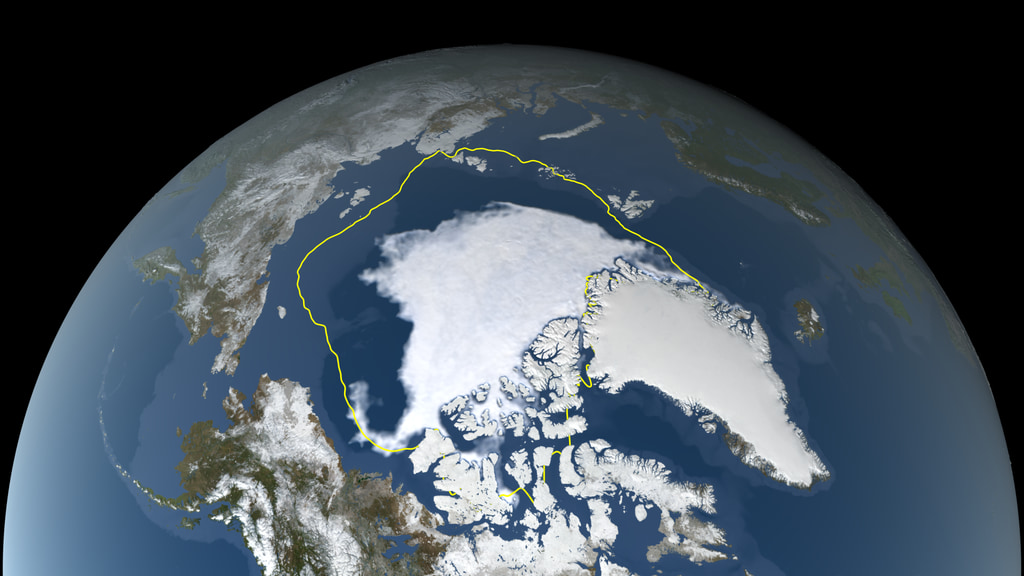
In this animation, the daily Arctic sea ice and seasonal land cover change progress through time, from the yearly maximum ice extent on March 6 2023, through its minimum on September 19 2023. Over the water, Arctic sea ice changes from day to day showing a running 3-day minimum sea ice concentration in the region where the concentration is greater than 15%. The blueish white color of the sea ice is derived from a 3-day running minimum of the AMSR2 89 GHz brightness temperature. The yellow boundary shows the minimum extent averaged over the 30-year period from 1981 to 2010. Over the terrain, monthly data from the seasonal Blue Marble Next Generation fades slowly from month to month.
Animation of Arctic sea ice maximum extent, March 6 2023, to its minimum, September 19, 2023, 1080p
Animation of Arctic sea ice maximum extent, March 6 2023, to its minimum, September 19, 2023, mobile format

Arctic sea ice minimum extent, September 19, 2023
Credits
Please give credit for this item to:
NASA's Scientific Visualization Studio
-
Animators
- Trent L. Schindler (USRA)
- Cindy Starr (Global Science and Technology, Inc.)
-
Producer
- Grace Weikert (KBR Wyle Services, LLC)
-
Scientist
- Walt Meier (NASA/GSFC)
Release date
This page was originally published on Monday, September 25, 2023.
This page was last updated on Sunday, March 10, 2024 at 11:18 PM EDT.
Datasets used in this visualization
-
BMNG (Blue Marble: Next Generation) [Terra and Aqua: MODIS]
ID: 508Credit: The Blue Marble data is courtesy of Reto Stockli (NASA/GSFC).
This dataset can be found at: http://earthobservatory.nasa.gov/Newsroom/BlueMarble/
See all pages that use this dataset -
10 km Daily Sea Ice Concentration [SHIZUKU (GCOM-W1): AMSR2]
ID: 795Credit: AMSR2 data courtesy of the Japan Aerospace Exploration Agency (JAXA).
See all pages that use this dataset -
10 km Daily 89 GHz Brightness Temperature [SHIZUKU (GCOM-W1): AMSR2]
ID: 796Credit: AMSR2 data courtesy of the Japan Aerospace Exploration Agency (JAXA).
See all pages that use this dataset
Note: While we identify the data sets used in these visualizations, we do not store any further details, nor the data sets themselves on our site.
Related
- ID: 4927
 Visualization
 - ID: 13746

- ID: 13300
 Produced Video
Older Versions
- ID: 4941
 Visualization
 - ID: 4860
 Visualization
 - ID: 4757
 Visualization
 - ID: 4684
 Visualization
 - ID: 4592
 Visualization
 - ID: 4562
 Visualization
Used as a Source In
- ID: 14413
 Produced Video