Earth
ID: 5024
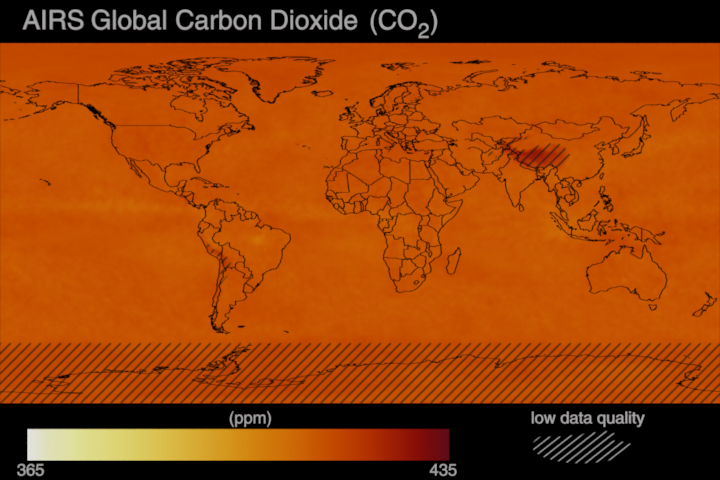
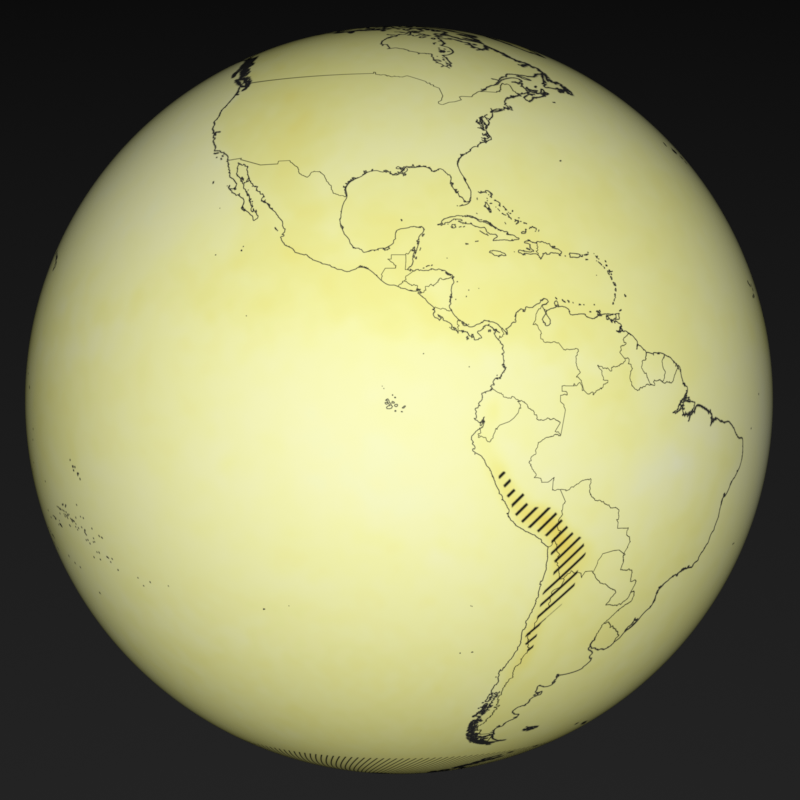
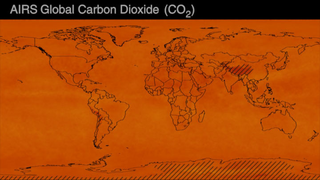
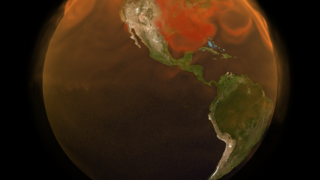
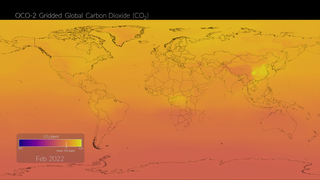
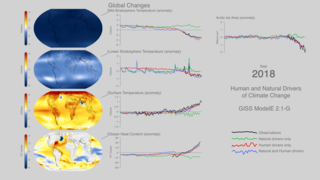
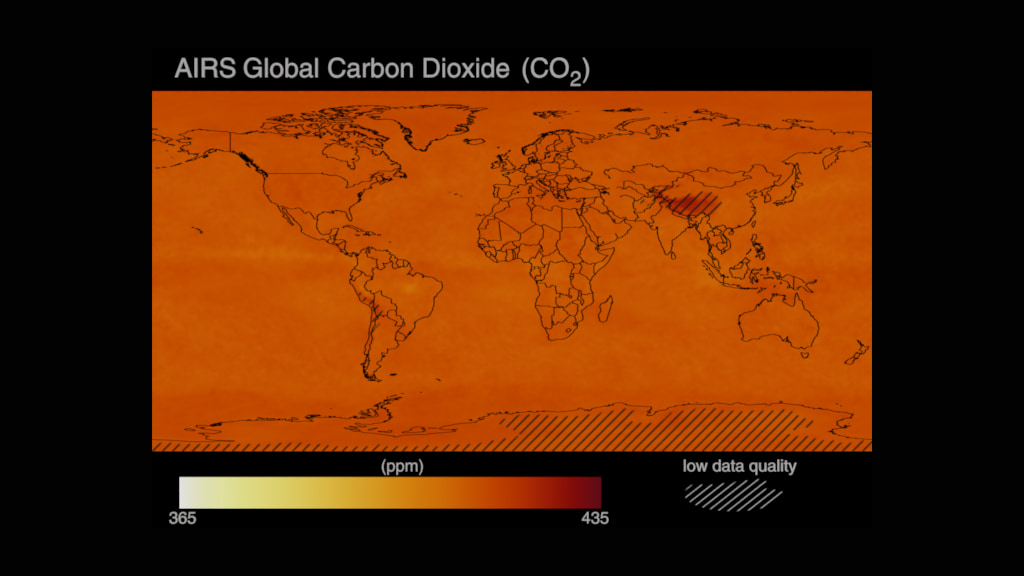
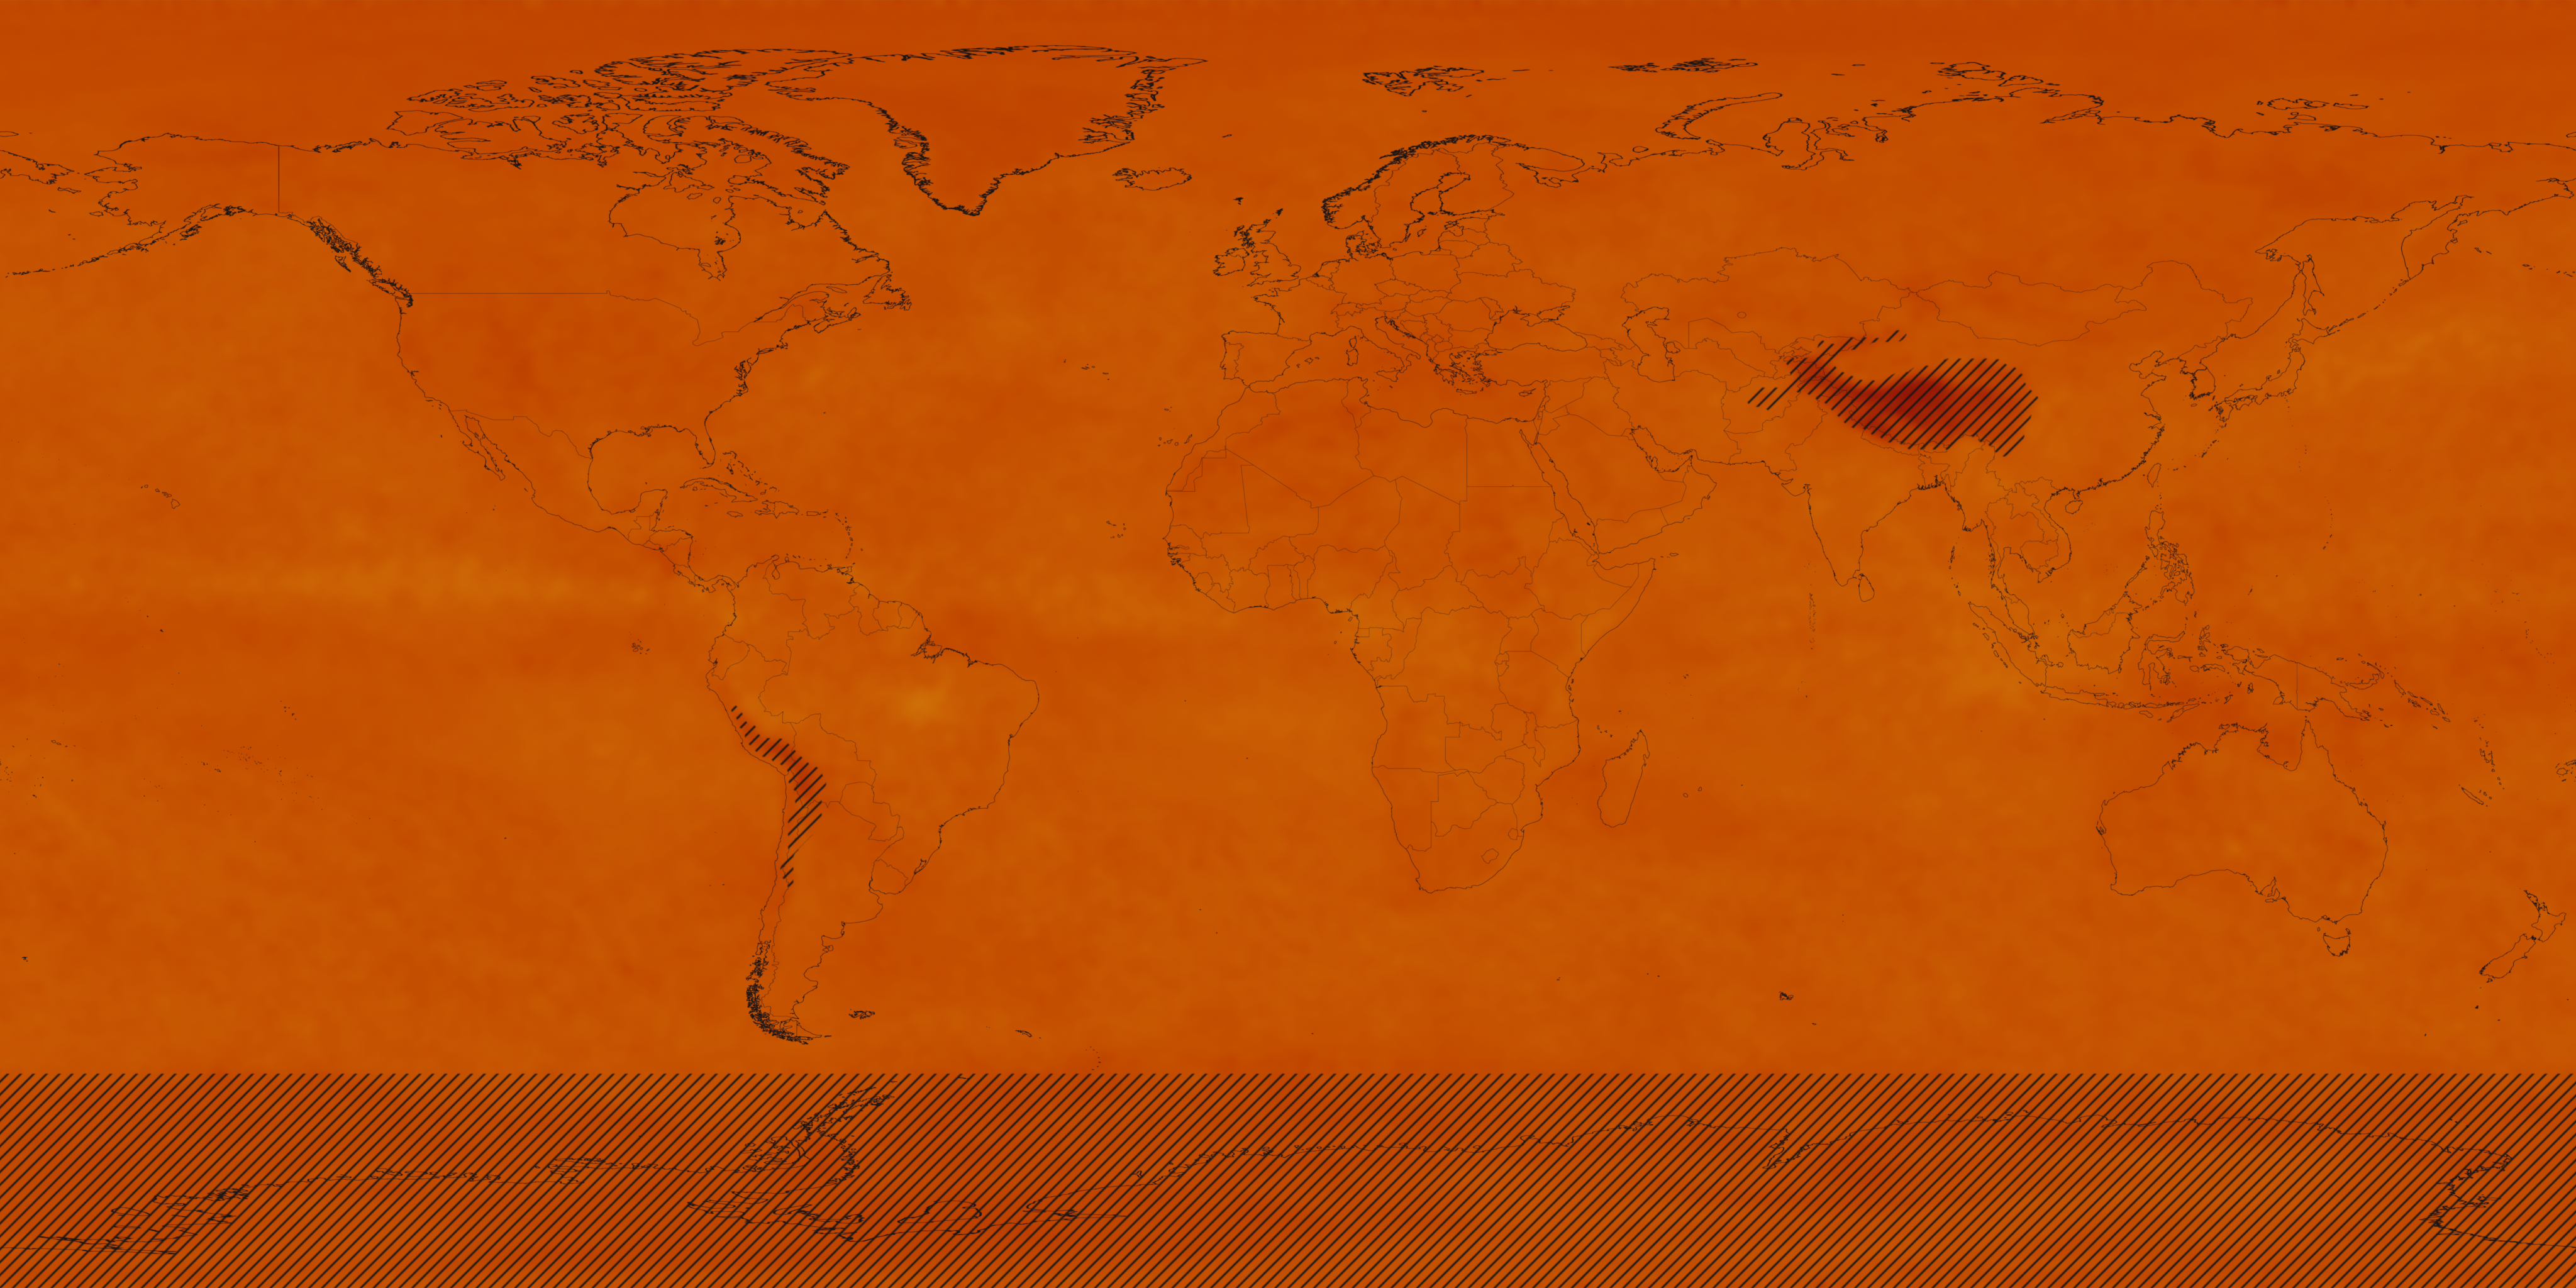
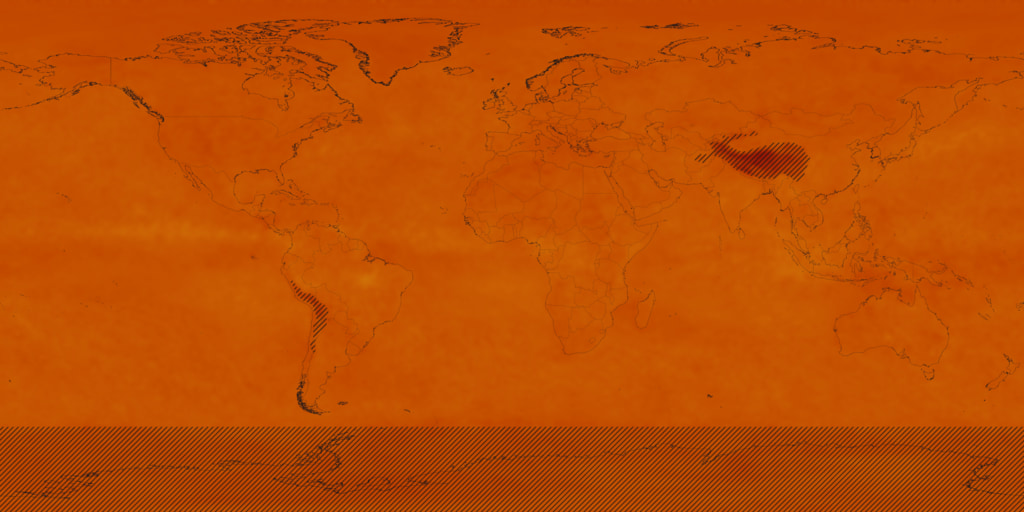
This data visualization shows the global distribution and variation of the concentration of mid-tropospheric carbon dioxide observed by the Atmospheric Infrared Sounder (AIRS) on the NASA Aqua spacecraft over a 20 year timespan. One obvious feature that we see in the data is a continual increase in carbon dioxide with time, as seen in the shift in the color of the map from light yellow towards red as time progresses. Another feature is the seasonal variation of carbon dioxide in the northern hemisphere, which is governed by the growth cycle of plants. This can be seen as a pulsing in the colors, with a shift towards lighter colors starting in April/May each year and a shift towards red as the end of each growing season passes into winter. The seasonal cycle is more pronounced in the northern hemisphere than the southern hemisphere, since the majority of the land mass is in the north.
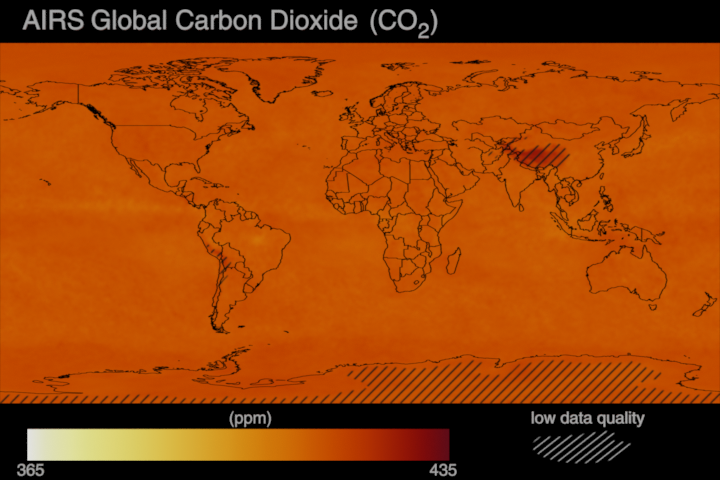
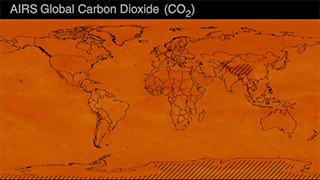
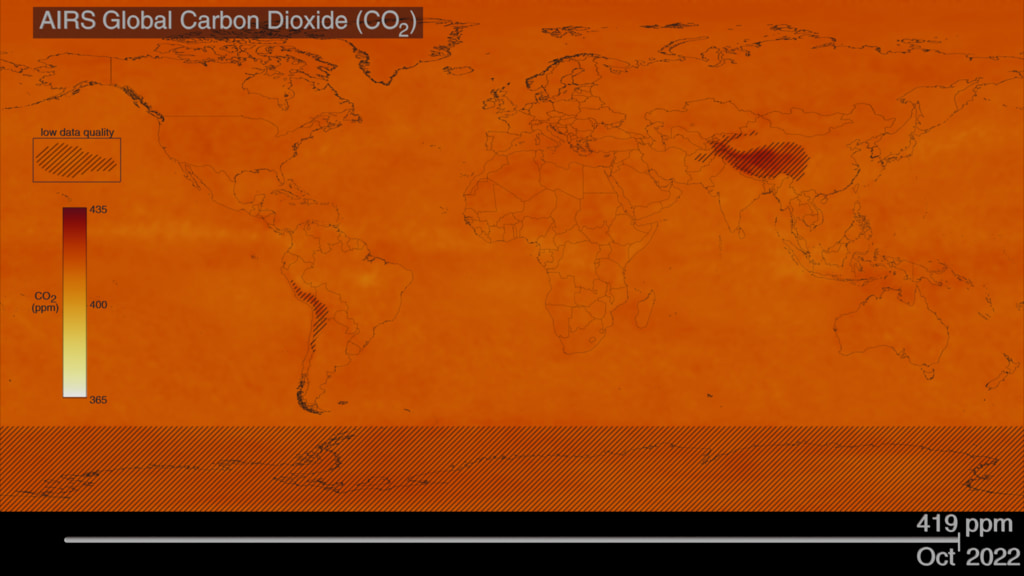
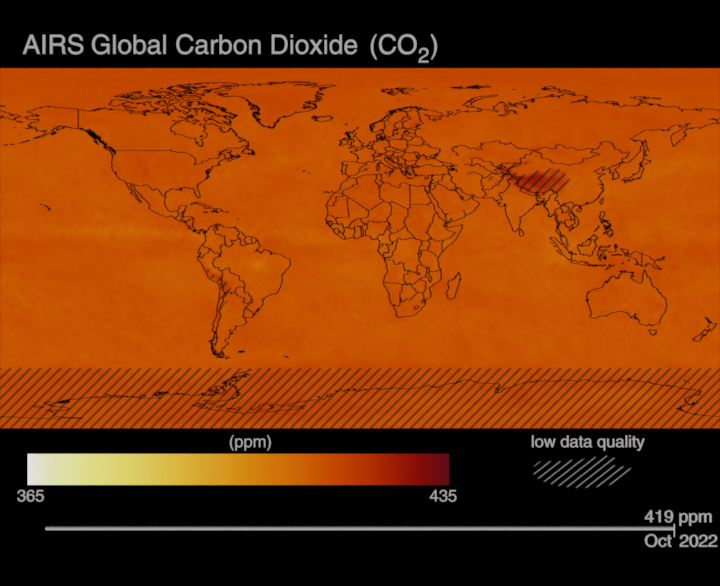
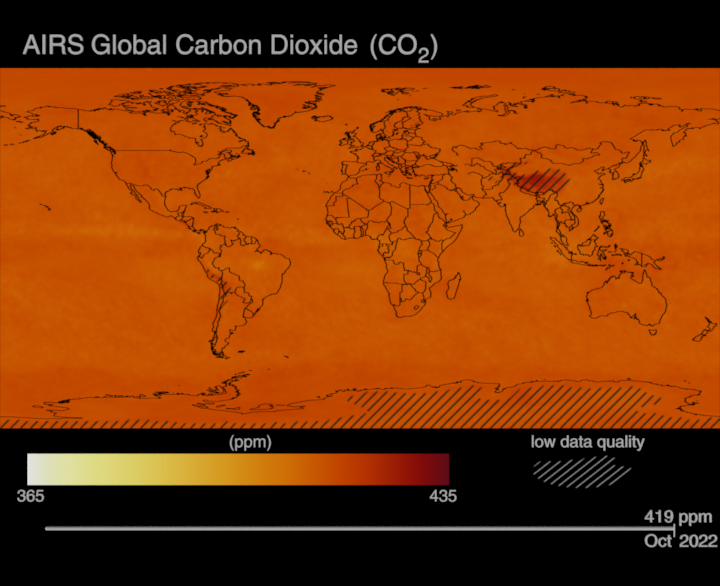
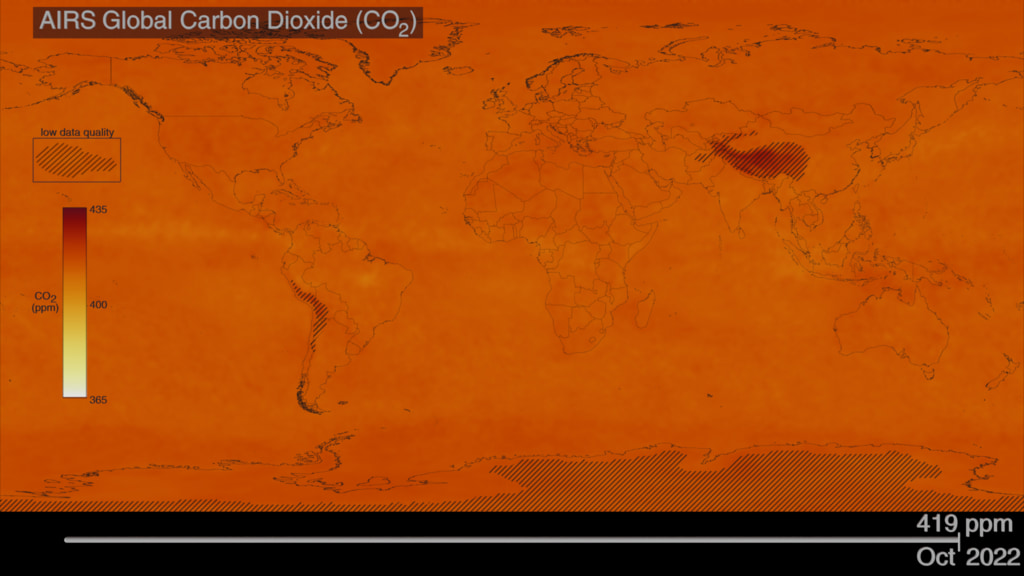
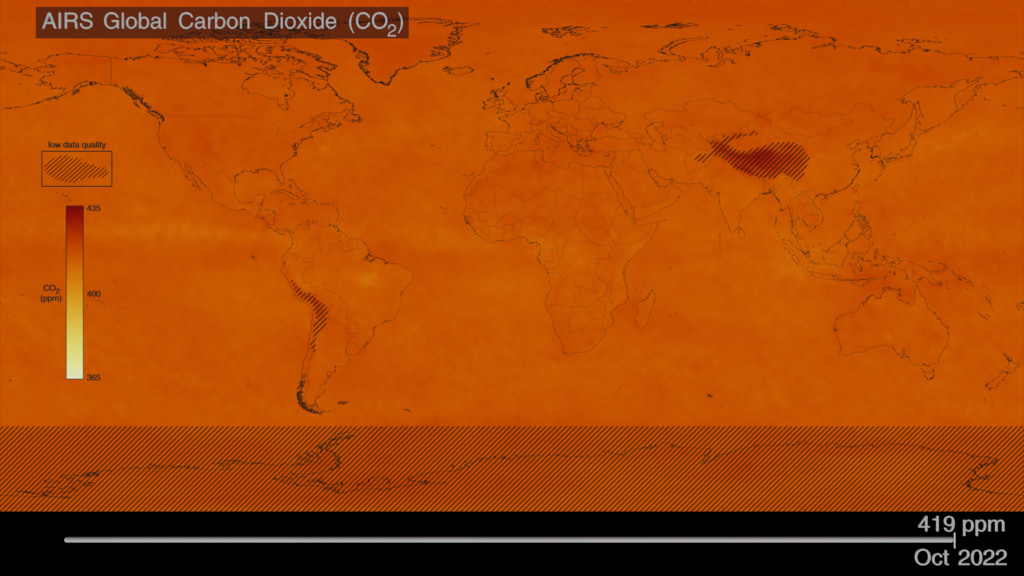
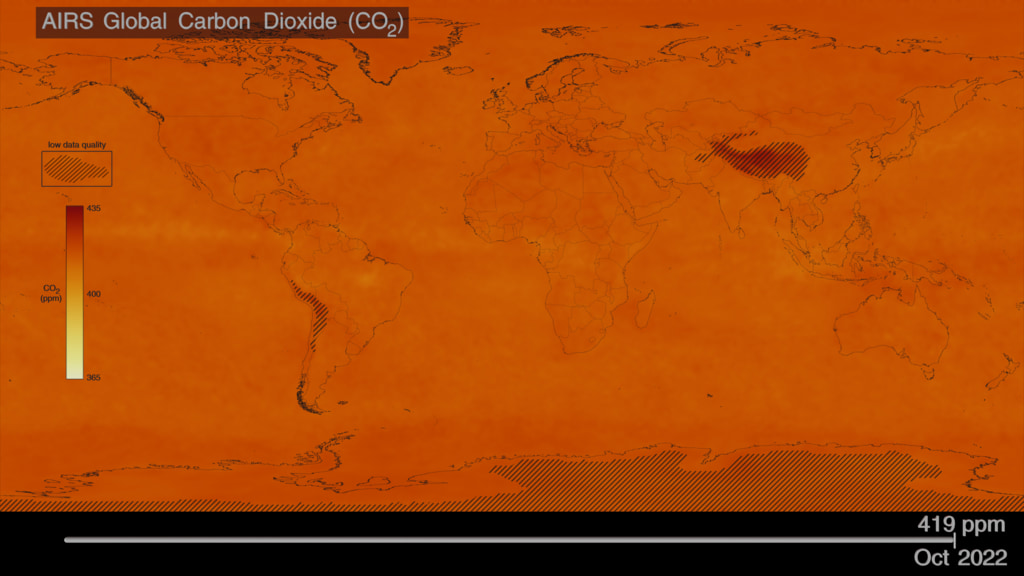
The visualization includes a data-driven spatial map of global carbon dioxide and a timeline on the bottom. The timeline showcases the monthly timestep and is paired with the adjusted carbon dioxide value. Areas where the air pressure is less than 750mB (areas of high-altitude) have been marked in the visualization as low data quality (striped) areas. This entry offers two versions of low data quality (stiped) areas. One version includes striped regions as they are calculated on data values and the second version features striped regions below 60 South.
Data Sources:
The rest of this webpage offers custom versions for web, HD and 4K display systems.
climate.nasa.gov
This section contains assets designed for climate.nasa.gov
HD content
Additional visualization content in HD resolution.
4K content
Science On a Sphere (SOS) content
The following section contains assets designed for Science On a Sphere and related displays.
SOS playlist file: playlist.sos
SOS label file: labels.txt
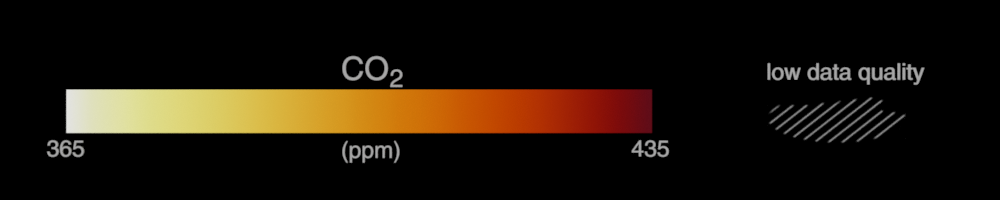
Colormap
The following section contains colormap information.

20 years of AIRS Global Carbon Dioxide (CO₂) measurements (2002-October 2022)
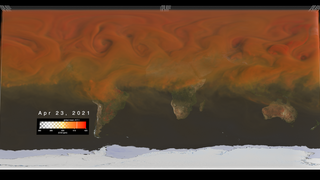
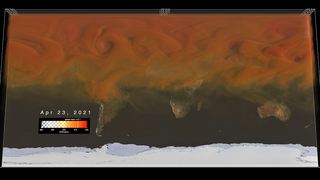
The visualization includes a data-driven spatial map of global carbon dioxide and a timeline on the bottom. The timeline showcases the monthly timestep and is paired with the adjusted carbon dioxide value. Areas where the air pressure is less than 750mB (areas of high-altitude) have been marked in the visualization as low data quality (striped) areas. This entry offers two versions of low data quality (stiped) areas. One version includes striped regions as they are calculated on data values and the second version features striped regions below 60 South.
Data Sources:
- Carbon Dioxide (CO2) from the Sounder SIPS: AQUA AIRS IR-only Level 3 CLIMCAPS: Comprehensive Quality Control Gridded Monthly V2 (SNDRAQIL3CMCCP), which is a monthly product of global coverage and of spatial resolution 1x1 degrees.
The visualizations included on this page, utilize the variable co2_vmr_uppertop from the CLIMCAPS product. Areas where the air pressure is less than 750mB (areas of high-altitude) and below 60 degrees South have been marked in the visualization as low data quality (striped areas). In addition, areas with data gaps and of high altitude less than 5% of the resolution of the product have been filled using the nearest neighbor algorithm.
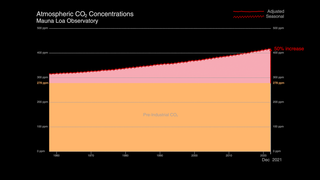
Citation: Chris Barnet (2019), Sounder SIPS: AQUA AIRS IR-only Level 3 CLIMCAPS: Comprehensive Quality Control Gridded Monthly V2, Greenbelt, MD, USA, Goddard Earth Sciences Data and Information Services Center (GES DISC), Accessed: [January 30, 2023], doi: 10.5067/ZPZ430KOPMIX - Trends in Atmospheric Carbon Dioxide by NOAA. The visualizations on this page feature de-seasonalized mean value measurements from the Mauna Loa CO2 monthly mean data for the period September 2002-October 2022, Accessed: [January 30, 2023].
Citation: Dr. Pieter Tans, NOAA/GML (gml.noaa.gov/ccgg/trends/) and Dr. Ralph Keeling, Scripps Institution of Oceanography (scrippsco2.ucsd.edu).
Citation: Keeling, Ralph F; Keeling, Charles D. (2017). Atmospheric Monthly In Situ CO2 Data - Mauna Loa Observatory, Hawaii (Archive 2021-09-07). In Scripps CO2 Program Data. UC San Diego Library Digital Collections. https://doi.org/10.6075/J08W3BHW - Continental and country outlines from the Scientific Visualization Studio, NASA/GSFC.
The rest of this webpage offers custom versions for web, HD and 4K display systems.
climate.nasa.gov
This section contains assets designed for climate.nasa.gov
HD content
Additional visualization content in HD resolution.
4K content
Science On a Sphere (SOS) content
The following section contains assets designed for Science On a Sphere and related displays.
SOS playlist file: playlist.sos
SOS label file: labels.txt
Colormap
The following section contains colormap information.
Older Versions
Related
Visualization Credits
Helen-Nicole Kostis (USRA): Lead Visualizer
Vivienne H. Payne (Jet Propulsion Laboratory (JPL)): Lead Scientist
Sharon Ray (NASA/JPL CalTech): Outreach Lead
Daniel Bailey (NASA/Jet Propulsion Laboratory (JPL)): Science Editor
Holly Shaftel (NASA/Jet Propulsion Laboratory (JPL)): Outreach Coordinator
Laurence Schuler (ADNET Systems, Inc.): Technical Support
Ian Jones (ADNET Systems, Inc.): Technical Support
Eric Sokolowsky (Global Science and Technology, Inc.): Technical Support
Please give credit for this item to:
NASA's Scientific Visualization Studio
NASA's Scientific Visualization Studio
Short URL to share this page:
https://svs.gsfc.nasa.gov/5024
Mission:
Aqua
Data Used:
Note: While we identify the data sets used in these visualizations, we do not store any further details nor the data sets themselves on our site.
Keywords:
DLESE >> Atmospheric science
SVS >> CO2
SVS >> Carbon Dioxide
SVS >> Climate
DLESE >> Environmental science
GCMD >> Earth Science >> Atmosphere >> Atmospheric Chemistry/Carbon and Hydrocarbon Compounds >> Carbon Dioxide
SVS >> Hyperwall
SVS >> Science On a Sphere
SVS >> Climate Change
SVS >> Atmospheric Science
SVS >> AIRS
SVS >> Aqua
NASA Science >> Earth
SVS >> 4K
NASA Earth Science Focus Areas >> Atmospheric Composition
NASA Earth Science Focus Areas >> Climate Variability and Change
NASA Earth Science Focus Areas >> Carbon Cycle and Ecosystems
GCMD keywords can be found on the Internet with the following citation: Olsen, L.M., G. Major, K. Shein, J. Scialdone, S. Ritz, T. Stevens, M. Morahan, A. Aleman, R. Vogel, S. Leicester, H. Weir, M. Meaux, S. Grebas, C.Solomon, M. Holland, T. Northcutt, R. A. Restrepo, R. Bilodeau, 2013. NASA/Global Change Master Directory (GCMD) Earth Science Keywords. Version 8.0.0.0.0
https://svs.gsfc.nasa.gov/5024
Mission:
Aqua
Data Used:
Mauna Loa CO2 monthly mean data also referred to as: Trends in Atmospheric Carbon Dioxide
Observed Data - NOAA and Scripps
Credit:
Dr. Pieter Tans, NOAA/GML (gml.noaa.gov/ccgg/trends/) and Dr. Ralph Keeling, Scripps Institution of Oceanography (scrippsco2.ucsd.edu/).
Dr. Pieter Tans, NOAA/GML (gml.noaa.gov/ccgg/trends/) and Dr. Ralph Keeling, Scripps Institution of Oceanography (scrippsco2.ucsd.edu/).
NASA AQUA/AIRS (Atmospheric Infrared Sounder)/Sounder SIPS: AQUA AIRS IR-only Level 3 CLIMCAPS: Comprehensive Quality Control Gridded Monthly V2 also referred to as: SNDRAQIL3CMCCP
Observed Data - AIRS, NASAKeywords:
DLESE >> Atmospheric science
SVS >> CO2
SVS >> Carbon Dioxide
SVS >> Climate
DLESE >> Environmental science
GCMD >> Earth Science >> Atmosphere >> Atmospheric Chemistry/Carbon and Hydrocarbon Compounds >> Carbon Dioxide
SVS >> Hyperwall
SVS >> Science On a Sphere
SVS >> Climate Change
SVS >> Atmospheric Science
SVS >> AIRS
SVS >> Aqua
NASA Science >> Earth
SVS >> 4K
NASA Earth Science Focus Areas >> Atmospheric Composition
NASA Earth Science Focus Areas >> Climate Variability and Change
NASA Earth Science Focus Areas >> Carbon Cycle and Ecosystems
GCMD keywords can be found on the Internet with the following citation: Olsen, L.M., G. Major, K. Shein, J. Scialdone, S. Ritz, T. Stevens, M. Morahan, A. Aleman, R. Vogel, S. Leicester, H. Weir, M. Meaux, S. Grebas, C.Solomon, M. Holland, T. Northcutt, R. A. Restrepo, R. Bilodeau, 2013. NASA/Global Change Master Directory (GCMD) Earth Science Keywords. Version 8.0.0.0.0


