National Carbon Dioxide (CO₂) budgets inferred from atmospheric observations
National yearly carbon dioxide (CO₂) budgets for over 100 countries around the world for the period 2015-2020.
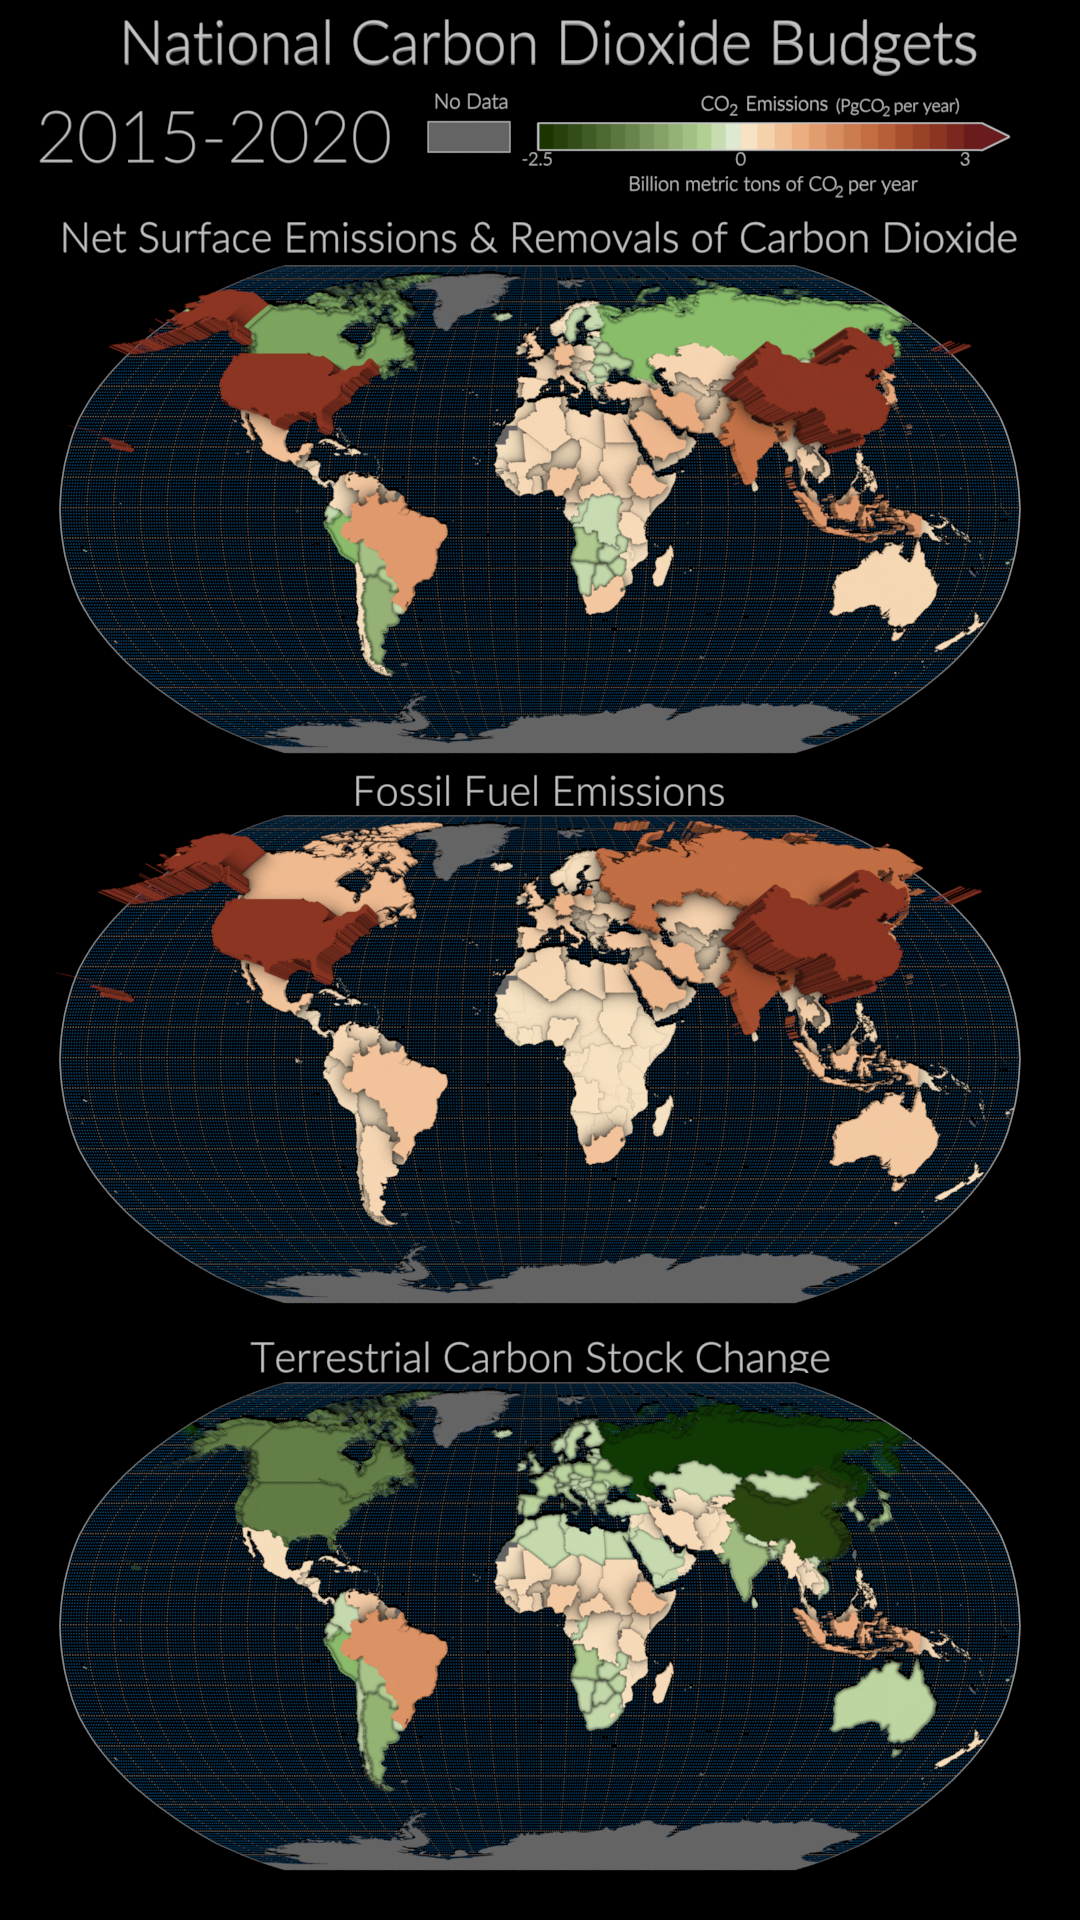
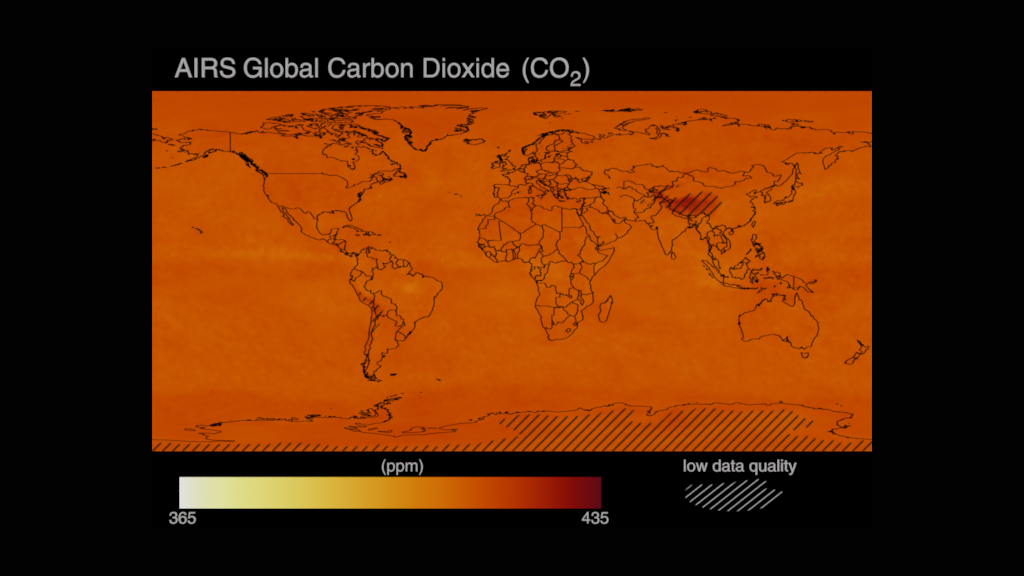
This data visualization shows the emissions (sources) and removals (sinks) of carbon dioxide (CO₂) for more than 100 countries around the world. These estimates are informed by observations of atmospheric CO₂ observed by a network of ground-based sites and NASA’s Orbiting Carbon Observatory 2 (OCO-2), which has mapped CO₂ around the globe since 2014.
The net emissions and removals are the combined impact of fossil fuel emissions and land carbon stock changes. These terrestrial carbon stock changes indicate changes in the amount of carbon stored in organic matter on land, which is impacted by land use and land use change, including emissions from deforestation and removals from improved land stewardship and reforestation.
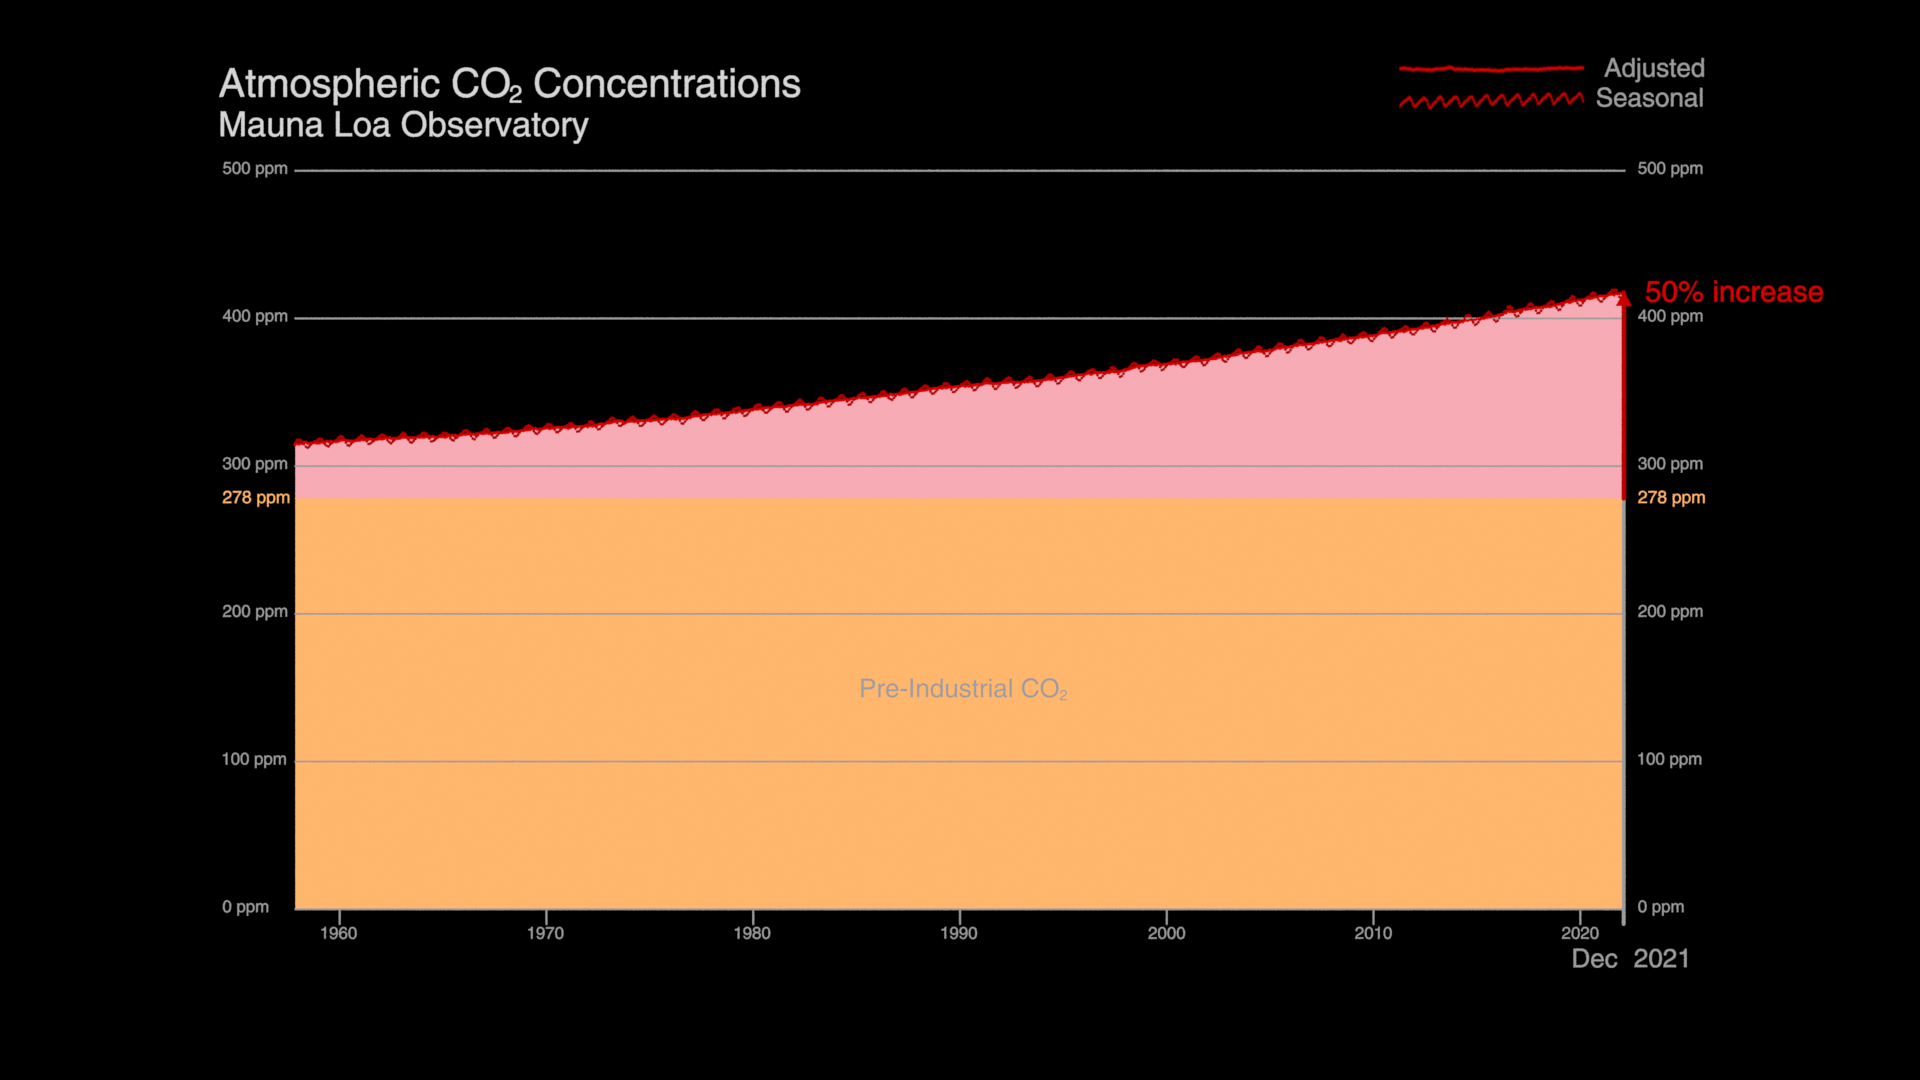
The visualization shows that fossil fuel emissions drive net emissions of CO₂ to the atmosphere, which are in turn driving climate change. Terrestrial carbon stock changes are smaller than the fossil fuel emissions and regionally varying. In general, terrestrial carbon stocks are increasing across the northern extratropics but are more variable in the tropics, where deforestation is more extensive.

Mean fossil fuel emissions for over 100 countries around the world for the period 2015-2020. This version is provided with white background and black text.
Mean fossil fuel emissions for over 100 countries around the world for the period 2015-2020. This version is provided with white background and black text.
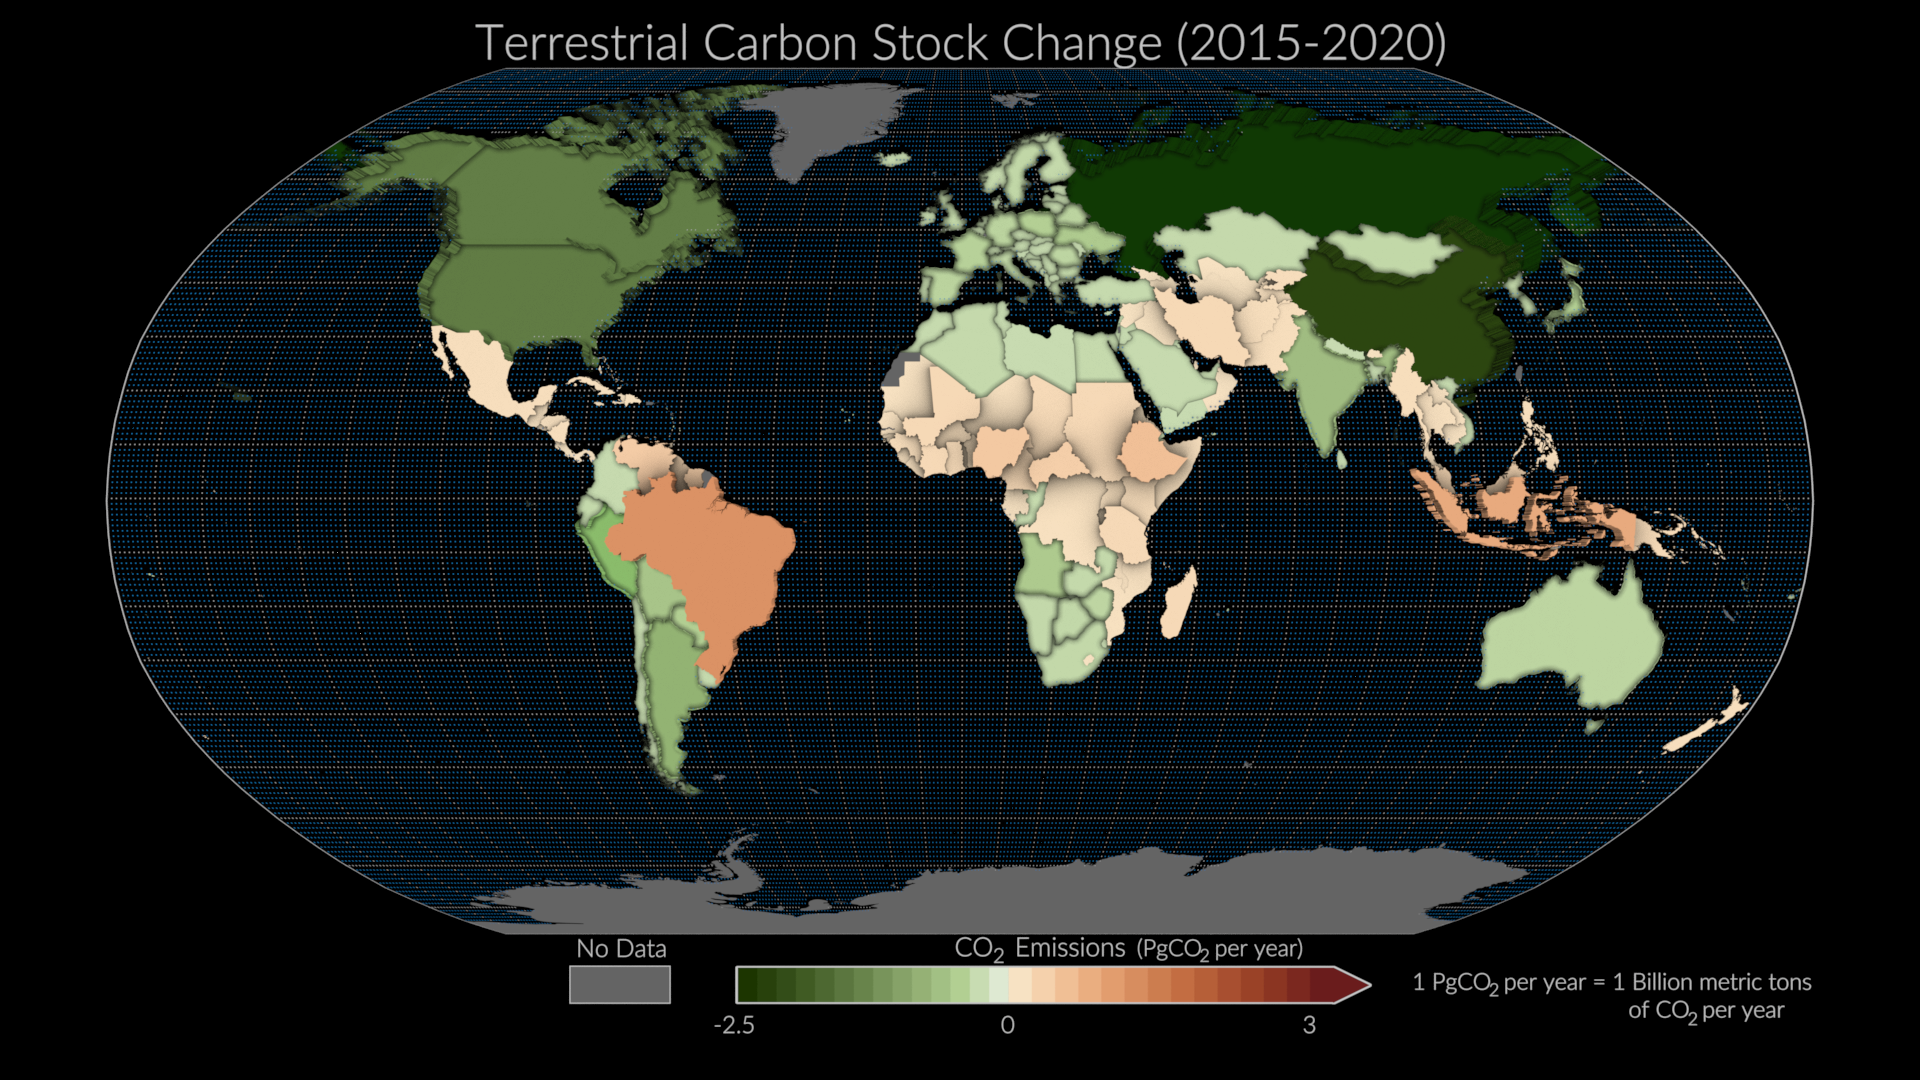
Mean terrestrial carbon stock change for over 100 countries around the world for the period 2015-2020. This version is provided with white background and black text.
National mean carbon dioxide budgets for over 100 countries around the world for the period 2015-2020.
This visualization shows yearly net surface emissions and removals by more than 100 countries from 2015 to 2020. . Countries with emissions, seen here in red, appear to pop from the page, compared to countries with removals, seen in green.
This data visualization shows yearly fossil fuel emissions by more than 100 countries from 2015 to 2020. Countries with high emissions, including the U.S. and China, seen here in dark red, appearing to pop from the page, compared to others with lower emissions.
This data visualization illustrates changes in the amount of carbon stored in organic matter on land, called terrestrial carbon stock changes, from 2015 to 2020. Activities such as improved land stewardship and deforestation, which is more extensive in the tropics than other regions, affect these stock changes.
Mean net surface emissions and removals of carbon dioxide (CO₂) for over 100 countries around the world for the period 2015-2020.
Este mapa muestra el promedio de emisiones y eliminaciones netas de dióxido de carbono entre 2015 y 2020 utilizando estimaciones informadas por las mediciones del satélite OCO-2 de la NASA. Los países en los que se eliminó más dióxido de carbono del emitido aparecen como depresiones verdes, mientras que los países con mayores emisiones son de color marrón o rojo y parecen sobresalir de la página.
Crédito: Estudio de Visualización Científica de la NASA
Mean fossil fuel emissions for over 100 countries around the world for the period 2015-2020.
Mean terrestrial carbon stock change for over 100 countries around the world for the period 2015-2020.
National yearly carbon dioxide (CO₂) budgets for over 100 countries around the world for the period 2015-2020. This version has a dark ocean.
National mean carbon dioxide budgets for over 100 countries around the world for the period 2015-2020. This version has a dark ocean.
Yearly net surface emissions and removals of carbon dioxide for over 100 countries around the world for the period 2015-2020. This version has a dark ocean.
Mean net surface emissions and removals of carbon dioxide (CO₂) for over 100 countries around the world for the period 2015-2020. This version has a dark ocean.
This data visualization shows yearly fossil fuel emissions by more than 100 countries from 2015 to 2020. Countries with high emissions, including the U.S. and China, seen here in dark red, appearing to pop from the page, compared to others with lower emissions. This version has a dark ocean.

Mean fossil fuel emissions for over 100 countries around the world for the period 2015-2020. This version has a dark ocean.
This data visualization illustrates changes in the amount of carbon stored in organic matter on land, called terrestrial carbon stock changes, from 2015 to 2020. Activities such as improved land stewardship and deforestation, which is more extensive in the tropics than other regions, affect these stock changes. This version has a dark ocean.
Mean terrestrial carbon stock change for over 100 countries around the world for the period 2015-2020. This version has a dark ocean.
Credits
Please give credit for this item to:
NASA's Scientific Visualization Studio
-
Visualizers
- Helen-Nicole Kostis (USRA)
- Greg Shirah (NASA/GSFC)
-
Scientist
- Brendan Byrne (NASA/JPL)
-
Technical support
- Laurence Schuler (ADNET Systems, Inc.)
- Ian Jones (ADNET Systems, Inc.)
- Eric Sokolowsky (Global Science and Technology, Inc.)
Release date
This page was originally published on Tuesday, March 7, 2023.
This page was last updated on Wednesday, February 21, 2024 at 11:23 AM EST.
Papers used in this visualization
Byrne, B., Baker, D. F., Basu, S., Bertolacci, M., Bowman, K. W., Carroll, D., Chatterjee, A., Chevallier, F., Ciais, P., Cressie, N., Crisp, D., Crowell, S., Deng, F., Deng, Z., Deutscher, N. M., Dubey, M., Feng, S., García, O., Griffith, D. W. T., Herkommer, B., Hu, L., Jacobson, A. R., Janardanan, R., Jeong, S., Johnson, M. S., Jones, D. B. A., Kivi, R., Liu, J., Liu, Z., Maksyutov, S., Miller, J. B., Miller, S. M., Morino, I., Notholt, J., Oda, T., O’Dell, C. W., Oh, Y.-S., Ohyama, H., Patra, P. K., Peiro, H., Petri, C., Philip, S., Pollard, D. F., Poulter, B., Remaud, M., Schuh, A., Sha, M. K., Shiomi, K., Strong, K., Sweeney, C., Té, Y., Tian, H., Velazco, V. A., Vrekoussis, M., Warneke, T., Worden, J. R., Wunch, D., Yao, Y., Yun, J., Zammit-Mangion, A., and Zeng, N.: National CO2 budgets (2015–2020) inferred from atmospheric CO2 observations in support of the Global Stocktake, Earth Syst. Sci. Data, ttps://doi.org/10.5194/essd-15-963-2023
Byrne, B., Baker, D. F., Basu, S., Bertolacci, M., Bowman, K. W., Carroll, D., Chatterjee, A., Chevallier, F., Ciais, P., Cressie, N., Crisp, D., Crowell, S., Deng, F., Deng, Z., Deutscher, N. M., Dubey, M., Feng, S., García, O., Griffith, D. W. T., Herkommer, B., Hu, L., Jacobson, A. R., Janardanan, R., Jeong, S., Johnson, M. S., Jones, D. B. A., Kivi, R., Liu, J., Liu, Z., Maksyutov, S., Miller, J. B., Miller, S. M., Morino, I., Notholt, J., Oda, T., O’Dell, C. W., Oh, Y.-S., Ohyama, H., Patra, P. K., Peiro, H., Petri, C., Philip, S., Pollard, D. F., Poulter, B., Remaud, M., Schuh, A., Sha, M. K., Shiomi, K., Strong, K., Sweeney, C., Té, Y., Tian, H., Velazco, V. A., Vrekoussis, M., Warneke, T., Worden, J. R., Wunch, D., Yao, Y., Yun, J., Zammit-Mangion, A., and Zeng, N.: National CO2 budgets (2015–2020) inferred from atmospheric CO2 observations in support of the Global Stocktake, Earth Syst. Sci. Data, ttps://doi.org/10.5194/essd-15-963-2023
Datasets used in this visualization
-
Pilot top-down CO2 Budget constrained by the v10 OCO-2 MIP Version 1
ID: 1175Credit: Pilot top-down CO2 Budget constrained by the v10 OCO-2 MIP Version 1 Byrne, B., Baker, D. F., Basu, S., Bertolacci, M., Bowman, K. W., Carroll, D., Chatterjee, A., Chevallier, F., Ciais, P., Cressie, N., Crisp, D., Crowell, S., Deng, F., Deng, Z., Deutscher, N. M., Dubey, M. K., Feng, S., García, O. E., Herkommer, B., Hu, L., Jacobson, A. R., Janardanan, R., Jeong, S., Johnson, M. S., Jones, D. B. A., Kivi, R., Liu, J., Liu, Z., Maksyutov, S., Miller, J. B., Miller, S. M., Morino, I., Notholt, J., Oda, T., O’Dell, C. W., Oh, Y.-S., Ohyama, H., Patra, P. K., Peiro, H., Petri, C., Philip, S., Pollard, D. F., Poulter, B., Remaud, M., Schuh, A., Sha, M. K., Shiomi, K., Strong, K., Sweeney, C., Té, Y., Tian, H., Velazco, V. A., Vrekoussis, M., Warneke, T., Worden, J. R., Wunch, D., Yao, Y., Yun, J., Zammit-Mangion, A., and Zeng, N. https://doi.org/10.48588/npf6-sw92
This dataset can be found at: https://doi.org/10.48588/npf6-sw92
See all pages that use this dataset
Note: While we identify the data sets used in these visualizations, we do not store any further details, nor the data sets themselves on our site.
Related
- ID: 5115
 Visualization
 - ID: 5022
 Visualization
 - ID: 5024
- ID: 4983
 Visualization
 - ID: 4962
- ID: 4949
 Visualization