Earth
ID: 4746
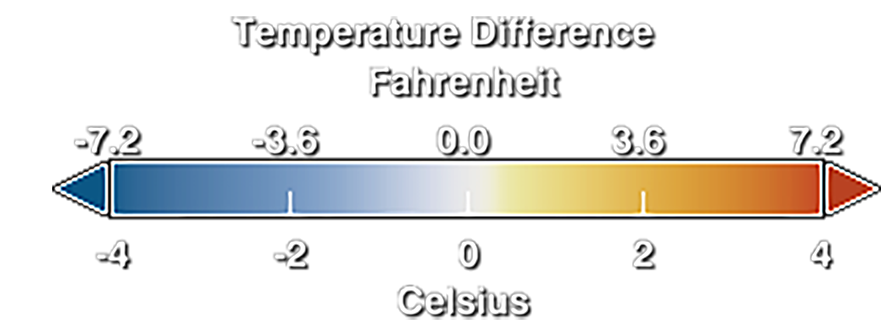
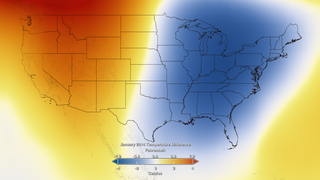
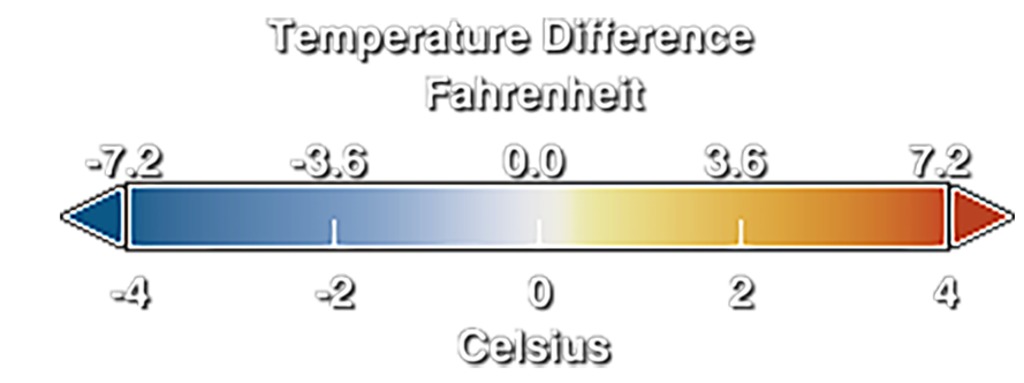
While many people in the continuous United States saw average temperatures in the month of June 2019, the average global temperature in June was 1.71 degrees F above the 20th-century average of 59.9 degrees. This makes June 2019 the hottest June in the 140-year record. Nine of the 10 hottest Junes have occurred since 2010. Last month also was the 43rd consecutive June and 414th consecutive month with above-average global temperatures. This visual of the GISTEMP anomalies for June of 2019 show the United States and then zooms out to show the global picture. Temperature anomalies indicate how much warmer (red) or colder(blue) it is than normal for a particular place and time. For the GISS analysis, normal always means the average over the 30-year period 1951-1980 for that place and time of year. For more information on the GISTEMP, see the GISTEMP analysis website located at: http://data.giss.nasa.gov/gistemp/
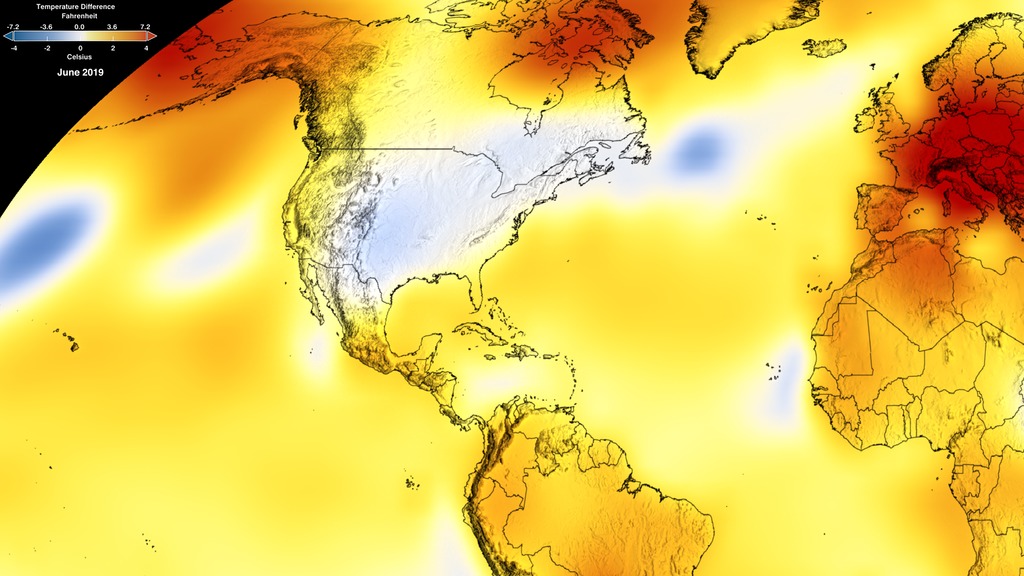
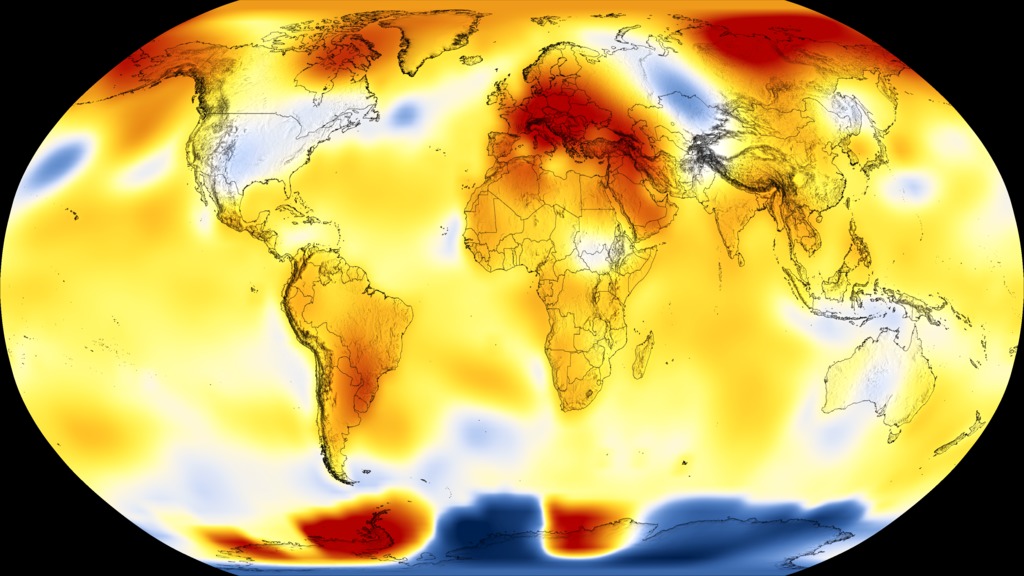

June 2019 Monthly Global Temperature Anomalies
Related
Visualization Credits
Lori Perkins (NASA/GSFC): Lead Animator
Gavin A. Schmidt (NASA/GSFC GISS): Scientist
Robert B Schmunk Ph.D. (SIGMA Space Partners, LLC.): Scientist
Reto A. Ruedy Ph.D. (SIGMA Space Partners, LLC.): Scientist
Kwok-Wai Ken Lo Ph.D. (SIGMA Space Partners, LLC.): Scientist
Makiko Sato Ph.D. (Columbia University, Center for Climate Systems Research): Scientist
Robert B Schmunk Ph.D. (SIGMA Space Partners, LLC.): Project Support
Patrick Lynch (Wyle Information Systems): Writer
Please give credit for this item to:
NASA/Goddard Space Flight Center Scientific Visualization Studio
Data provided by Robert B. Schmunk (NASA/GSFC GISS)
NASA/Goddard Space Flight Center Scientific Visualization Studio
Data provided by Robert B. Schmunk (NASA/GSFC GISS)
Short URL to share this page:
https://svs.gsfc.nasa.gov/4746
Data Used:
Note: While we identify the data sets used in these visualizations, we do not store any further details nor the data sets themselves on our site.
This item is part of these series:
Global Temperature Anomalies
Early Spring
Keywords:
SVS >> Climate
SVS >> Global Warming
SVS >> HDTV
DLESE >> Physical oceanography
GCMD >> Earth Science >> Biosphere >> Ecological Dynamics >> Extinction
GCMD >> Earth Science >> Climate Indicators >> Teleconnections >> El Nino Southern Oscillation
GCMD >> Earth Science >> Oceans >> Coastal Processes >> Sea Level Rise
SVS >> Model Data
SVS >> iPod
SVS >> Science On a Sphere
NASA Science >> Earth
NASA Earth Science Focus Areas >> Climate Variability and Change
GCMD keywords can be found on the Internet with the following citation: Olsen, L.M., G. Major, K. Shein, J. Scialdone, S. Ritz, T. Stevens, M. Morahan, A. Aleman, R. Vogel, S. Leicester, H. Weir, M. Meaux, S. Grebas, C.Solomon, M. Holland, T. Northcutt, R. A. Restrepo, R. Bilodeau, 2013. NASA/Global Change Master Directory (GCMD) Earth Science Keywords. Version 8.0.0.0.0
https://svs.gsfc.nasa.gov/4746
Data Used:
GISS Surface Temperature Analysis (GISTEMP)/GISTEMP
Model - NASA/GISSThis item is part of these series:
Global Temperature Anomalies
Early Spring
Keywords:
SVS >> Climate
SVS >> Global Warming
SVS >> HDTV
DLESE >> Physical oceanography
GCMD >> Earth Science >> Biosphere >> Ecological Dynamics >> Extinction
GCMD >> Earth Science >> Climate Indicators >> Teleconnections >> El Nino Southern Oscillation
GCMD >> Earth Science >> Oceans >> Coastal Processes >> Sea Level Rise
SVS >> Model Data
SVS >> iPod
SVS >> Science On a Sphere
NASA Science >> Earth
NASA Earth Science Focus Areas >> Climate Variability and Change
GCMD keywords can be found on the Internet with the following citation: Olsen, L.M., G. Major, K. Shein, J. Scialdone, S. Ritz, T. Stevens, M. Morahan, A. Aleman, R. Vogel, S. Leicester, H. Weir, M. Meaux, S. Grebas, C.Solomon, M. Holland, T. Northcutt, R. A. Restrepo, R. Bilodeau, 2013. NASA/Global Change Master Directory (GCMD) Earth Science Keywords. Version 8.0.0.0.0


