Carbon Emissions from Fires: 2003 - 2018
This visualization shows carbon emissions from fires from January 1, 2003 through December 31, 2018. The colorbar reflects the quantity of carbon emitted.
This visualization is identical to the one above, without the overlay of the date and colorbar.
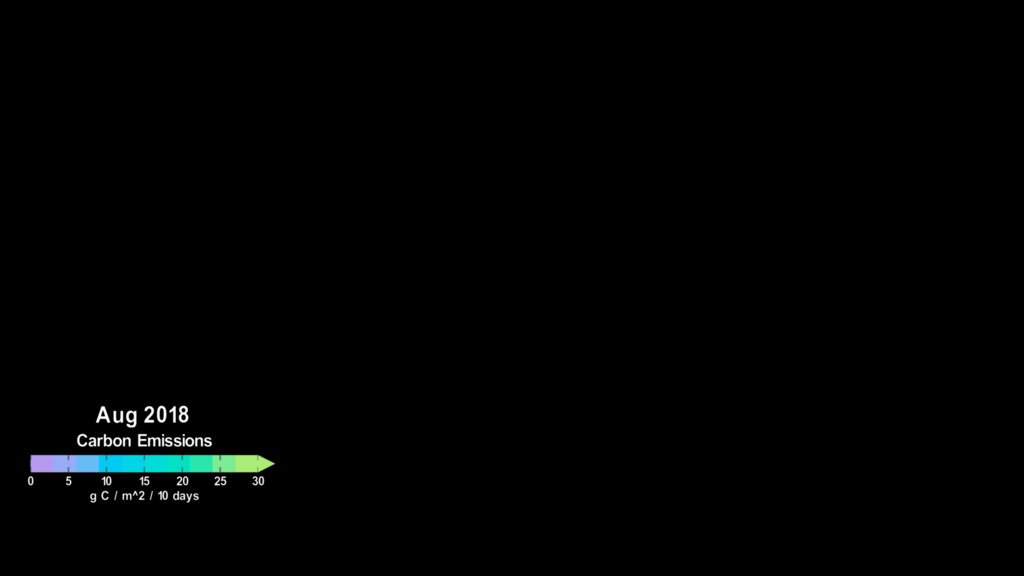
The date and colorbar overlay with transparency
Credits
Please give credit for this item to:
NASA's Scientific Visualization Studio
-
Visualizers
- Cindy Starr (Global Science and Technology, Inc.)
- Greg Shirah (NASA/GSFC)
-
Scientists
- Doug C. Morton (NASA/GSFC)
- Jim Randerson (University of California, Irvine)
- Niels Andela (Science Collaborator)
-
Project support
- Leann Johnson (Global Science and Technology, Inc.)
- Eric Sokolowsky (Global Science and Technology, Inc.)
-
Technical support
- Laurence Schuler (ADNET Systems, Inc.)
- Ian Jones (ADNET Systems, Inc.)
Release date
This page was originally published on Thursday, July 11, 2019.
This page was last updated on Wednesday, November 15, 2023 at 12:13 AM EST.
Papers used in this visualization
M. Mu, J.T. Randerson, G.R. van der Werf, L. Giglio, P. Kasibhatla, D. Morton, G.J. Collatz, R.S. DeFries, E.J. Hyer, E.M. Prins, D.W.T. Griffith, D. Wunch, G.C. Toon, V. Sherlock, P.O. Wennberg, Daily and 3-hourly variability in global fire emissions and consequences for atmospheric model predictions of carbon monoxide. J. Geophys. Res. Atmos., 116 (2011), p. D24303
Datasets used in this visualization
-
GFED4s (Global Fire Emissions Database, Version 4.1)
ID: 1050This fourth version of the Global Fire Emissions Database (GFED4s) provides monthly burned area, fire carbon (C) and dry matter (DM) emissions, and the contribution of different fire types to these emissions in order to calculate trace gas and aerosol emissions using emission factors.
See all pages that use this dataset
Note: While we identify the data sets used in these visualizations, we do not store any further details, nor the data sets themselves on our site.
Related
- ID: 4746
 Visualization
 - ID: 13263