Earth
Sun
Planets and Moons
ID: 4518
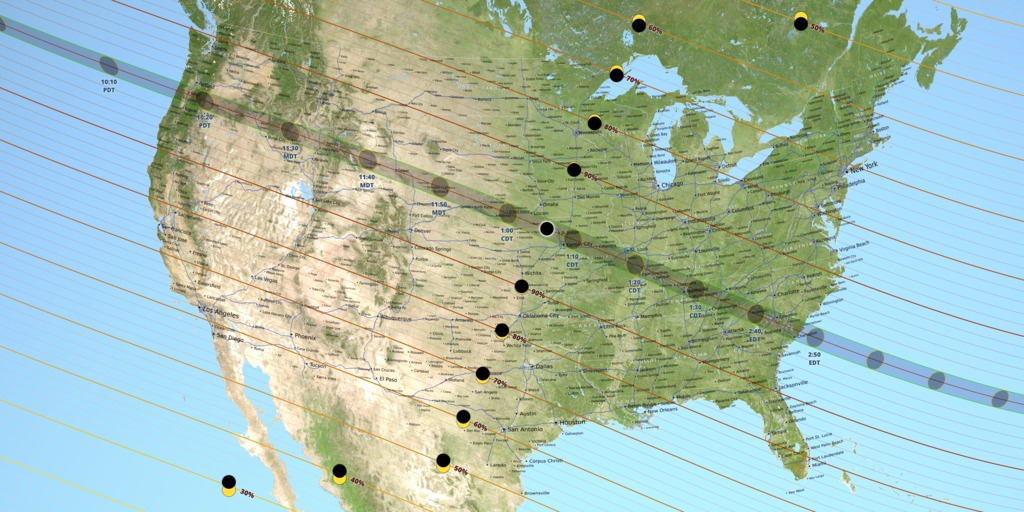
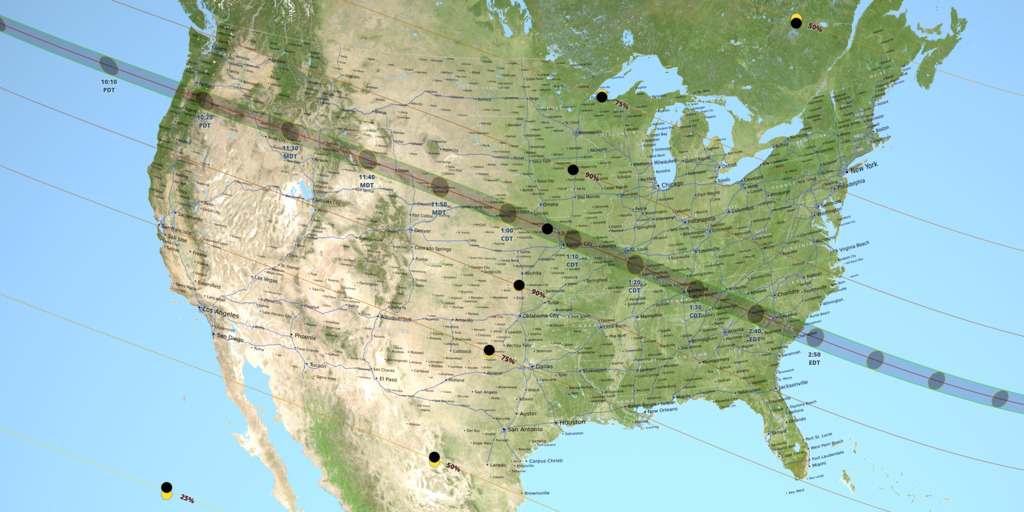
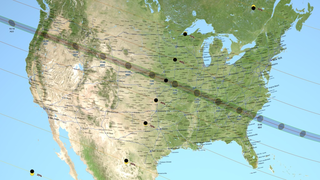
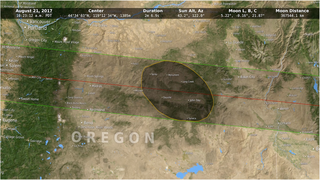
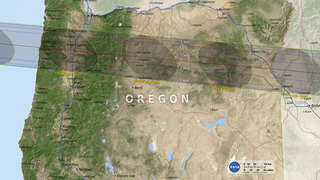
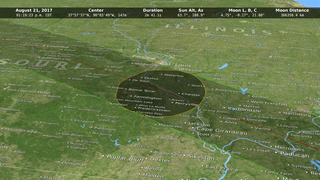
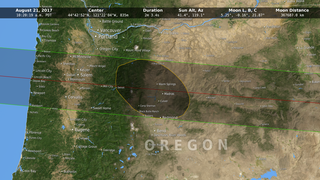
This map of the United States shows the path of the Moon's umbral shadow — the path of totality — during the total solar eclipse on August 21, 2017, as well as the obscuration (the fraction of the Sun's area covered by the Moon) in places outside the umbral path. Features include state boundaries, major highways, and 833 place names. At 18" × 9" (45 × 22.5 cm), the scale of the map is approximately 1:10,000,000.
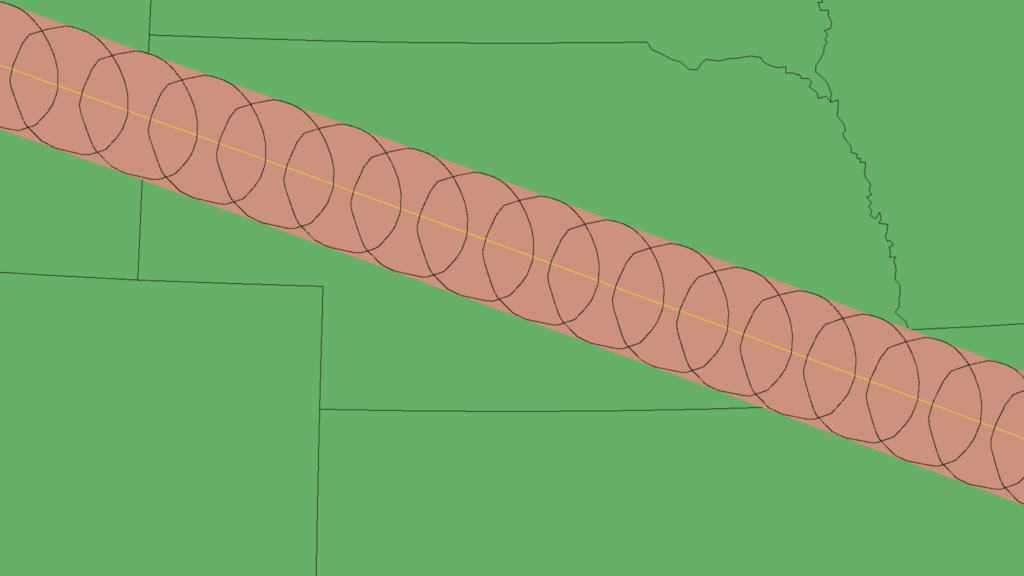
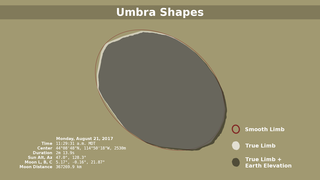
The umbra is shown at 10-minute intervals. Umbra shapes within U.S. time zones are labeled in local time. To read about the reason the shapes aren't smooth ovals, go here.
The map uses a number of NASA data products. The land color is based on Blue Marble Next Generation, a global mosaic of MODIS images assembled by NASA's Earth Observatory. Elevations are from SRTM, a radar instrument flown on Space Shuttle Endeavour during the STS-99 mission. Lunar topography, used for precise shadow calculations, is from NASA LRO laser altimetry and JAXA Kaguya stereo imaging. Planetary positions are from the JPL DE421 ephemeris. The lunar limb profile and eclipse calculations are by the visualizer.

eclipse2017_shapefiles.zip contains the following nine shapefiles:
penum17 contains the contours for maximum obscuration at 90%, 75%, 50%, 25% and the penumbra edge at 0%.
penum17_1m contains a time sequence of penumbra outlines at 1-minute intervals from 17:00 to 19:15 UTC, for 95% to 75% obscuration in 5% steps.
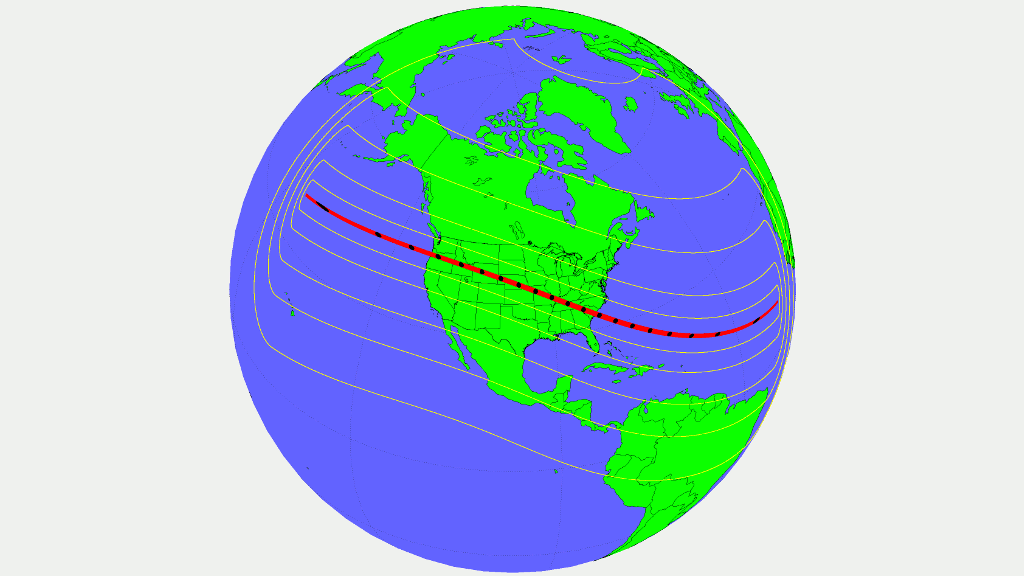
upath17 and w_upath17 contain the path of totality. The w_ version is the complete (world) path, at somewhat reduced resolution, while the other is a high-resolution version of the path limited to the 96 degrees of longitude centered on the U.S.
umbra17 and w_umbra17 contain umbra shapes spaced at 10-minute intervals, again at U.S. and world (w_) scales.
w_umbra17_1m contains umbra shapes at 1-minute intervals from 16:49 to 20:02 UTC, covering the complete timespan of totality.
center17 and w_center17 contain the center line.
The projection for all of these shapefiles is WGS84, latitude-longitude, in degrees. A minimal .PRJ file reflecting this projection is included for each shape.
eclipse2017_shapefiles_1s.zip is intended for larger-scale (higher resolution) mapping. It contains the following shapefiles:
umbra17_1s contains 6000 umbra shapes at one-second intervals from 17:12 to 18:52 UTC. These are high-resolution shapes with roughly 100-meter precision. The attributes for each shape include both a string representation of the UTC time and an integer containing the number of seconds past midnight of eclipse day.
upath17_1s contains the path of totality, limited to the extent of the 6000 umbra shapes, roughly the 54 degrees of longitude between 130°W and 76°W. The shape was calculated at a precision of 250 meters.
ucenter17_1s contains the center line as a polyline with points at one-second intervals.
durations17_1s contains shapefiles for duration of totality at 30-second intervals. As with the path, these shapes are truncated and invalid at the ends.
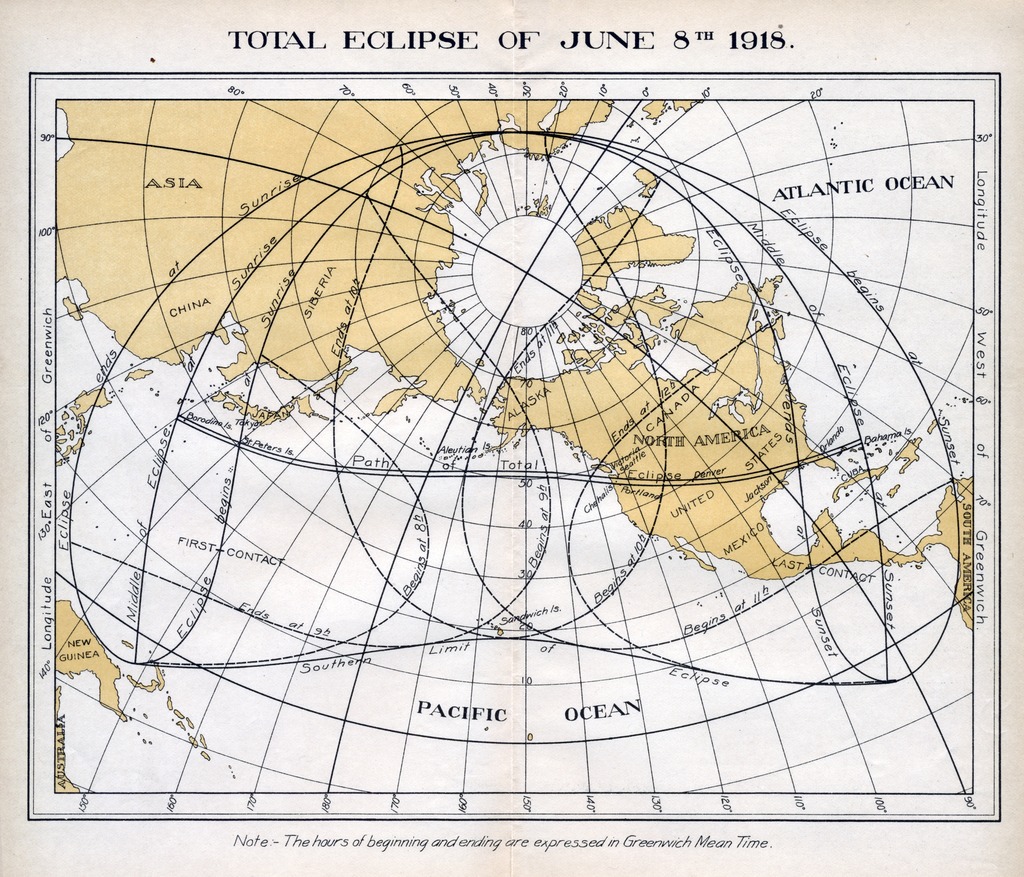
The last time a total solar eclipse spanned the contiguous United States was in 1918. The path of totality entered the U.S. through the southwest corner of Washington state and passed over Denver, Jackson (Mississippi) and Orlando before exiting the country at the Atlantic coast of Florida.
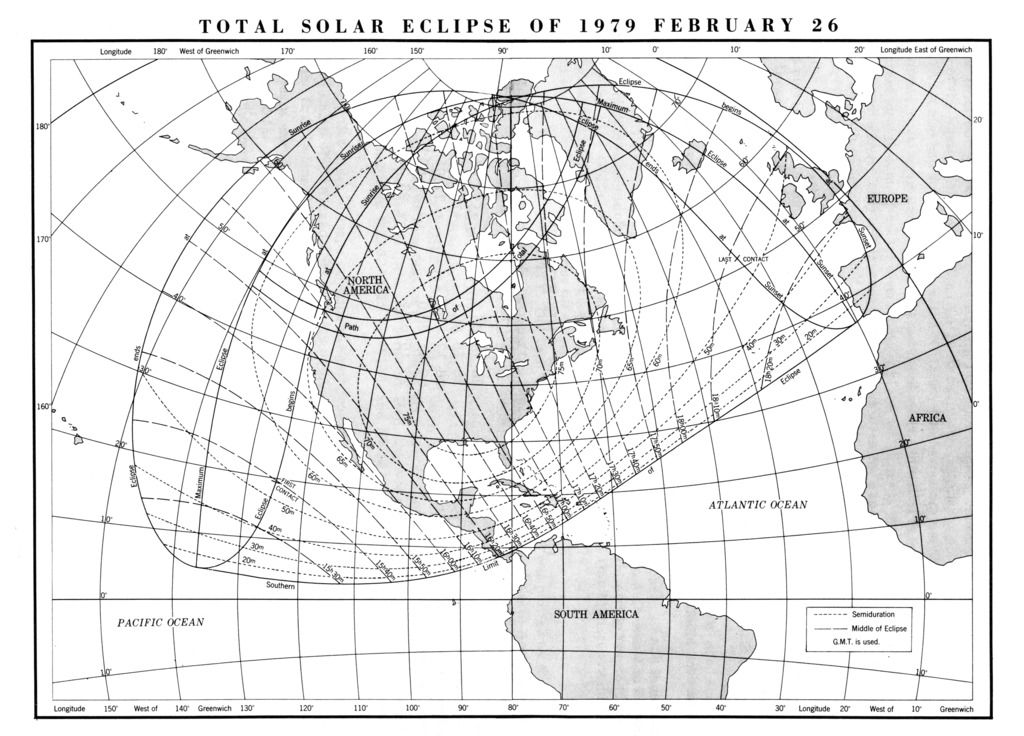
Prior to 2017, the most recent total solar eclipse in the Lower 48 was in 1979. Totality was visible in Washington, Oregon, Idaho, Montana, and North Dakota, as well as parts of Canada and Greenland. The author saw this eclipse in Winnipeg, Manitoba.
2017 Total Solar Eclipse Map and Shapefiles
The umbra is shown at 10-minute intervals. Umbra shapes within U.S. time zones are labeled in local time. To read about the reason the shapes aren't smooth ovals, go here.
The map uses a number of NASA data products. The land color is based on Blue Marble Next Generation, a global mosaic of MODIS images assembled by NASA's Earth Observatory. Elevations are from SRTM, a radar instrument flown on Space Shuttle Endeavour during the STS-99 mission. Lunar topography, used for precise shadow calculations, is from NASA LRO laser altimetry and JAXA Kaguya stereo imaging. Planetary positions are from the JPL DE421 ephemeris. The lunar limb profile and eclipse calculations are by the visualizer.
Shapefiles
The map was rendered in animation software, but maps are more typically created using GIS tools and vector datasets. A set of shapefiles describing the umbra and penumbra extents is provided below in two Zip archives, one for global, U.S., and statewide maps and the other for county and city scale mapping.penum17 contains the contours for maximum obscuration at 90%, 75%, 50%, 25% and the penumbra edge at 0%.
penum17_1m contains a time sequence of penumbra outlines at 1-minute intervals from 17:00 to 19:15 UTC, for 95% to 75% obscuration in 5% steps.
upath17 and w_upath17 contain the path of totality. The w_ version is the complete (world) path, at somewhat reduced resolution, while the other is a high-resolution version of the path limited to the 96 degrees of longitude centered on the U.S.
umbra17 and w_umbra17 contain umbra shapes spaced at 10-minute intervals, again at U.S. and world (w_) scales.
w_umbra17_1m contains umbra shapes at 1-minute intervals from 16:49 to 20:02 UTC, covering the complete timespan of totality.
center17 and w_center17 contain the center line.
The projection for all of these shapefiles is WGS84, latitude-longitude, in degrees. A minimal .PRJ file reflecting this projection is included for each shape.
umbra17_1s contains 6000 umbra shapes at one-second intervals from 17:12 to 18:52 UTC. These are high-resolution shapes with roughly 100-meter precision. The attributes for each shape include both a string representation of the UTC time and an integer containing the number of seconds past midnight of eclipse day.
upath17_1s contains the path of totality, limited to the extent of the 6000 umbra shapes, roughly the 54 degrees of longitude between 130°W and 76°W. The shape was calculated at a precision of 250 meters.
ucenter17_1s contains the center line as a polyline with points at one-second intervals.
durations17_1s contains shapefiles for duration of totality at 30-second intervals. As with the path, these shapes are truncated and invalid at the ends.
Past Eclipses
Used Elsewhere In
Related


For More Information
Visualization Credits
Ernie Wright (USRA): Lead Visualizer
Please give credit for this item to:
NASA's Scientific Visualization Studio
NASA's Scientific Visualization Studio
Short URL to share this page:
https://svs.gsfc.nasa.gov/4518
Mission:
LRO (Lunar Reconnaissance Orbiter)
Data Used:
Note: While we identify the data sets used in these visualizations, we do not store any further details nor the data sets themselves on our site.
This item is part of this series:
2017 Solar Eclipse
Keywords:
SVS >> Moon
SVS >> Solar Eclipse
GCMD >> Earth Science >> Sun-earth Interactions
SVS >> Hyperwall
SVS >> Eclipse
SVS >> Heliophysics
SVS >> Sun-Earth-Moon Interactions
SVS >> Sun and Earth
NASA Science >> Earth
NASA Science >> Sun
NASA Science >> Planets and Moons
SVS >> Presentation
SVS >> Map
GCMD keywords can be found on the Internet with the following citation: Olsen, L.M., G. Major, K. Shein, J. Scialdone, S. Ritz, T. Stevens, M. Morahan, A. Aleman, R. Vogel, S. Leicester, H. Weir, M. Meaux, S. Grebas, C.Solomon, M. Holland, T. Northcutt, R. A. Restrepo, R. Bilodeau, 2013. NASA/Global Change Master Directory (GCMD) Earth Science Keywords. Version 8.0.0.0.0
https://svs.gsfc.nasa.gov/4518
Mission:
LRO (Lunar Reconnaissance Orbiter)
Data Used:
SRTM/SIR-C/DEM
Terra and Aqua/MODIS/Blue Marble: Next Generation also referred to as: BMNG
Credit:
The Blue Marble data is courtesy of Reto Stockli (NASA/GSFC).
The Blue Marble data is courtesy of Reto Stockli (NASA/GSFC).
LRO/LOLA/Digital Elevation Map also referred to as: DEM
JPL DE421 also referred to as: DE421
Ephemeris - NASA/JPL
Planetary ephemerides
LRO/SELENE/LOLA/TC/DIgital Elevation Model also referred to as: SLDEM2015
Model
A digital elevation model of the Moon derived from the Lunar Orbiter Laser Altimeter and the SELENE Terrain Camera. See the description in Icarus. The data is here.
Natural Earth: North America Roads also referred to as: North America Roads
Database - Natural Earth
The 1:1,000,000 scale roads database for North America from Natural Earth: http://www.naturalearthdata.com/downloads/10m-cultural-vectors/roads/. This data is in the public domain. Terms of use: http://www.naturalearthdata.com/about/terms-of-use/.
This item is part of this series:
2017 Solar Eclipse
Keywords:
SVS >> Moon
SVS >> Solar Eclipse
GCMD >> Earth Science >> Sun-earth Interactions
SVS >> Hyperwall
SVS >> Eclipse
SVS >> Heliophysics
SVS >> Sun-Earth-Moon Interactions
SVS >> Sun and Earth
NASA Science >> Earth
NASA Science >> Sun
NASA Science >> Planets and Moons
SVS >> Presentation
SVS >> Map
GCMD keywords can be found on the Internet with the following citation: Olsen, L.M., G. Major, K. Shein, J. Scialdone, S. Ritz, T. Stevens, M. Morahan, A. Aleman, R. Vogel, S. Leicester, H. Weir, M. Meaux, S. Grebas, C.Solomon, M. Holland, T. Northcutt, R. A. Restrepo, R. Bilodeau, 2013. NASA/Global Change Master Directory (GCMD) Earth Science Keywords. Version 8.0.0.0.0


