Earth
Sun
Planets and Moons
ID: 4515
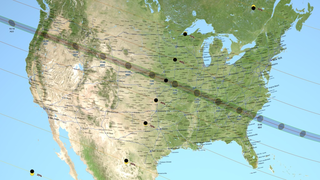
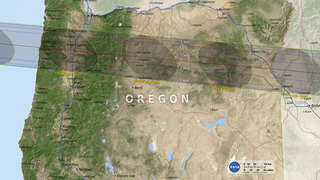
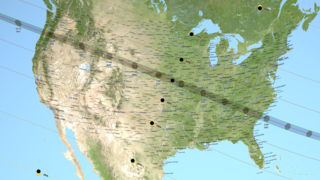
During the August 21, 2017 total solar eclipse, the Moon's umbral shadow will fly across the United States, from Oregon to South Carolina, in a little over 90 minutes. The path of this shadow, the path of totality, is where observers will see the Moon completely cover the Sun for about two and a half minutes.
People traveling to see totality, likely numbering in the millions for this eclipse, will rely on maps that show the predicted location of this path. The math used to make eclipse maps was worked out by Friedrich Wilhelm Bessel and William Chauvenet in the 19th century, long before computers and the precise astronomical data gathered during the Space Age.
In keeping with their paper and pencil origins, traditional eclipse calculations pretend that all observers are at sea level and that the Moon is a smooth sphere centered on its center of mass. Reasonably accurate maps, including this one, are drawn based on those simplifying assumptions. Those who want greater accuracy are usually referred to elevation tables and plots of the lunar limb.
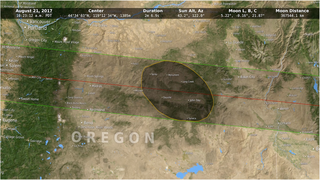
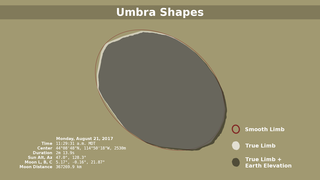
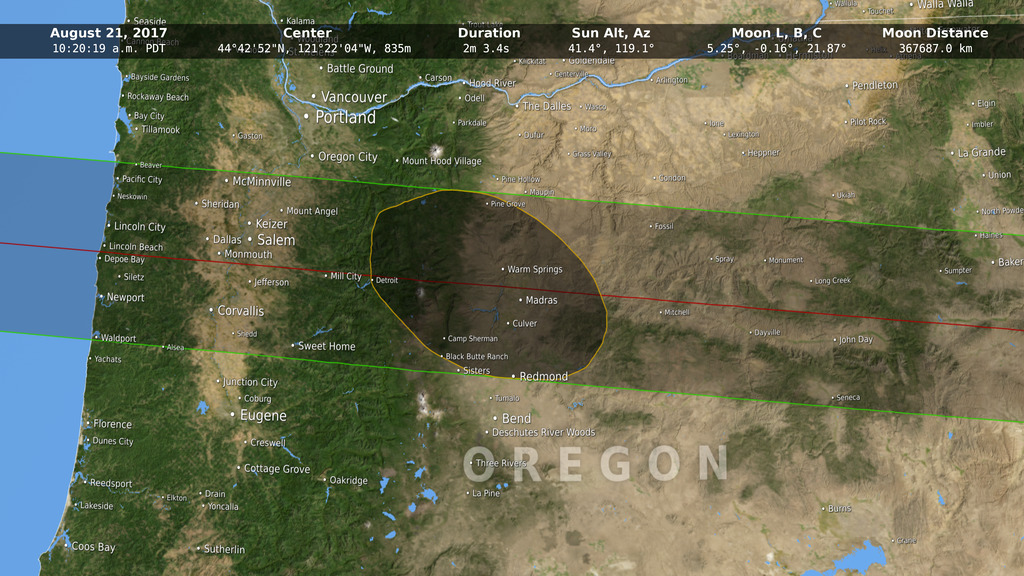
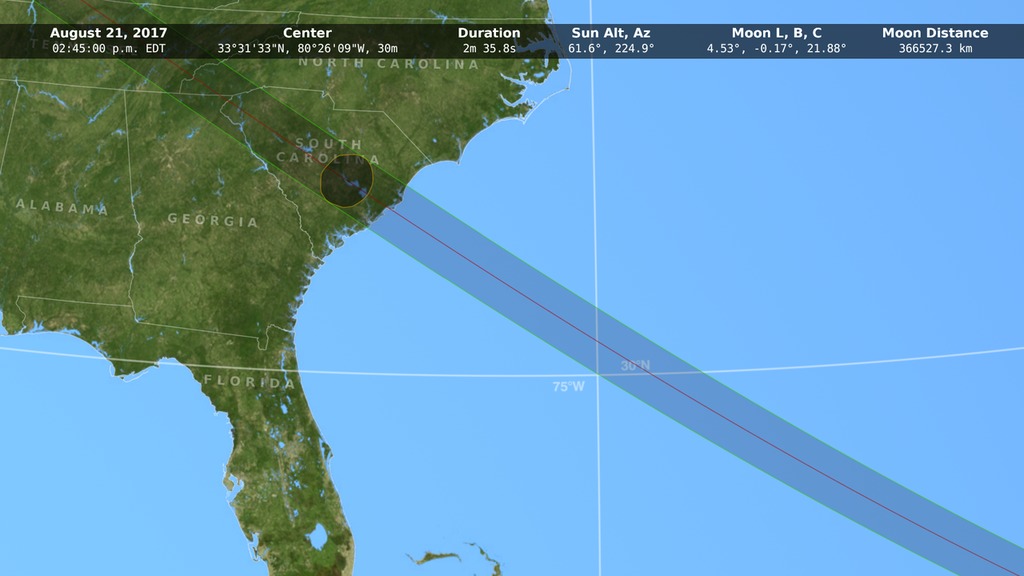
This animation shows the umbra and its path in a new way. Elevations on the Earth's surface and the irregular lunar limb (the silhouette edge of the Moon's disk) are both fully accounted for, and they both have dramatic and surprising effects on the shape of the umbra and the location of the path. To read more about these effects, go here.
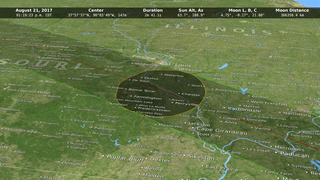
The animation provides an overhead view of the umbra and runs at a rate of 30× real time — every minute of the eclipse takes two seconds in the animation. For an oblique view that emphasizes the terrain of the path, go here.
2017 Path of Totality
People traveling to see totality, likely numbering in the millions for this eclipse, will rely on maps that show the predicted location of this path. The math used to make eclipse maps was worked out by Friedrich Wilhelm Bessel and William Chauvenet in the 19th century, long before computers and the precise astronomical data gathered during the Space Age.
In keeping with their paper and pencil origins, traditional eclipse calculations pretend that all observers are at sea level and that the Moon is a smooth sphere centered on its center of mass. Reasonably accurate maps, including this one, are drawn based on those simplifying assumptions. Those who want greater accuracy are usually referred to elevation tables and plots of the lunar limb.
This animation shows the umbra and its path in a new way. Elevations on the Earth's surface and the irregular lunar limb (the silhouette edge of the Moon's disk) are both fully accounted for, and they both have dramatic and surprising effects on the shape of the umbra and the location of the path. To read more about these effects, go here.
The animation provides an overhead view of the umbra and runs at a rate of 30× real time — every minute of the eclipse takes two seconds in the animation. For an oblique view that emphasizes the terrain of the path, go here.
| Earth radius | 6378.137 km |
|---|---|
| Ellipsoid | WGS84 |
| Geoid | EGM96 |
| Moon radius | 1737.4 km |
| Sun radius | 696,000 km (959.645 arcsec at 1 AU) |
| Ephemeris | DE 421 |
| Earth orientation | earth_070425_370426_predict.bpc (ΔT corrected) |
| Delta UTC | 69.184 seconds (TT – TAI + 37 leap seconds) |
| ΔT | 68.917 seconds |
Used Elsewhere In
Related

For More Information
Visualization Credits
Ernie Wright (USRA): Lead Visualizer
Please give credit for this item to:
NASA's Scientific Visualization Studio
NASA's Scientific Visualization Studio
Short URL to share this page:
https://svs.gsfc.nasa.gov/4515
Mission:
LRO (Lunar Reconnaissance Orbiter)
Data Used:
Note: While we identify the data sets used in these visualizations, we do not store any further details nor the data sets themselves on our site.
This item is part of this series:
2017 Solar Eclipse
Keywords:
SVS >> HDTV
SVS >> Moon
SVS >> Solar Eclipse
GCMD >> Earth Science >> Sun-earth Interactions
SVS >> Hyperwall
SVS >> Eclipse
SVS >> Heliophysics
SVS >> Sun-Earth-Moon Interactions
SVS >> Sun and Earth
NASA Science >> Earth
NASA Science >> Sun
NASA Science >> Planets and Moons
SVS >> Presentation
GCMD keywords can be found on the Internet with the following citation: Olsen, L.M., G. Major, K. Shein, J. Scialdone, S. Ritz, T. Stevens, M. Morahan, A. Aleman, R. Vogel, S. Leicester, H. Weir, M. Meaux, S. Grebas, C.Solomon, M. Holland, T. Northcutt, R. A. Restrepo, R. Bilodeau, 2013. NASA/Global Change Master Directory (GCMD) Earth Science Keywords. Version 8.0.0.0.0
https://svs.gsfc.nasa.gov/4515
Mission:
LRO (Lunar Reconnaissance Orbiter)
Data Used:
SRTM/SIR-C/DEM
Terra and Aqua/MODIS/Blue Marble: Next Generation also referred to as: BMNG
Credit:
The Blue Marble data is courtesy of Reto Stockli (NASA/GSFC).
The Blue Marble data is courtesy of Reto Stockli (NASA/GSFC).
LRO/LOLA/Digital Elevation Map also referred to as: DEM
JPL DE421 also referred to as: DE421
Ephemeris - NASA/JPL
Planetary ephemerides
LRO/SELENE/LOLA/TC/DIgital Elevation Model also referred to as: SLDEM2015
Model
A digital elevation model of the Moon derived from the Lunar Orbiter Laser Altimeter and the SELENE Terrain Camera. See the description in Icarus. The data is here.
This item is part of this series:
2017 Solar Eclipse
Keywords:
SVS >> HDTV
SVS >> Moon
SVS >> Solar Eclipse
GCMD >> Earth Science >> Sun-earth Interactions
SVS >> Hyperwall
SVS >> Eclipse
SVS >> Heliophysics
SVS >> Sun-Earth-Moon Interactions
SVS >> Sun and Earth
NASA Science >> Earth
NASA Science >> Sun
NASA Science >> Planets and Moons
SVS >> Presentation
GCMD keywords can be found on the Internet with the following citation: Olsen, L.M., G. Major, K. Shein, J. Scialdone, S. Ritz, T. Stevens, M. Morahan, A. Aleman, R. Vogel, S. Leicester, H. Weir, M. Meaux, S. Grebas, C.Solomon, M. Holland, T. Northcutt, R. A. Restrepo, R. Bilodeau, 2013. NASA/Global Change Master Directory (GCMD) Earth Science Keywords. Version 8.0.0.0.0


