Landslide Activity in the Americas for the Cover of Earth's Future

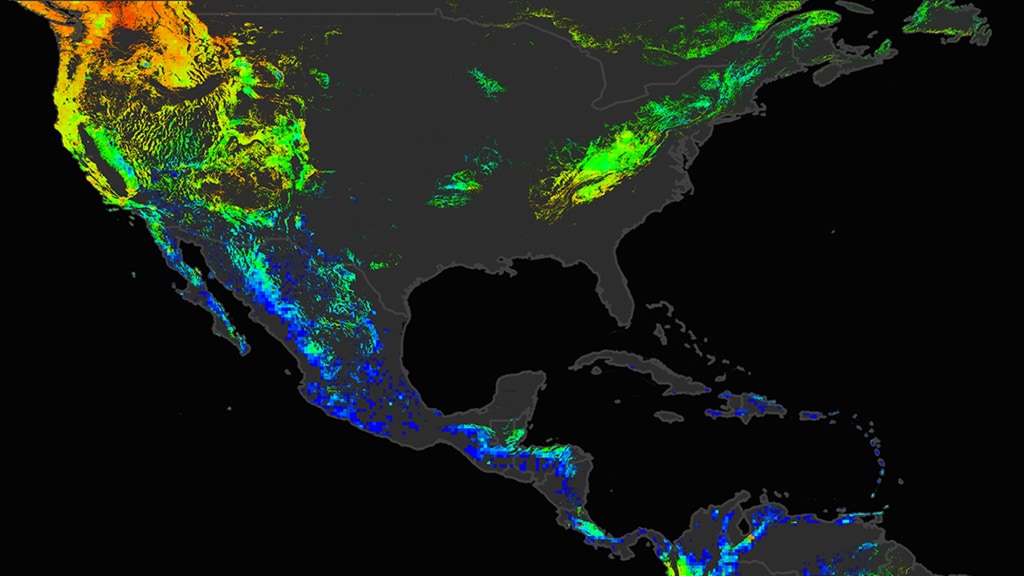
A view of the potential landslide activity during January in the Americas, as evaluated by NASA's Landslide Hazard Assessment model for Situational Awareness (LHASA). This still image is provided in 300dpi (print resolution) and in separate layers (water, data, land, outlines).
This print-resolution still image was created for the cover of the March 2018 issue of Earth's Future. In an article in the same issue, NASA scientists Dalia Kirschbaum and Thomas Stanley describe the new model they developed to look at potential landslide activity.
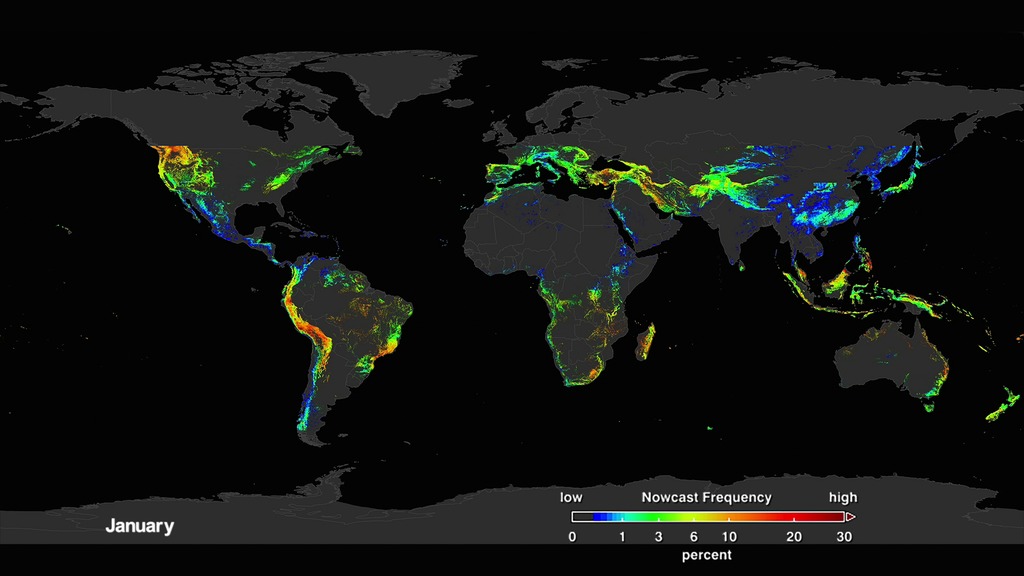
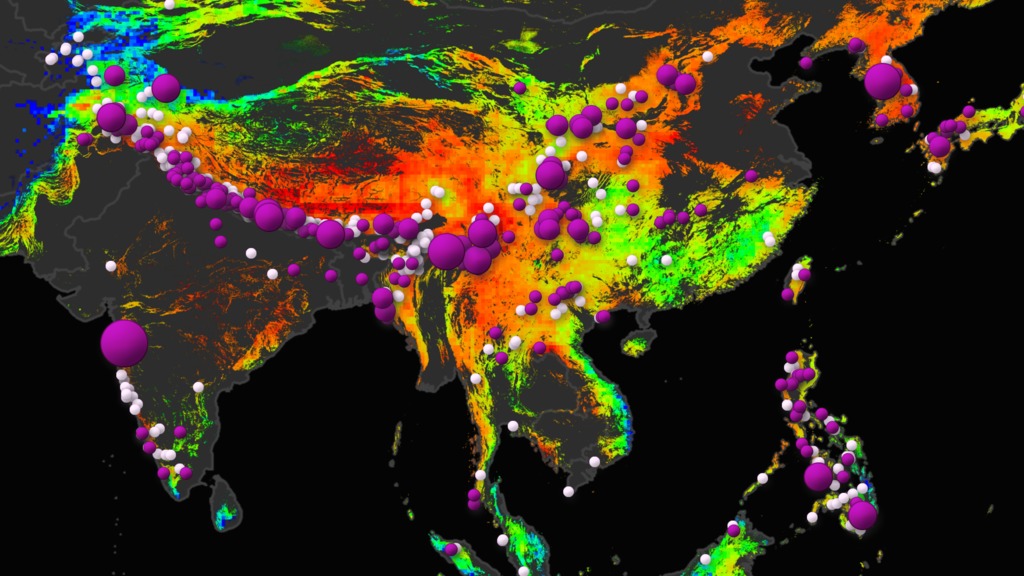
Landslides occur when an environmental trigger like an extreme rain event, often a severe storm or hurricane, and gravity's downward pull sets soil and rock in motion. Conditions beneath the surface are often unstable already, so the heavy rains act as the last straw that causes mud, rocks, or debris- or all combined- to move rapidly down mountains and hillsides. Unfortunately, people and property are often swept up in these unexpected mass movements. Landslides can also be caused by earthquakes, surface freezing and thawing, ice melt, the collapse of groundwater reservoirs, volcanic eruptions, and erosion at the base of a slope from the flow of river or ocean water. But torrential rains most commonly activate landslides.
A new model has been developed to look at how potential landslide activity is changing around the world. A global Landslide Hazard Assessment model for Situational Awareness (LHASA) has been developed to provide an indication of where and when landslides may be likely around the world every 30min. This model uses surface susceptibility (including slope, vegetation, road networks, geology, and forest cover loss) and satellite rainfall data from the Global Precipitation Measurement (GPM) mission to provide moderate to high “nowcasts.” This data driven still image shows the landslide nowcast in the Americas for the month of January leveraging nearly two decades of Tropical Rainfall Measurement Mission (TRMM) rainfall over 2001-2016 to identify a landslide climatology by month at a 1 km grid cell.
For more information about the newly developed model, please visit: New NASA Model Finds Landslide Threats in Near Real-Time During Heavy Rains
A view of the potential landslide activity during January in the Americas, as evaluated by NASA's Landslide Hazard Assessment model for Situational Awareness (LHASA). This still image is provided in 300dpi (print resolution) with dark background.
A view of the potential landslide activity during January in the Americas as evaluated by NASA's Landslide Hazard Assessment model for Situational Awareness (LHASA). This still image is provided in 300dpi (print resolution) with grey background.
Colorbar for the landslide climatology.
For More Information
See the following sources:
Credits
Please give credit for this item to:
NASA's Scientific Visualization Studio
-
Visualizers
- Helen-Nicole Kostis (USRA)
- Horace Mitchell (NASA/GSFC)
-
Scientists
- Dalia B Kirschbaum (NASA/GSFC)
- Thomas A. Stanley (USRA)
-
Producers
- Ryan Fitzgibbons (USRA)
- Joy Ng (USRA)
-
Technical support
- Ian Jones (ADNET Systems, Inc.)
- Laurence Schuler (ADNET Systems, Inc.)
-
Project support
- Joycelyn Thomson Jones (NASA/GSFC)
- Leann Johnson (Global Science and Technology, Inc.)
- Eric Sokolowsky (Global Science and Technology, Inc.)
Release date
This page was originally published on Thursday, March 22, 2018.
This page was last updated on Wednesday, May 3, 2023 at 1:46 PM EDT.
Missions
This visualization is related to the following missions:Papers used in this visualization
Dalia Kirschbaum and Thomas Stanley, Satellite-Based Assessment of Rainfall-Triggered Landslide Hazard for Situational Awareness, Earth's Future, Volume 6, Issue 3, March 2018, Pages 297-616, ISSN 2328-4277, https://doi.org/10.1002/2017EF000715
Datasets used in this visualization
-
Global Landslide Model (Global Landslide Hazard Assessment for Situational Awareness (LHASA))
ID: 1001https://pmm.nasa.gov/applications/global-landslide-modelThe global Landslide Hazard Assessment for Situational Awareness (LHASA) model is developed to provide situational awareness of landslide hazards for a wide range of users. Precipitation is
See all pages that use this dataset
Note: While we identify the data sets used in these visualizations, we do not store any further details, nor the data sets themselves on our site.
Related
- ID: 13126
 Produced Video
 - ID: 4710
 Visualization
 - ID: 4631
- ID: 4640
- ID: 4632
 Visualization
 - ID: 4305
- ID: 4304
Used as a Source In
- ID: 12897