Global Landslide Catalog (Update 2017)
This entry contains updated maps generated for Glocal Landslide Catalog Aids View From Space, released on April 16, 2015
Landslides are among the most common and dramatic natural hazards, reshaping landscapes -- and anything in their path. Tracking when and where landslides occur worldwide has historically been difficult, because of the lack of a centralized database across all nations. But NASA researchers have updated the first publicly available Global Landslide Catalog (GLC), based on media reports and online databases that bring together many sources of information on landslides that have occurred. The GLC has been compiled since 2007 at NASA's Goddard Space Flight Center and was originally released in 2010. Around 10,804 landslides are noted in the catalog for the period 2007-2017. This wealth of data gives scientists a starting point to analyze where, how and why landslides are likely to occur.
The catalog is currently available here: https://catalog.data.gov/dataset/global-landslide-catalog-export
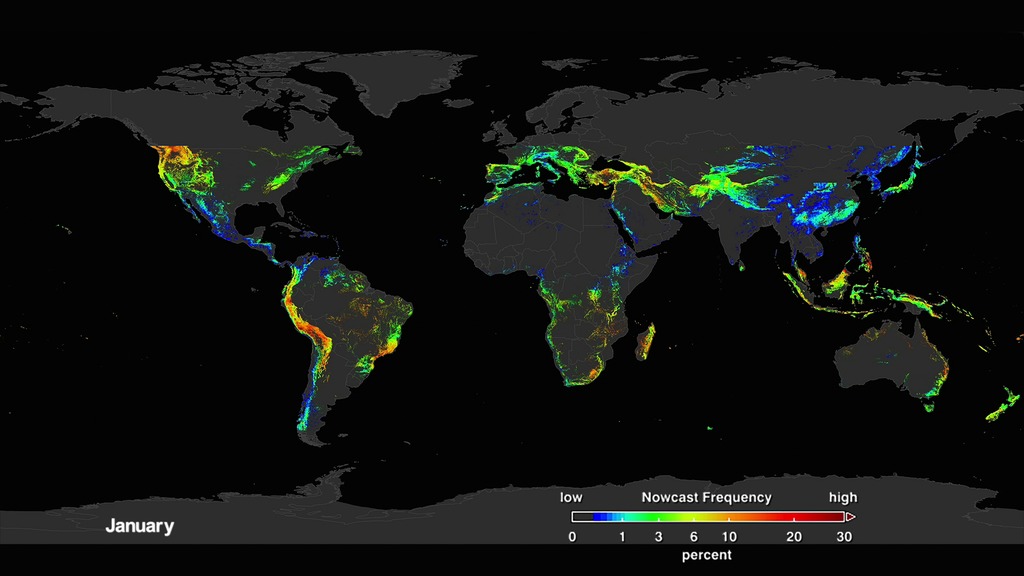
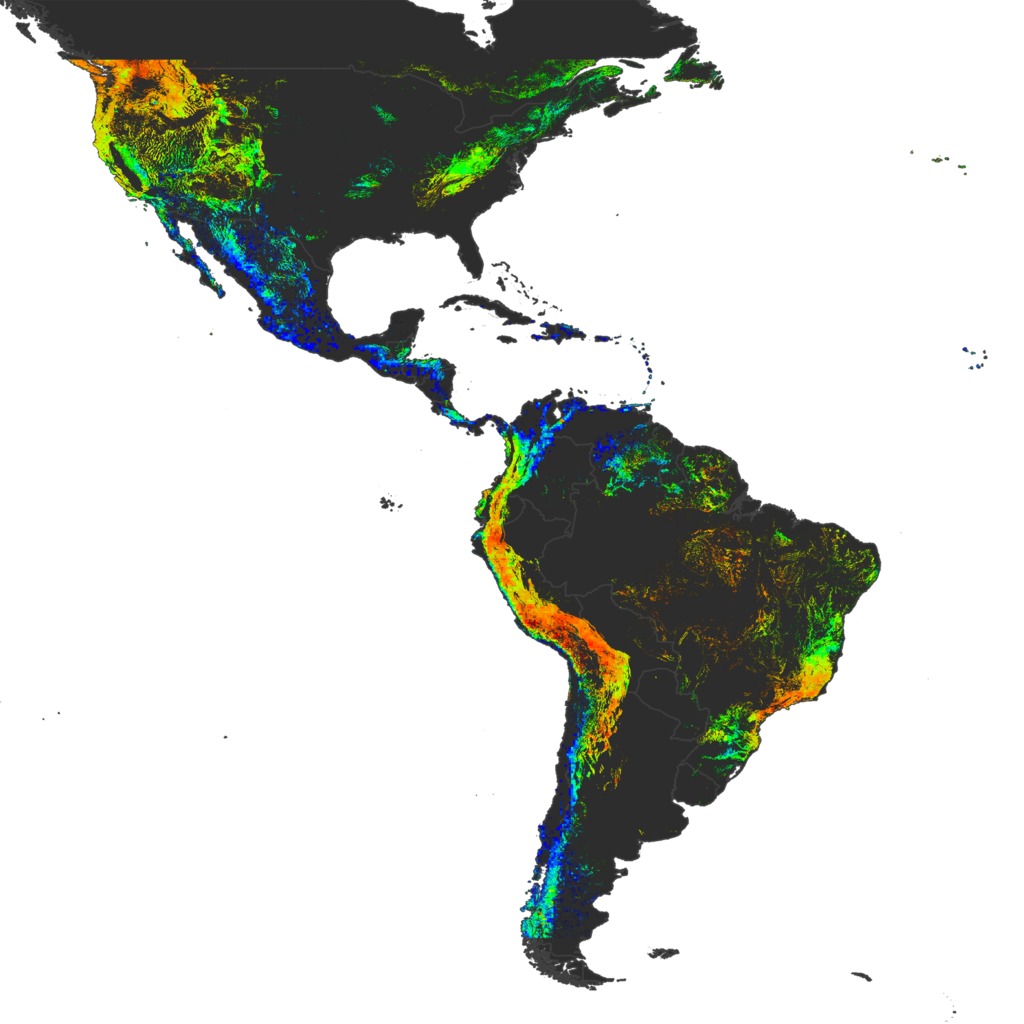
Recently, a new model was developed to look at how potential landslide activity is changing around the world. A global Landslide Hazard Assessment model for Situational Awareness (LHASA) has been developed to provide an indication of where and when landslides may be likely around the world every 30 minutes. This model uses surface susceptibility (including slope, vegetation, road networks, geology, and forest cover loss) and satellite rainfall data from the Global Precipitation Measurement (GPM) mission to provide moderate to high “nowcasts.” For more information about this new model, please visit: New NASA Model Finds Landslide Threats in Near Real-Time During Heavy Rains"

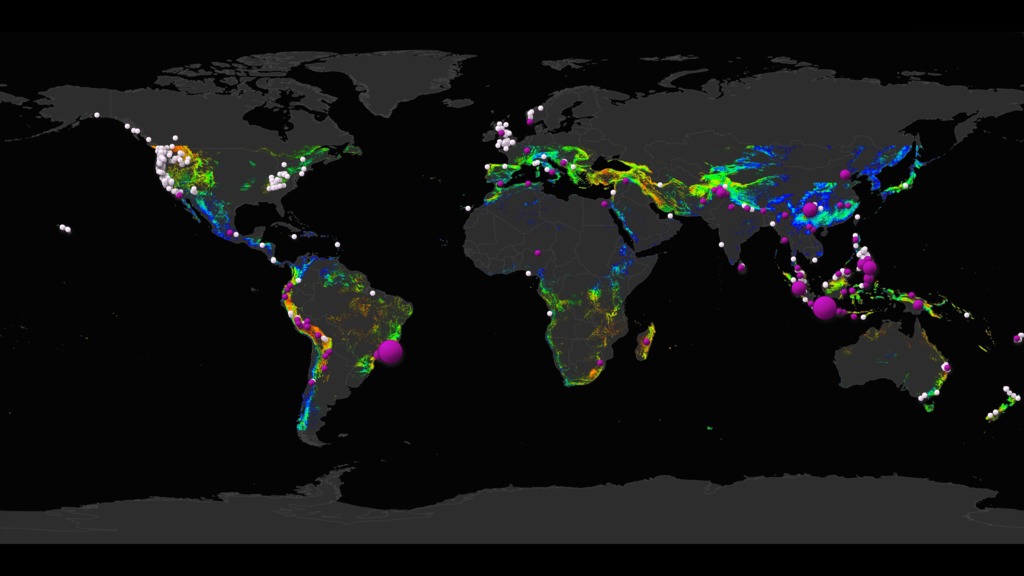
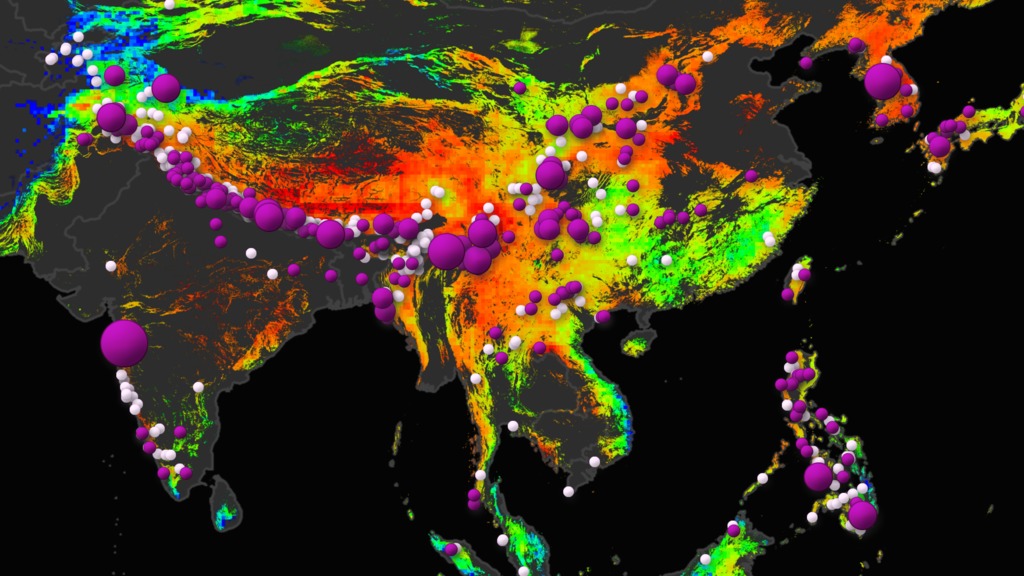
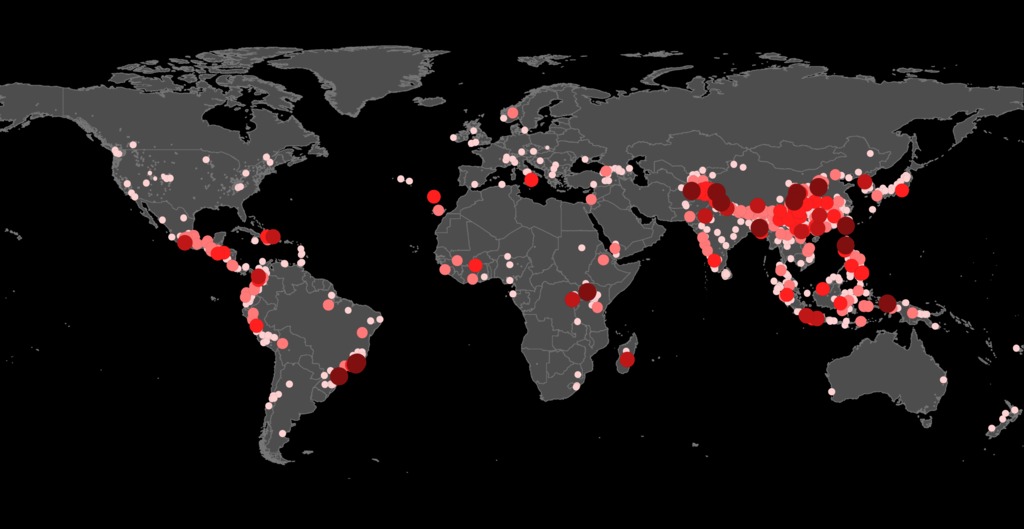
Using the Global Landslide Catalog, a map, including a legend, has been produced to show the distribution and number of reported fatallities associated with approximately 10,804 rainfall-triggered landslides from 2007-2017. Out of the 10,804 reported rainfall-triggered landslides, 8,369 incidents had zero fatalities. White dots represent incidents with zero reported fatalities. Dots in the color scale from pink to red represent incidents with fatalities in the range of 1-5000.
Using the Global Landslide Catalog, a map has been produced to show the distribution and number of reported fatallities associated with approximately 10,804 rainfall-triggered landslides from 2007-2017. Out of the 10,804 reported rainfall-triggered landslides, 8,369 incidents had zero fatalities. White dots represent incidents with zero reported fatalities. Dots in the color scale from pink to red represent incidents with fatalities in the range of 1-5000.
Using the Global Landslide Catalog, a map has been produced to show the distribution and number of reported fatalities for the period 2007-2017. Dots in the color scale from pink to red represent incidents with fatalities in the range of 1-5000.
Using the Global Landslide Catalog, a map has been produced to show the location of 8,369 zero reported fatalities associated with rainfall-triggered landslides for the period 2007-2017.
This is a legend that accompanies the map that shows the distribution and number of fatallities associated with rainfall-triggered landslides in the Global Landslide Catalog for 2007-2017. This legend should accompany the map of size 3840x2160.
Using the Global Landslide Catalog, a map, including a legend, has been produced to show the distribution and number of reported fatallities associated with approximately 10,804 rainfall-triggered landslides from 2007-2017. Out of the 10,804 reported rainfall-triggered landslides, 8,369 incidents had zero fatalities. White dots represent incidents with zero reported fatalities. Dots in the color scale from pink to red represent incidents with fatalities in the range of 1-5000. This map is provided in 9600x5400 to allow for close-up views in any location around the world or to be previewed on hyperwall.
Using the Global Landslide Catalog, a map, has been produced to show the distribution and number of reported fatallities associated with approximately 10,804 rainfall-triggered landslides from 2007-2017. Out of the 10,804 reported rainfall-triggered landslides, 8,369 incidents had zero fatalities. White dots represent incidents with zero reported fatalities. Dots in the color scale from pink to red represent incidents with fatalities in the range of 1-5000. This map is provided in 9600x5400 to allow for close-up views in any location around the world or to be previewed on hyperwall.
Using the Global Landslide Catalog, a map has been produced to show the location of 8,369 zero reported fatalities associated with rainfall-triggered landslides for the period 2007-2017.This map is provided in 9600x5400.
This is a legend that accompanies the map that shows the distribution and number of fatallities associated with rainfall-triggered landslides in the Global Landslide Catalog for 2007-2017. This legend should accompany the map of size 9600x5400.
For More Information
Credits
Please give credit for this item to:
NASA's Scientific Visualization Studio
-
Visualizers
- Helen-Nicole Kostis (USRA)
- Lori Perkins (NASA/GSFC)
-
Scientists
- Dalia B Kirschbaum (NASA/GSFC)
- Thomas A. Stanley (USRA)
-
Producers
- Ryan Fitzgibbons (USRA)
- Joy Ng (USRA)
-
Technical support
- Ian Jones (ADNET Systems, Inc.)
- Laurence Schuler (ADNET Systems, Inc.)
-
Project support
- Joycelyn Thomson Jones (NASA/GSFC)
- Leann Johnson (Global Science and Technology, Inc.)
- Eric Sokolowsky (Global Science and Technology, Inc.)
Release date
This page was originally published on Monday, April 23, 2018.
This page was last updated on Wednesday, November 15, 2023 at 12:11 AM EST.
Papers used in this visualization
Dalia Kirschbaum and Thomas Stanley, Satellite-Based Assessment of Rainfall-Triggered Landslide Hazard for Situational Awareness, Earth's Future, Volume 6, Issue 3, March 2018, Pages 297-616, ISSN 2328-4277, https://doi.org/10.1002/2017EF000715
Datasets used in this visualization
-
GLC (Global Landslide Catalogue)
ID: 872
Note: While we identify the data sets used in these visualizations, we do not store any further details, nor the data sets themselves on our site.
Related
- ID: 4631
- ID: 4640
- ID: 12897
- ID: 4633
Older Versions
- ID: 11854
 Produced Video