Harmonized Landsat 8 and Sentinel-2 Data
Landsat 8 and Sentinel-2 satellites have spectral and spatial similarities that make using their data together possible. When the data are used together observations can be more timely and accurate.
The HLS project is an effort to "harmonize" the data of the two satellite programs so that they can be more easily used in unison. The ultimate goal is to obtain seamless 2-3 day global surface reflectance coverage at 30 meters that removes residual differences between the sensors due to spectral bandpass and view geometry. Currently the v1.3 HLS data set encompasses 82 global test sites that cover about 7% of the global land area.
Using the processing power of the NASA Earth Exchange (NEX) computer cluster at NASA Ames, the HLS workflow atmospherically corrects data from the satellites, geographically tiles the Landsat data in a manor matching the Sentinel-2 tiling, and then corrects for different sensor view angles (Bidirectional Reflectance Distribution Function, or BRDF) and does a slight band pass adjustment for the Sentinel-2 data to create the harmonized 30-meter product.
The HLS team includes researchers from NASA Goddard Space Flight Center, the University of Maryland, and NASA Ames Research Center.
A year of NDVI (Normalized Difference Vegetation Index) data of areas in Maryland on both sides of the Chesapeake Bay. The Patuxent River enters the Bay on the left and Taylors Island and the Blackwater National Wildlife Refuge on the right. In this visualization, red is bare soil and green indicates healthy, growing vegetation. The animation runs from January 1 to December 30, 2016.
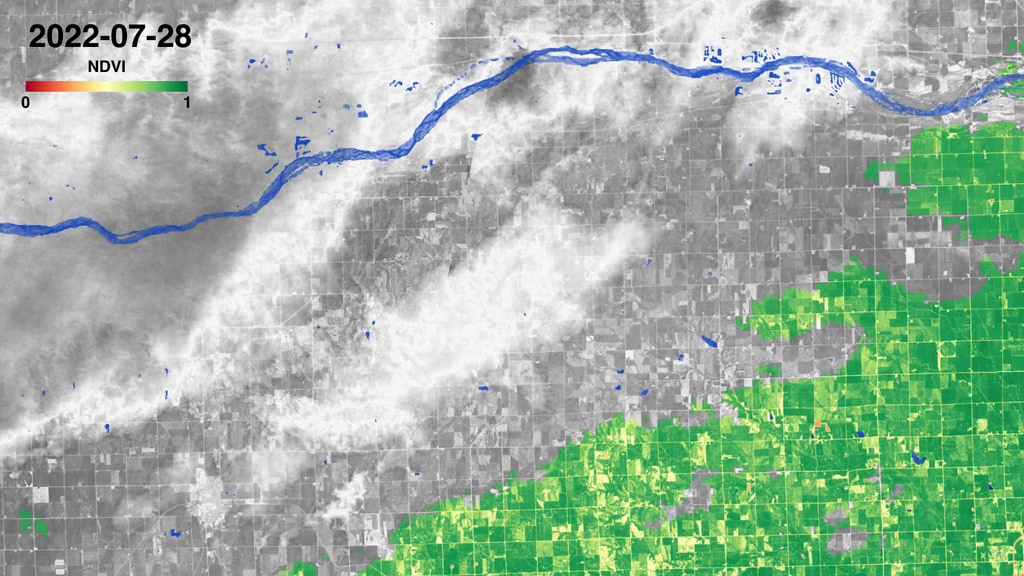
A year of NDVI (Normalized Difference Vegetation Index) data of farm fields south of Columbus, Nebraska, on the left upper edge of the video. The Platte River flows west to east along the top. David City is in the center and Shelby is in the lower left, partially obscured by the legend.
In this visualization, red is bare soil and green indicates healthy, growing vegetation. The animation runs from January 1 to December 30, 2016.
The Everglades and the Francis S. Taylor Wildlife Management Area in south Florida exist right next to urban and suburban areas, as seen in this year of NDVI (Normalized Difference Vegetation Index) data. On the right of the video are the western suburbs of Miami and Fort Lauderdale. On the left, the protected areas of freshwater swamp and wet prarie are only accessible with an airboat.
In this visualization, red is bare soil and green indicates healthy, growing vegetation. The animation runs from January 1 to December 30, 2016.
Two rivers are prominent in this year of NDVI (Normalized Difference Vegetation Index) data showing vegetation health through the seasons. The Choptank (left) is the largest river on the DelMarVa peninsula, starting in Delaware and flowing through Maryland until reaching the Chesapeake Bay. A 63-mile portion of the Nanticoke River (right) is marked as an ecotourism water trail. Farms and small towns are dotted throughout the watershed of each river.
In this visualization, red is bare soil and green indicates healthy, growing vegetation. The animation runs from January 1 to December 30, 2016.
A year of NDVI (Normalized Difference Vegetation Index) data around Cunningham, Kansas, in the center of the state. Cunningham, in the lower center of the video, is just north of U.S. Route 400 and south of the Ninnescah River. The city of Pratt is to the west and the Kingman State Fishing Lake and Wildlife Area can be seen to the east.
In this visualization, red is bare soil and green indicates healthy, growing vegetation. The animation runs from January 1 to December 30, 2016.
The yearly rhythm of the Everglades contrasts with the steady agriculture of south Florida in this year of NDVI (Normalized Difference Vegetation Index) data showing vegetation health through the seasons. Old Rhodes Key and Elliot Key are in the lower right. Homestead, the second oldest city in Miami-Dade County, is a major source of indoor plants for offices. The Homestead Air Reserve Base is visible in the center right of the video. Biscayne National Park, encompassing the coastal areas and keys, is visible by its vibrant green color throughout the year.
In this visualization, red is bare soil and green indicates healthy, growing vegetation. The animation runs from January 1 to December 30, 2016.
A year of NDVI (Normalized Difference Vegetation Index) data of farm fields in eastern Nebraska. Branched Oak Lake, within Branched Oak State Recreation Area, is at the bottom of the screen. Lake Wanahoo is in the upper right, just north of the city of Wahoo, and the just barely visible Wahoo Municipal Airport is to the right of the lake. David City is in the upper center.
In this visualization, red is bare soil and green indicates healthy, growing vegetation. The animation runs from January 1 to December 30, 2016.
Scale bar and dates for Harmonized Landsat 8 Sentinel-2 data, Jan. 1 2016 to Dec. 30, 2016.
For More Information
Credits
Please give credit for this item to:
NASA's Goddard Space Flight Center
-
Animator
- Mike Taylor (SSAI)
-
Producer
- Matthew R. Radcliff (USRA)
-
Scientist
- Jeffrey Masek (NASA/GSFC)
-
Writer
- Laura Rocchio (SSAI)
Release date
This page was originally published on Monday, March 19, 2018.
This page was last updated on Sunday, February 25, 2024 at 12:18 AM EST.
Missions
This visualization is related to the following missions:Related
- ID: 31267
 Hyperwall Visual