Global Landslide Catalog (update 2019)

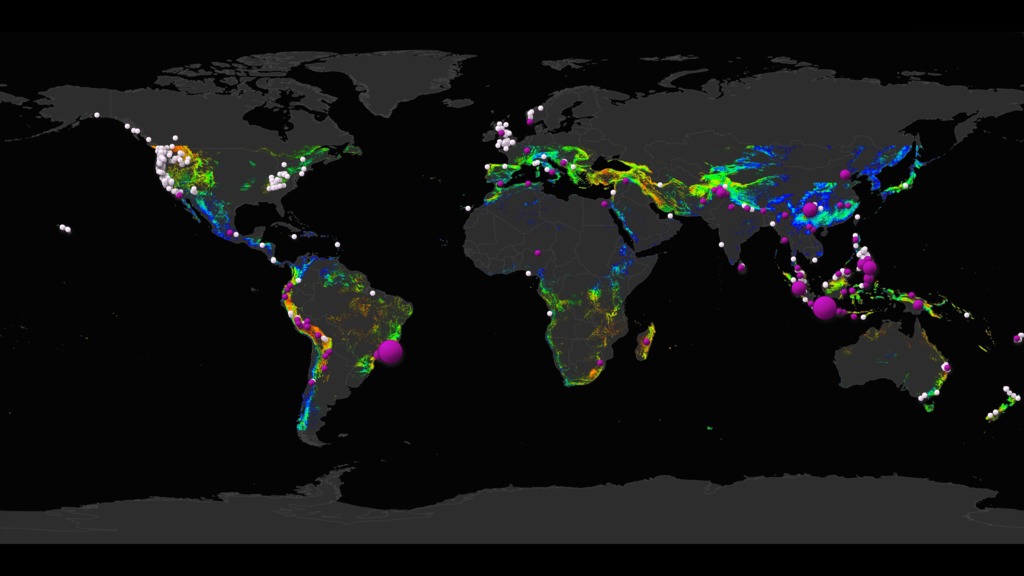
Using the Global Landslide Catalog (GLC), a world map has been produced to show the location of 11,033 reported landslides triggered by rainfall for the period 2007-2019 (last update 02.29.19). In this version, all landslide locations have the same visual treatment without pointing out which ones had fatalities. This version has been created for kids and educational purposes.
Landslides occur when an environmental trigger like an extreme rain event, often a severe storm or hurricane, and gravity's downward pull sets soil and rock in motion. Conditions beneath the surface are often unstable already, so the heavy rains act as the last straw that causes mud, rocks, or debris- or all combined- to move rapidly down mountains and hillsides. Unfortunately, people and property are often swept up in these unexpected mass movements. Landslides can also be caused by earthquakes, surface freezing and thawing, ice melt, the collapse of groundwater reservoirs, volcanic eruptions, and erosion at the base of a slope from the flow of river or ocean water. But torrential rains most commonly activate landslides.
The Global Landslide Catalog (GLC) was developed with the goal of identifying rainfall-triggered landslide events around the world, regardless of size, impact, or location. The GLC considers all types of mass movements triggered by rainfall, which have been reported in the media, disaster databases, scientific reports, or other sources. The GLC has been compiled since 2007 at NASA Goddard Space Flight Center and contains over 11,000 reports and growing. A new project called the Community the Cooperative Open Online Landslide Repository, or COOLR, provides the opportunity for the community to view landslide reports and contribute their own. The goal of the COOLR project is to create the largest global public online landslide catalog available and open to for anyone everyone to share, download, and analyze landslide information.
This visualization shows the locations of landslides during the period 2007-2019 (as of 03.11.19), as reported in the GLC. In this version all landslide locations have the same visual treatment without pointing out which ones had fatalities. It has been developed for kids and educational purposes.
More information on this system is available at: https://landslides.nasa.gov
The Global Landslide Catalog is currently available here: https://catalog.data.gov/dataset/global-landslide-catalog-export
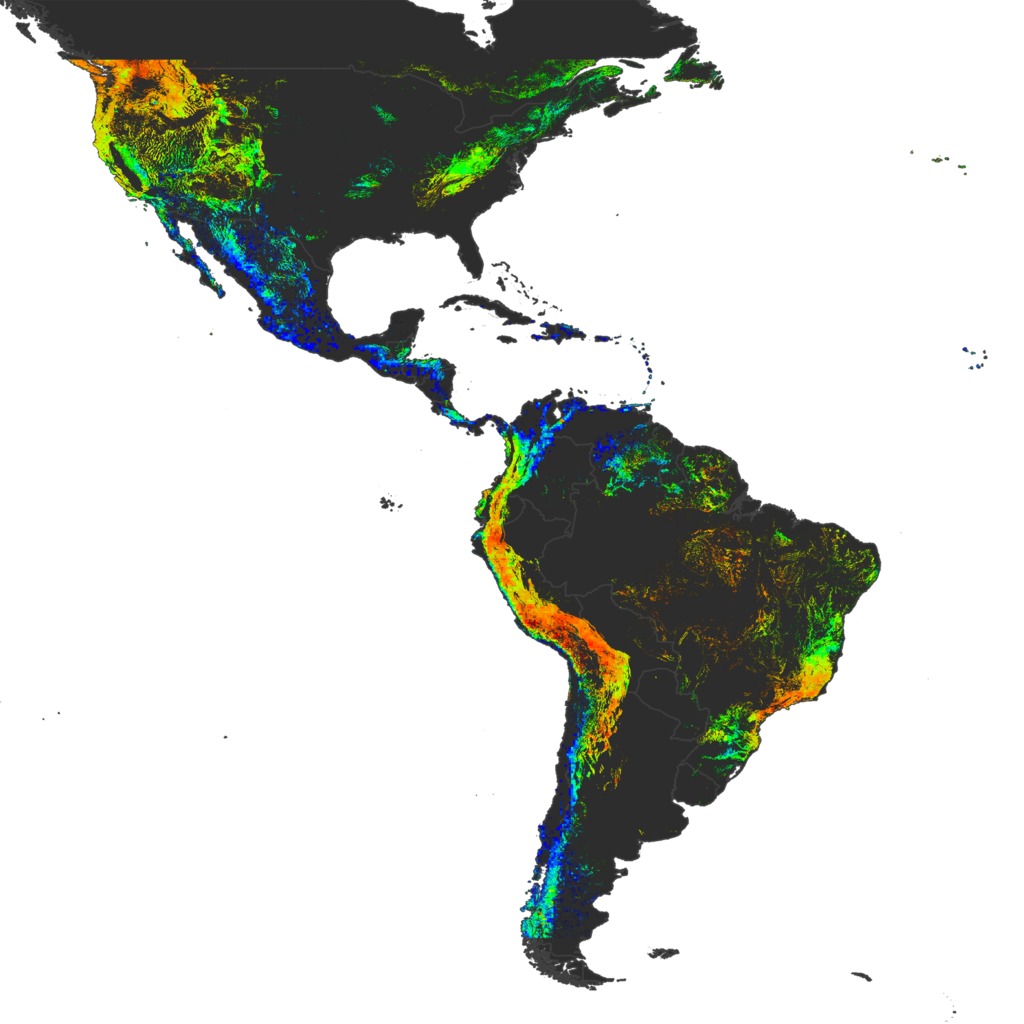
This image can serve as a layer and contains all 11,033 landslide locations with a transparent background.
Using the Global Landslide Catalog (GLC), a map has been produced to show the location of 11,033 reported landslides triggered by rainfall for the period 2007-2019 (last update 02.28.19). In this version, all landslide locations use the same visual treatment without pointing out which ones had fatalities. This version has been created for kids and educational purposes.

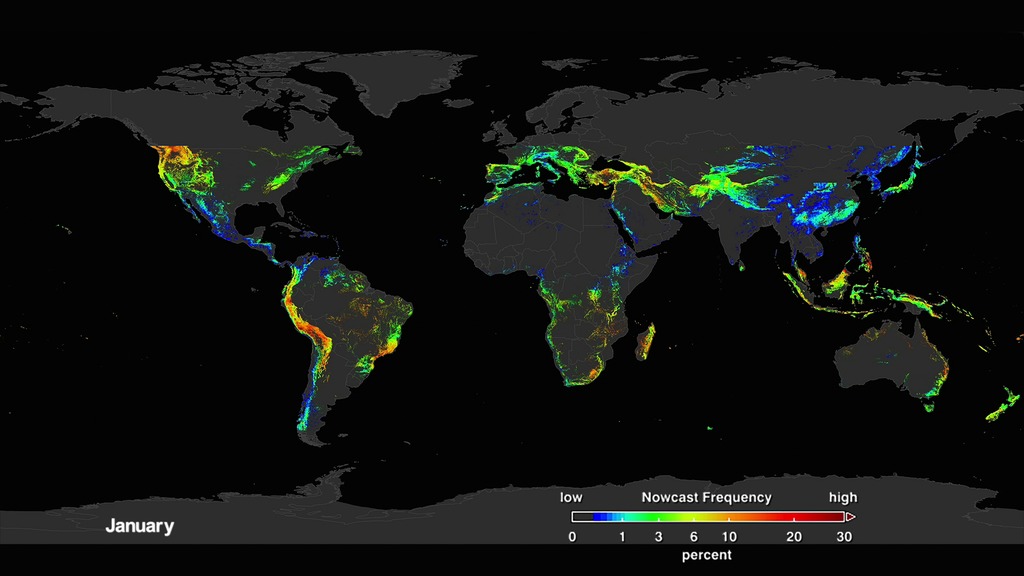
World flat map to serve as a background when overlaying the image with transparency provided above.
For More Information
See the following sources:
Credits
Please give credit for this item to:
NASA's Scientific Visualization Studio
-
Visualizer
- Helen-Nicole Kostis (USRA)
-
Scientist
- Dalia B Kirschbaum (NASA/GSFC)
-
Technical support
- Laurence Schuler (ADNET Systems, Inc.)
- Ian Jones (ADNET Systems, Inc.)
-
Project support
- Leann Johnson (Global Science and Technology, Inc.)
Release date
This page was originally published on Wednesday, March 13, 2019.
This page was last updated on Wednesday, May 3, 2023 at 1:46 PM EDT.
Datasets used in this visualization
-
GLC (Global Landslide Catalogue)
ID: 872
Note: While we identify the data sets used in these visualizations, we do not store any further details, nor the data sets themselves on our site.
Related
- ID: 4631
- ID: 4640
- ID: 12897
- ID: 4633