Gigantic Wave Discovered in Perseus Galaxy Cluster
A wave spanning 200,000 light-years is rolling through the Perseus galaxy cluster, according to observations from NASA's Chandra X-ray Observatory coupled with a computer simulation. The simulation shows the gravitational disturbance resulting from the distant flyby of a galaxy cluster about a tenth the mass of the Perseus cluster. The event causes cooler gas at the heart of the Perseus cluster to form a vast expanding spiral, which ultimately forms giant waves lasting hundreds of millions of years at its periphery. Merger events like this are thought to occur as often as every three to four billion years in clusters like Perseus.
Credit: NASA's Goddard Space Flight Center
Music: "The Undiscovered" from Killer Tracks
Watch this video on the NASA Goddard YouTube channel.
Complete transcript available.
Combining data from NASA's Chandra X-ray Observatory with radio observations and computer simulations, an international team of scientists has discovered a vast wave of hot gas in the nearby Perseus galaxy cluster. Spanning some 200,000 light-years, the wave is about twice the size of our own Milky Way galaxy.
The researchers say the wave formed billions of years ago, after a small galaxy cluster grazed Perseus and caused its vast supply of gas to slosh around an enormous volume of space.
Galaxy clusters are the largest structures bound by gravity in the universe today. Some 11 million light-years across and located about 240 million light-years away, the Perseus galaxy cluster is named for its host constellation. Like all galaxy clusters, most of its observable matter takes the form of a pervasive gas averaging tens of millions of degrees, so hot it only glows in X-rays.
Chandra observations have revealed a variety of structures in this gas, from vast bubbles blown by the supermassive black hole in the cluster's central galaxy, NGC 1275, to an enigmatic concave feature known as the "bay."
To investigate the bay, researchers combined a total of 10.4 days of high-resolution data with 5.8 days of wide-field observations at energies between 700 and 7,000 electron volts. For comparison, visible light has energies between about two and three electron volts. The scientists then filtered the Chandra data to highlight the edges of structures and reveal subtle details. Next, they compared the edge-enhanced Perseus image to computer simulations of merging galaxy clusters run on the Pleiades supercomputer at NASA's Ames Research Center.
One simulation seemed to explain the formation of the bay. In it, gas in a large cluster similar to Perseus has settled into two components, a "cold" central region with temperatures around 54 million degrees Fahrenheit (30 million Celsius) and a surrounding zone where the gas is three times hotter. Then a small galaxy cluster containing about a thousand times the mass of the Milky Way skirts the larger cluster, missing its center by around 650,000 light-years.
The flyby creates a gravitational disturbance that churns up the gas like cream stirred into coffee, creating an expanding spiral of cold gas. After about 2.5 billion years, when the gas has risen nearly 500,000 light-years from the center, vast waves form and roll at its periphery for hundreds of millions of years before dissipating.
These waves are giant versions of Kelvin-Helmholtz waves, which show up wherever there's a velocity difference across the interface of two fluids, such as wind blowing over water. They can be found in the ocean, in cloud formations on Earth and other planets, in plasma near Earth, and even on the sun.
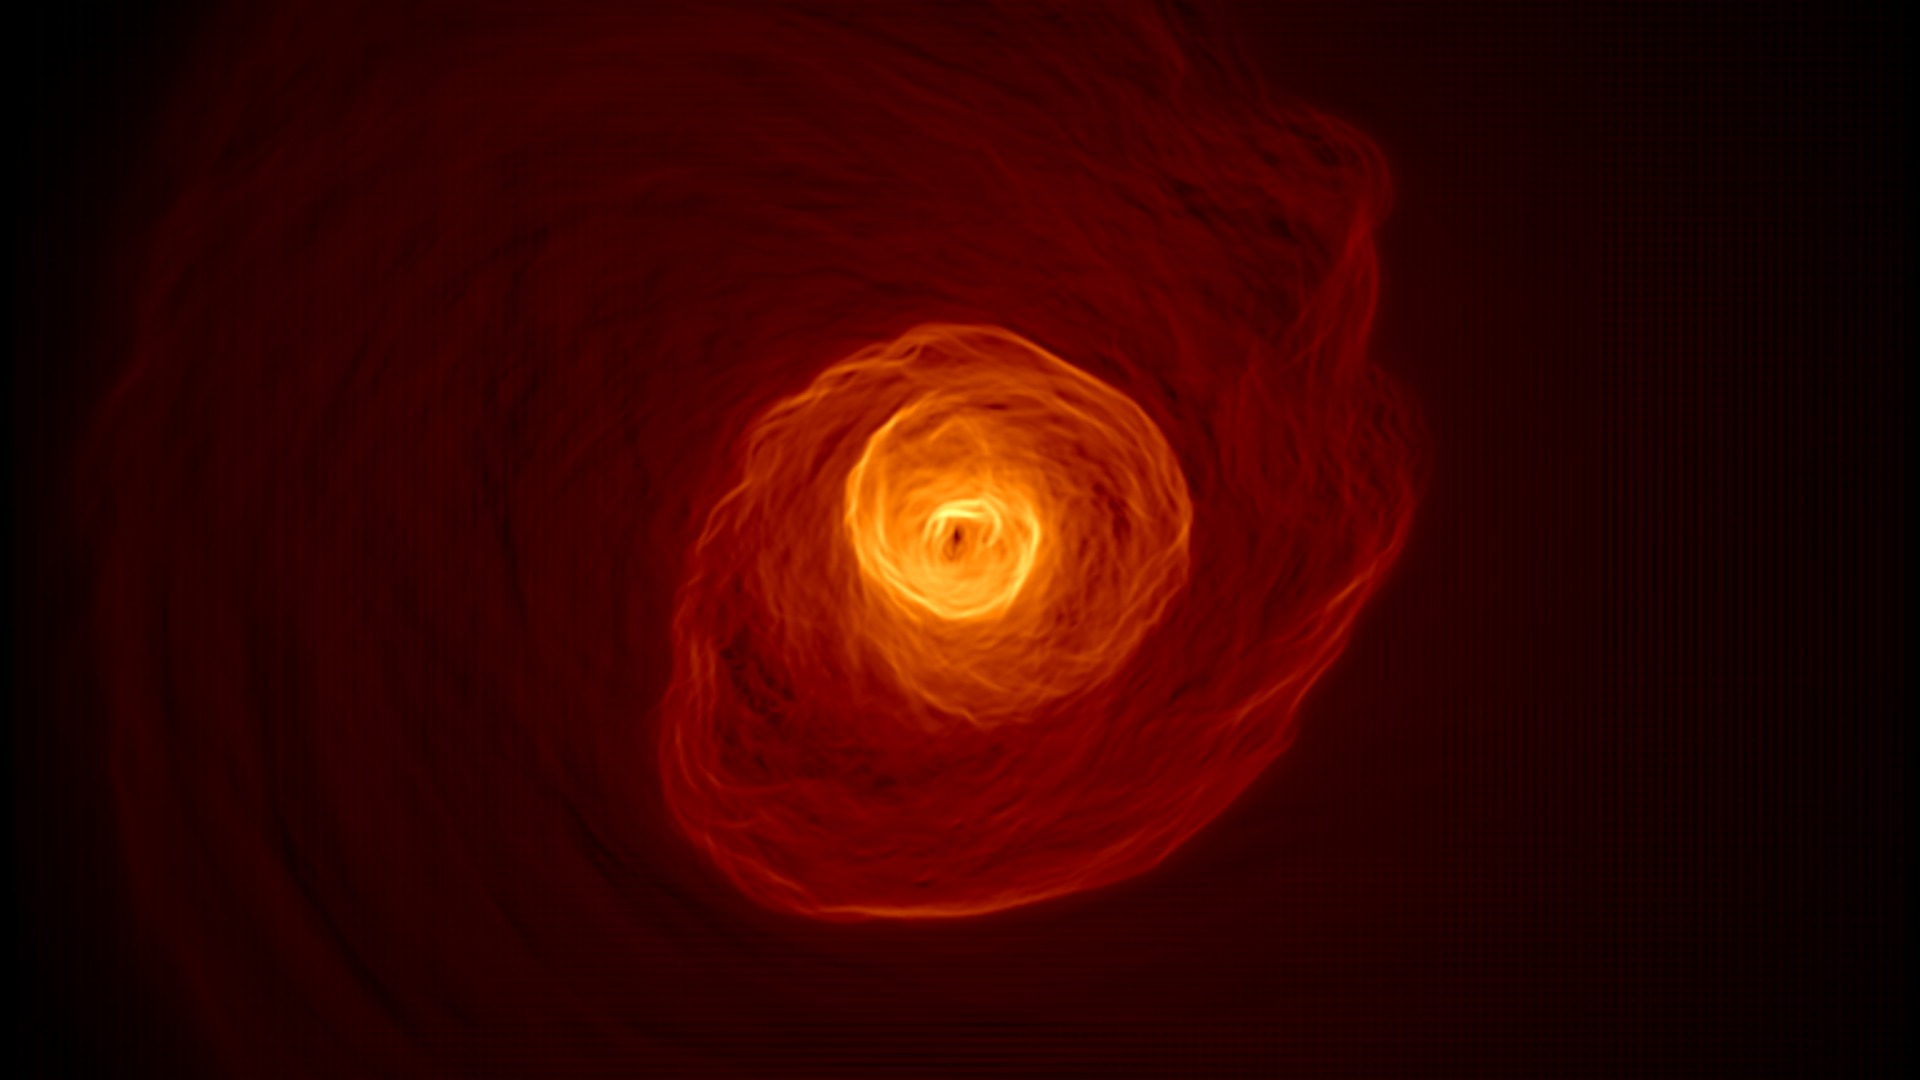
This simulation, developed by John ZuHone at the Harvard-Smithsonian Center for Astrophysics, begins with an X-ray view of hot gas at the heart of a galaxy cluster much like the Perseus cluster. The gas has settled into two components, a "cold" central region with temperatures around 54 million degrees Fahrenheit (30 million Celsius) surrounded by gas some three times hotter. About 1.5 billion years into the simulation, a small galaxy cluster with about one-tenth the mass of Perseus passes about 650,000 light-years out of frame. Although we don’t see this cluster, a shock wave excited in the gas by its passage swiftly moves from right to left across the scene. The gravity of the flyby cluster causes the colder gas to slosh around, forming a spiral pattern that expands into the hotter gas. About 2.5 billion years after the flyby's closest approach, cold gas has risen some 500,000 light-years from the center. This leads to a velocity shear between the cold gas and the surrounding hotter gas, resulting in huge versions of Kelvin-Helmholtz waves (upper right at about 2 o'clock). These waves last hundreds of millions of years before dissipating. This simulation was performed on the Pleiades supercomputer operated by the NASA Advanced Supercomputing Division at Ames Research Center in Silicon Valley, California.
Credit: John ZuHone/Harvard-Smithsonian Center for Astrophysics
Same as above, with elapsed time.
Credit: John ZuHone/Harvard-Smithsonian Center for Astrophysics
GIF of above simulation, no labels.
Credit: John ZuHone/Harvard-Smithsonian Center for Astrophysics.

This animation dissolves between two different views of hot gas in the Perseus galaxy cluster. The first is Chandra's best view of hot gas in the central region of the Perseus cluster, where red, green, and blue indicate lower-energy to higher-energy X-rays, respectively. The larger image incorporates additional data over a wider field of view. It has been specially processed to enhance the contrast of edges, revealing subtle structures in the gas. The wave is marked by the upward-arcing curve near the bottom, centered at about 7 o'clock.
Credit: NASA/CXC/SAO/E.Bulbul, et al. and NASA's Goddard Space Flight Center/Stephen Walker et al.
This X-ray image of the hot gas in the Perseus galaxy cluster was made from 16 days of Chandra observations. Researchers then filtered the data in a way that brightened the contrast of edges in order to make subtle details more obvious. An oval highlights the location of an enormous wave found to be rolling through the gas.
Credit: NASA's Goddard Space Flight Center/Stephen Walker et al.
Unlabeled version of the above.
Credit: NASA's Goddard Space Flight Center/Stephen Walker et al.
This X-ray image of the hot gas in the Perseus galaxy cluster was made from 16 days of Chandra observations. Researchers then filtered the data in a way that brightened the contrast of edges in order to make subtle details more obvious. An oval highlights the location of an enormous wave found to be rolling through the gas.
Credit: NASA's Goddard Space Flight Center/Stephen Walker et al.
This X-ray image of the hot gas in the Perseus galaxy cluster was made from 16 days of Chandra observations. Researchers then filtered the data in a way that brightened the contrast of edges in order to make subtle details more obvious. The upward-arcing curve near the bottom, centered at about 7 o'clock, is an enormous wave rolling through the cluster.
Credit: NASA's Goddard Space Flight Center/Stephen Walker et al.
Unlabeled version of the above.
Credit: NASA's Goddard Space Flight Center/Stephen Walker et al.
For More Information
Credits
Please give credit for this item to:
NASA's Goddard Space Flight Center. However, individual items should be credited as indicated above.
-
Producer
- Scott Wiessinger (USRA)
-
Science writer
- Francis Reddy (Syneren Technologies)
-
Scientist
- Stephen A. Walker (USRA)
-
Visualizer
- John ZuHone (Harvard-Smithsonian Center for Astrophysics)
-
Graphics
- Francis Reddy (University of Maryland College Park)
Release date
This page was originally published on Tuesday, May 2, 2017.
This page was last updated on Wednesday, November 15, 2023 at 12:22 AM EST.
Missions
This visualization is related to the following missions:Series
This visualization can be found in the following series:Related
- ID: 12297
 Produced Video
 - ID: 10536
 Produced Video
Used as a Source In
- ID: 12659
 Produced Video