A newer version of this visualization is available.
Greenland Ice Loss 2002-2016
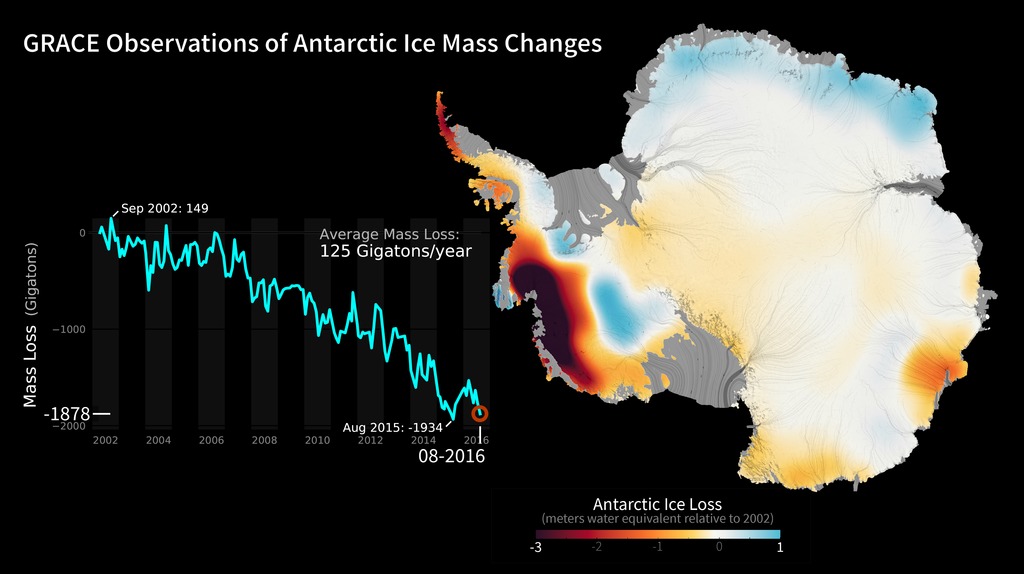
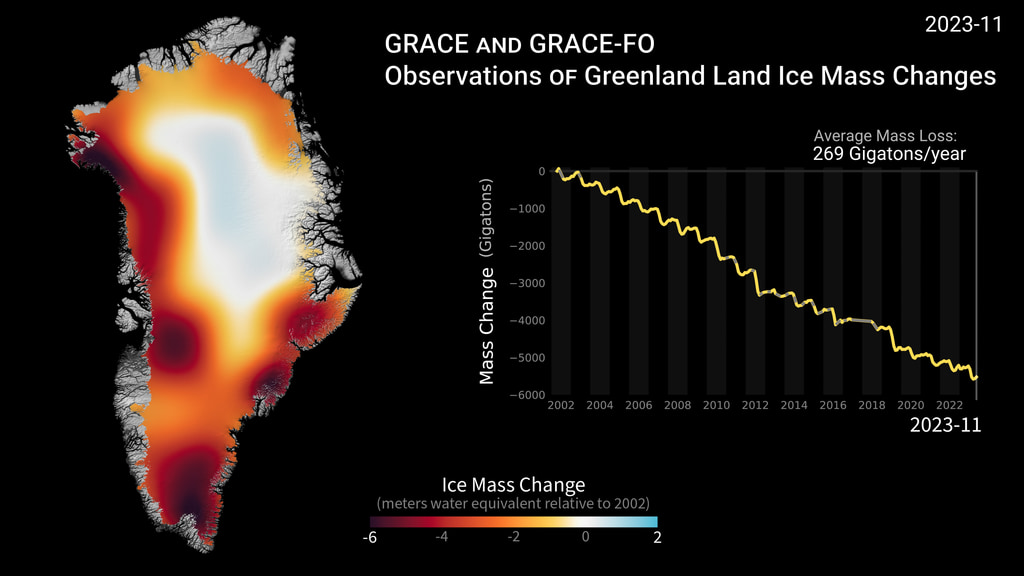
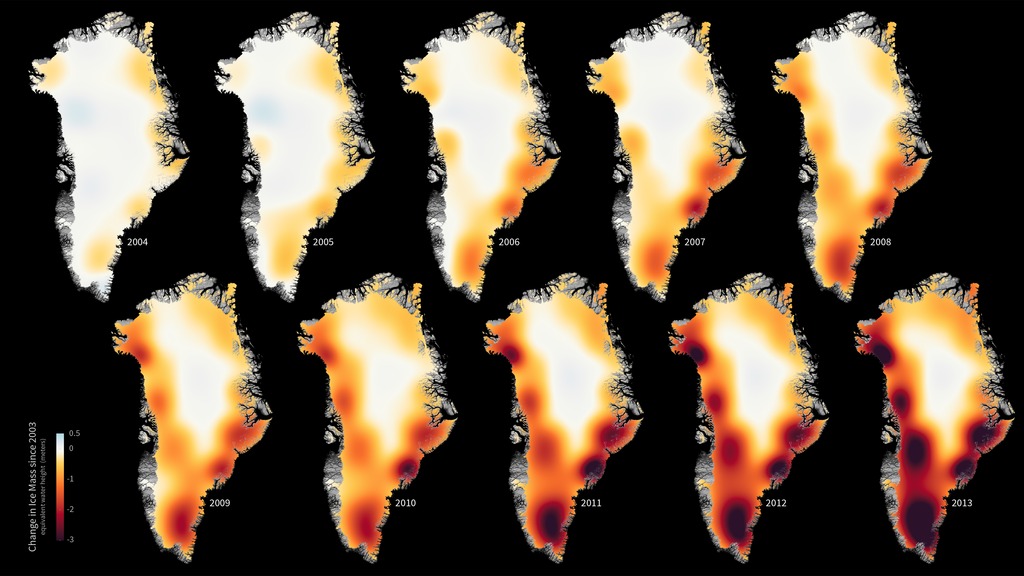
The mass of the Greenland ice sheet has rapidly declined in the last several years due to surface melting and iceberg calving. Research based on observations from the NASA/German Aerospace Center’s twin Gravity Recovery and Climate Experiment (GRACE) satellites indicates that between 2002 and 2016, Greenland shed approximately 280 gigatons of ice per year, causing global sea level to rise by 0.03 inches (0.8 millimeters) per year. These images, created from GRACE data, show changes in Greenland ice mass since 2002. Orange and red shades indicate areas that lost ice mass, while light blue shades indicate areas that gained ice mass. White indicates areas where there has been very little or no change in ice mass since 2002. In general, higher-elevation areas near the center of Greenland experienced little to no change, while lower-elevation and coastal areas experienced up to 13.1 feet (4 meters) of ice mass loss (expressed in equivalent-water-height; dark red) over a 14-year period. The largest mass decreases of up to 11.8 inches (30 centimeters (equivalent-water-height) per year occurred along the West Greenland coast. The average flow lines (grey; created from satellite radar interferometry) of Greenland’s ice converge into the locations of prominent outlet glaciers, and coincide with areas of high mass loss.
Greenland Ice Loss as measured by GRACE
GRACE Greenland ice loss on a white background.
For More Information
Credits
Please give credit for this item to:
NASA
-
Scientist
- Felix W. Landerer (NASA/JPL CalTech)
-
Animator
Release date
This page was originally published on Tuesday, May 2, 2017.
This page was last updated on Wednesday, November 15, 2023 at 12:38 AM EST.
Missions
This visualization is related to the following missions:Datasets used in this visualization
-
[Gravity Recovery and Climate Experiment (GRACE)]
ID: 221
Note: While we identify the data sets used in these visualizations, we do not store any further details, nor the data sets themselves on our site.
Related
- ID: 30880
 Hyperwall Visual
Newer Versions
- ID: 31156
 Hyperwall Visual
Older Versions
- ID: 30478
 Hyperwall Visual