Earth
Sun
Planets and Moons
ID: 5124
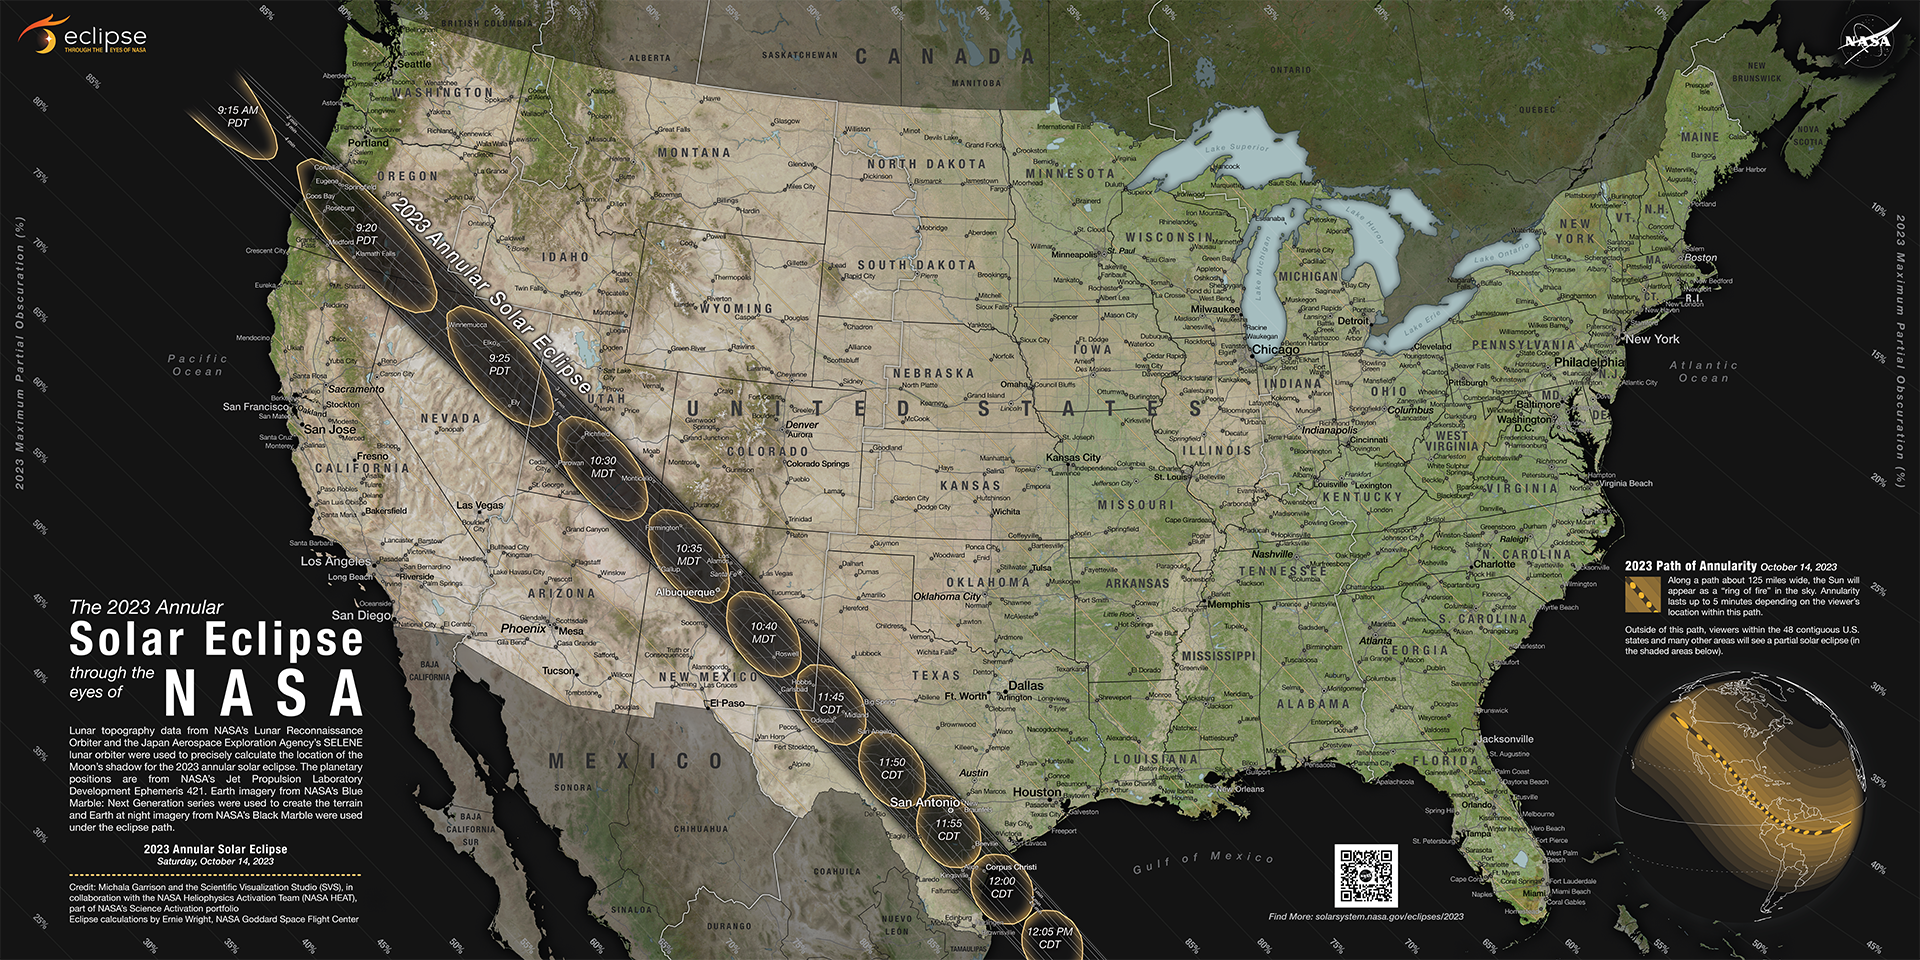
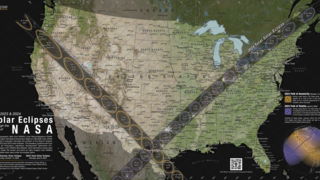
This map illustrates the paths of the Moon’s shadow across the U.S. during the 2023 annular solar eclipse. On October 14, 2023, an annular solar eclipse will cross North, Central, and South America creating a path of annularity. An annular solar eclipse occurs when the Moon passes between the Sun and Earth while at its farthest point from Earth. Because the Moon is farther away from Earth, it does not completely block the Sun. This will create a “ring of fire” effect in the sky for those standing in the path of annularity.
Also within the dark paths are duration contours. These delineate the length of time annularity will last. The closer to the center of the solar eclipse path, the longer it will last. For the annular path, times range from a few seconds on the outer edge to a maximum of around 4.5 minutes in the center.
Outside the eclipse path, the map displays contours of obscuration, or percentage of the Sun’s area covered by the Moon. Readers can trace the lines to percentages printed along all sides of the map that range from 85% to 10% obscuration. The dark path marks when 90% obscuration begins.
The .zip file above contains the following files:

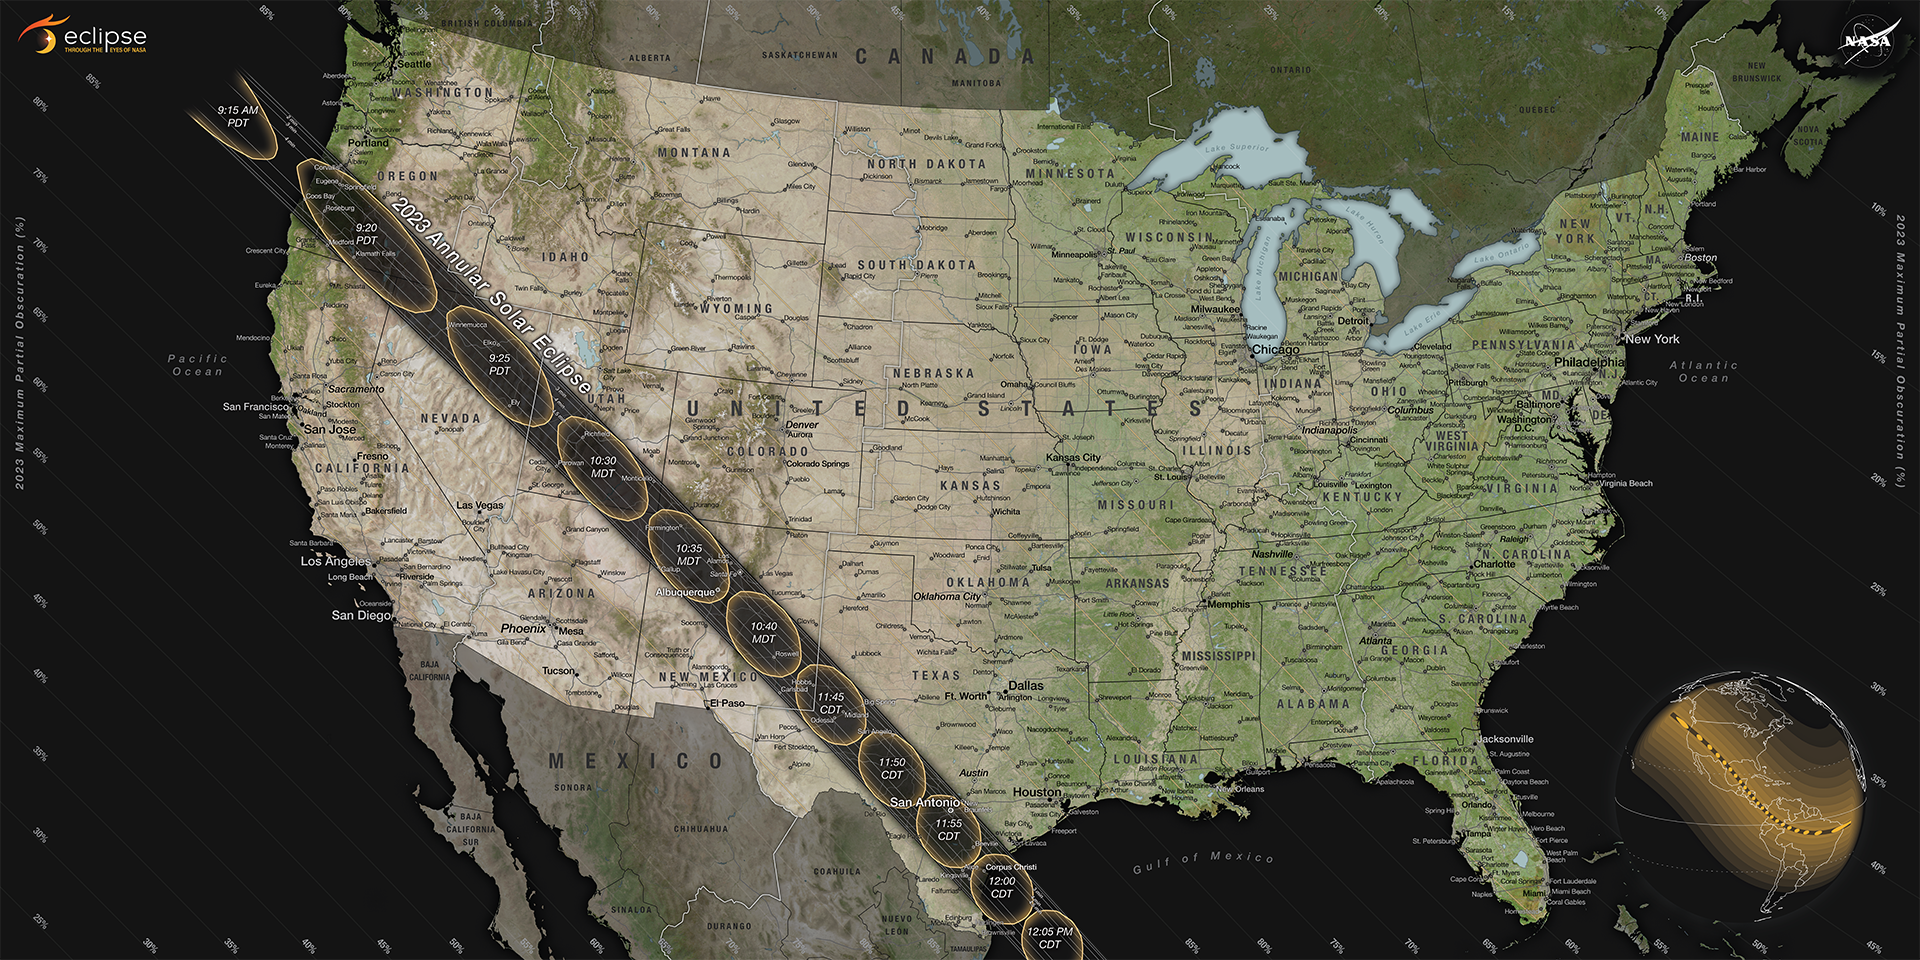
The 2023 Annular Solar Eclipse

Making the Map
This map uses datasets from several NASA missions. The eclipse data were calculated by visualizer Ernie Wright using elevation information from SRTM, lunar topography from LRO, and planetary positions from the JPL DE421 ephemeris. The lead visualizer, Michala Garrison, used Earth imagery from NASA’s Blue Marble Next Generation to create the terrain map.Reading the Map
The dark path across the map is where the largest area of the Sun will be covered by the Moon. People in these paths will experience an annular solar eclipse. Inside the dark eclipse path are irregular ovals that delineate the Moon’s shadow on the Earth’s surface. For an annular solar eclipse, these ovals are called the antumbra and together make up the path of annularity. On the map, the ovals contain times inside corresponding to the shape of the Moon’s shadow cast at that time during the eclipse.Also within the dark paths are duration contours. These delineate the length of time annularity will last. The closer to the center of the solar eclipse path, the longer it will last. For the annular path, times range from a few seconds on the outer edge to a maximum of around 4.5 minutes in the center.
Outside the eclipse path, the map displays contours of obscuration, or percentage of the Sun’s area covered by the Moon. Readers can trace the lines to percentages printed along all sides of the map that range from 85% to 10% obscuration. The dark path marks when 90% obscuration begins.
Download Eclipse Data
2023 Annular Eclipse Data: 2023eclipse_shapefiles.zipThe .zip file above contains the following files:
- center.shp A high-resolution polyline tracing the path of the shadow center. Region limited.
- duration.shp Isocontours of maximum annular duration, at 30-second intervals.
- ppath.shp “Penumbra path,” contours of maximum partial obscuration (area of the Sun covered by the Moon) at 5% intervals.
- ppath01.shp “Penumbra path,” contours of maximum partial obscuration (area of the Sun covered by the Moon) at 1% intervals.
- umbra_hi.shp High resolution antumbra polygons, at 1-second intervals. Region limited.
- umbra_lo.shp Lower resolution antumbra polygons, at 10-second intervals. Global.
- upath_hi.shp High resolution path shape. Region limited.
- upath_lo.shp Lower resolution path shape. Global.
More Map Versions


Source Material
Related
Visualization Credits
Michala Garrison (SSAI): Lead Visualizer
Laurence Schuler (ADNET Systems, Inc.): Technical Support
Ian Jones (ADNET Systems, Inc.): Technical Support
Ernie Wright (USRA): Visualizer
Laurence Schuler (ADNET Systems, Inc.): Technical Support
Ian Jones (ADNET Systems, Inc.): Technical Support
Ernie Wright (USRA): Visualizer
Please give credit for this item to:
NASA's Scientific Visualization Studio
NASA's Scientific Visualization Studio
Short URL to share this page:
https://svs.gsfc.nasa.gov/5124
Data Used:
Note: While we identify the data sets used in these visualizations, we do not store any further details nor the data sets themselves on our site.
Keywords:
SVS >> Solar Eclipse
SVS >> Hyperwall
SVS >> Eclipse
NASA Science >> Earth
NASA Science >> Sun
NASA Science >> Planets and Moons
SVS >> Annular Solar Eclipse
https://svs.gsfc.nasa.gov/5124
Data Used:
SRTM/SIR-C/DEM
Terra and Aqua/MODIS/Blue Marble Land Cover
Credit:
The Blue Marble data is courtesy of Reto Stockli (NASA/GSFC).
The Blue Marble data is courtesy of Reto Stockli (NASA/GSFC).
JPL DE421 also referred to as: DE421
Ephemeris - NASA/JPL
Planetary ephemerides
Suomi NPP/VIIRS/Black Marble: Next Generation also referred to as: Black Marble
NASA/NOAA
Earth at night imagery
Credit:
NASA Earth Observatory images by Joshua Stevens, using Suomi NPP VIIRS data from Miguel Román, NASA GSFC.
NASA Earth Observatory images by Joshua Stevens, using Suomi NPP VIIRS data from Miguel Román, NASA GSFC.
Keywords:
SVS >> Solar Eclipse
SVS >> Hyperwall
SVS >> Eclipse
NASA Science >> Earth
NASA Science >> Sun
NASA Science >> Planets and Moons
SVS >> Annular Solar Eclipse
