The 2023 and 2024 Solar Eclipses: Map and Data
The map was updated on March 15, 2023, to correct times in Mexico along the total eclipse path.
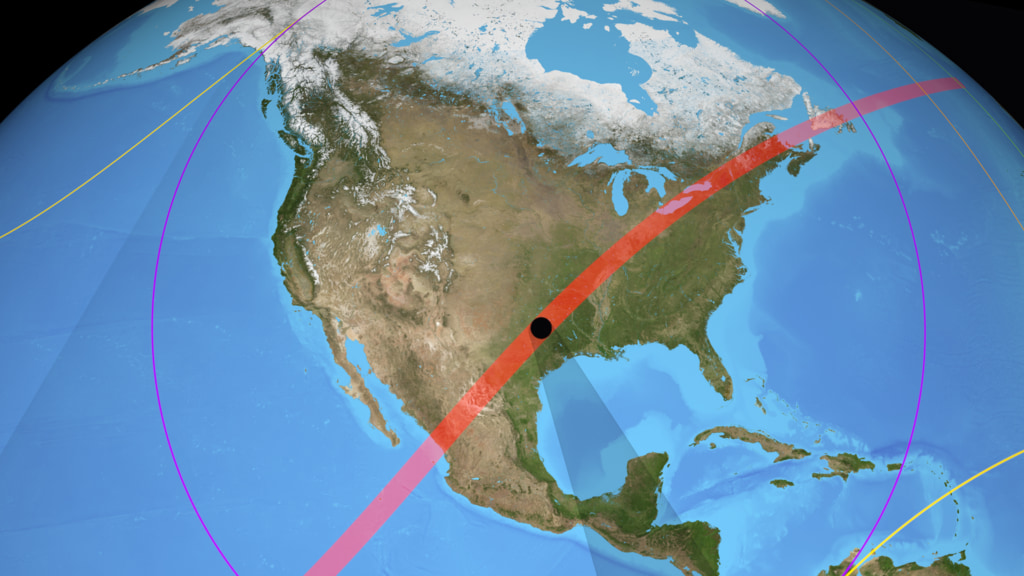
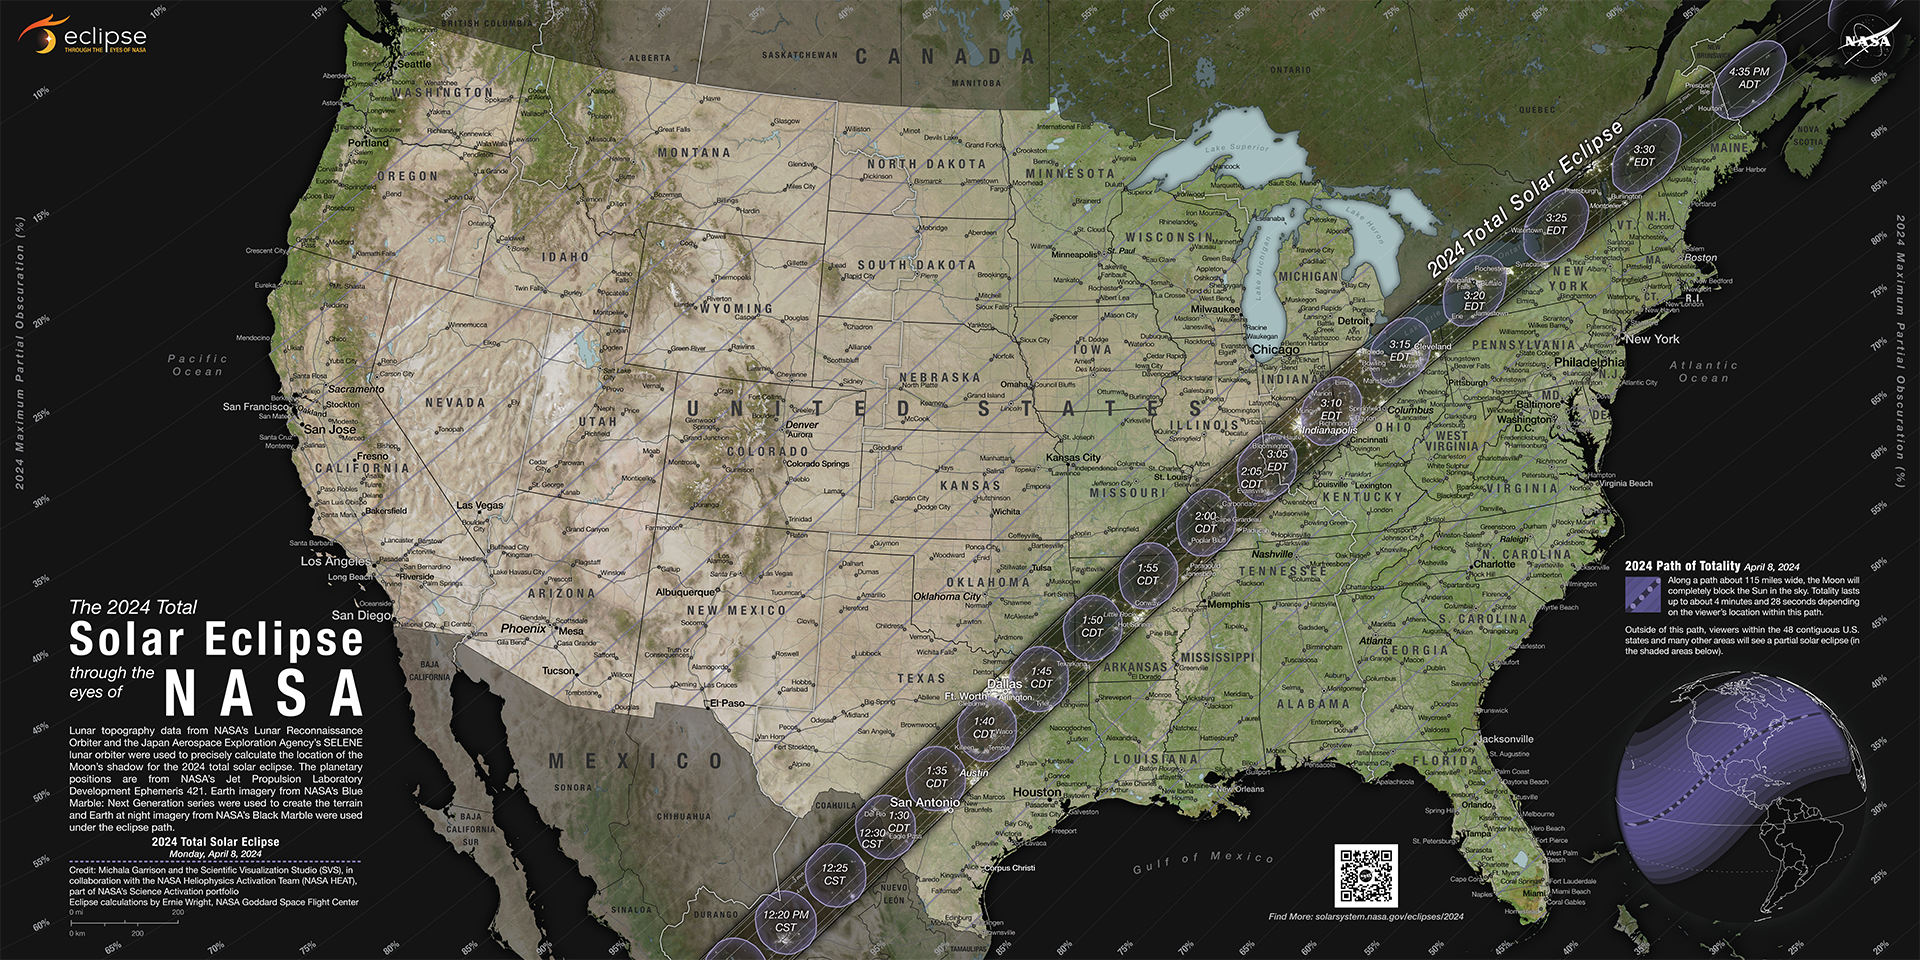
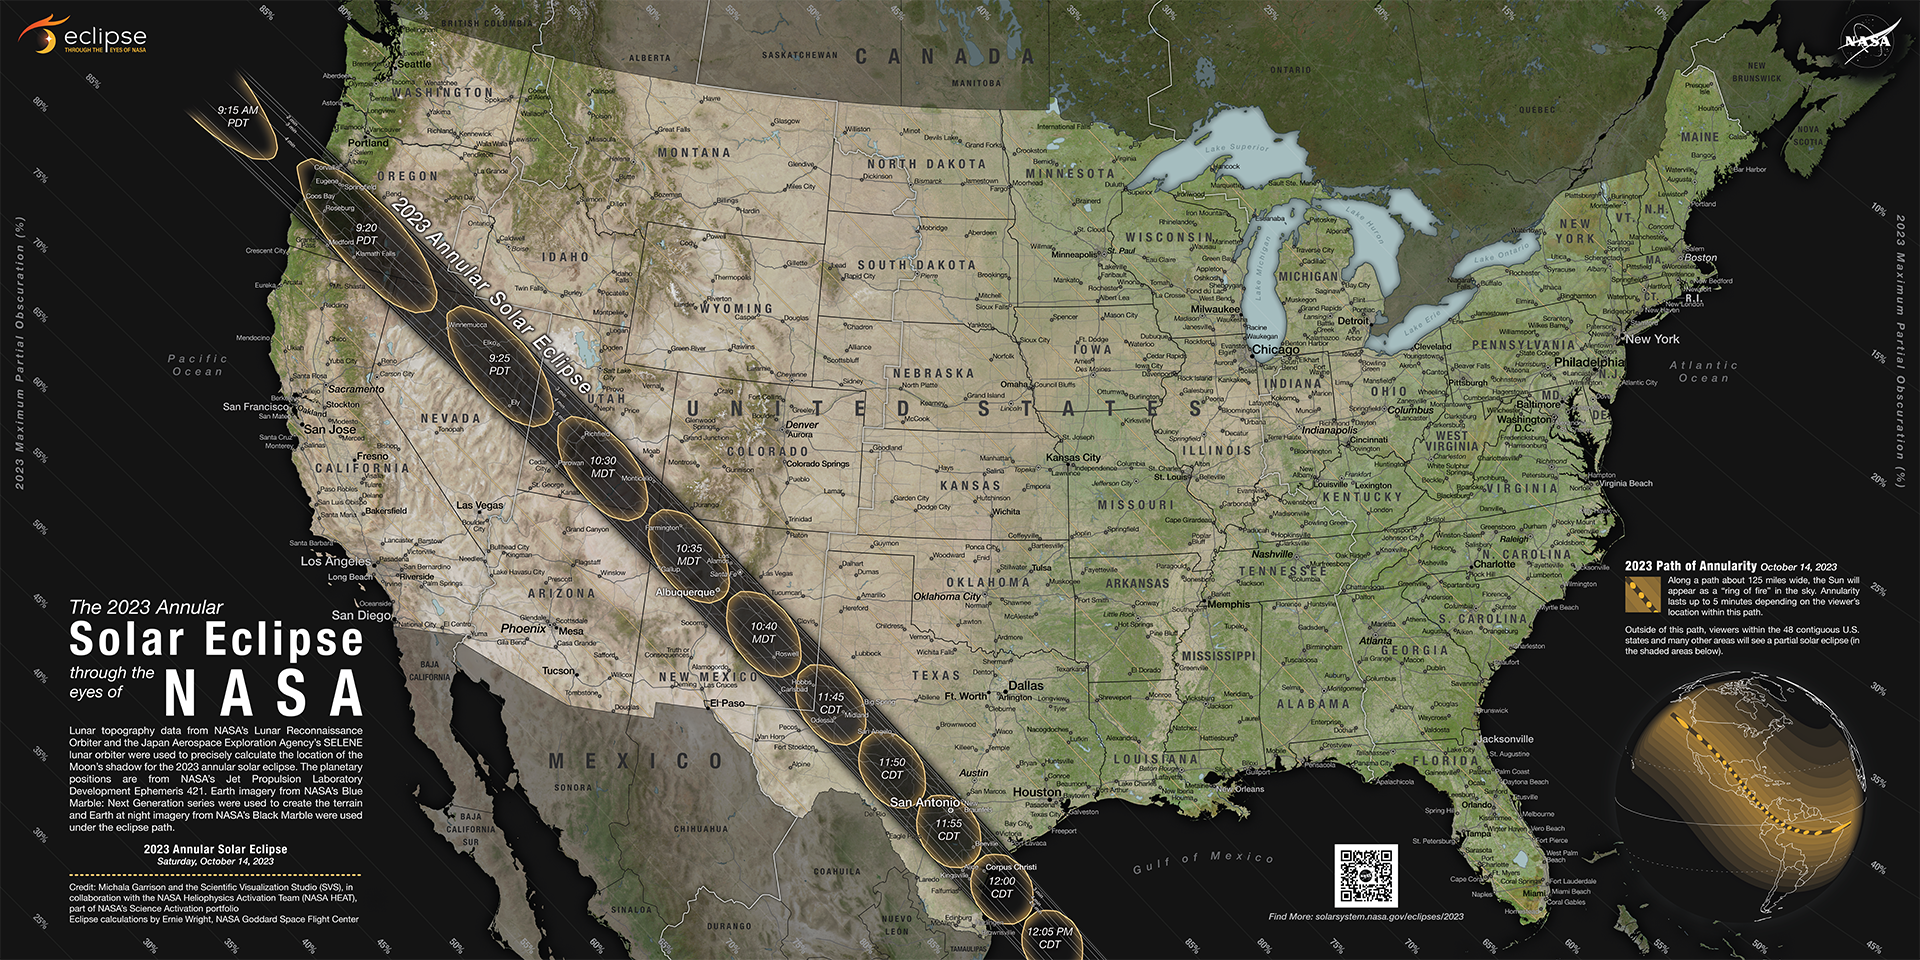
A map showing where the Moon’s shadow will cross the U.S. during the 2023 annular solar eclipse and 2024 total solar eclipse. Available at 5400 x 2700, 10,800 x 5400, and 22,500 x 11,250.
This map illustrates the paths of the Moon’s shadow across the U.S. during two upcoming solar eclipses. On October 14, 2023, an annular solar eclipse will cross North, Central, and South America creating a path of annularity. An annular solar eclipse occurs when the Moon passes between the Sun and Earth while at its farthest point from Earth. Because the Moon is farther away from Earth, it does not completely block the Sun. This will create a “ring of fire” effect in the sky for those standing in the path of annularity. On April 8, 2024, a total solar eclipse will cross North and Central America creating a path of totality. During a total solar eclipse, the Moon completely blocks the Sun while it passes between the Sun and Earth. The sky will darken as if it were dawn or dusk and those standing in the path of totality may see the Sun’s outer atmosphere (the corona) if weather permits.
Making the Map
This map uses datasets from several NASA missions. The eclipse data were calculated by visualizer Ernie Wright using elevation information from SRTM, lunar topography from LRO, and planetary positions from the JPL DE421 ephemeris. The lead visualizer, Michala Garrison, used Earth imagery from NASA’s Blue Marble Next Generation to create the terrain map. Likewise, nighttime Earth imagery from NASA’s Black Marble were used along the path of the 2024 total solar eclipse.Reading the Map
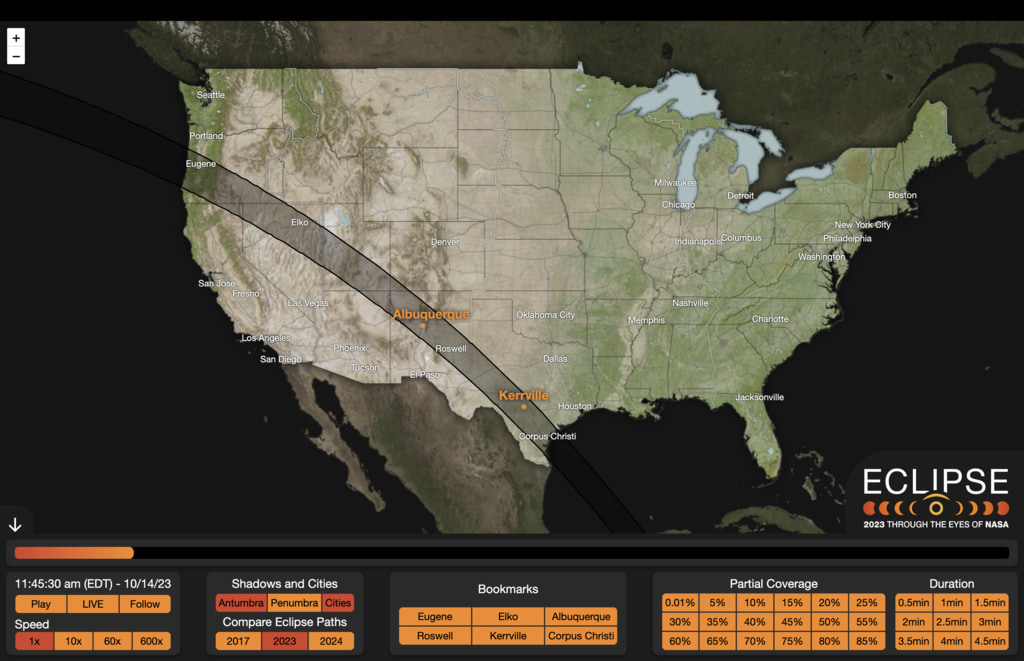
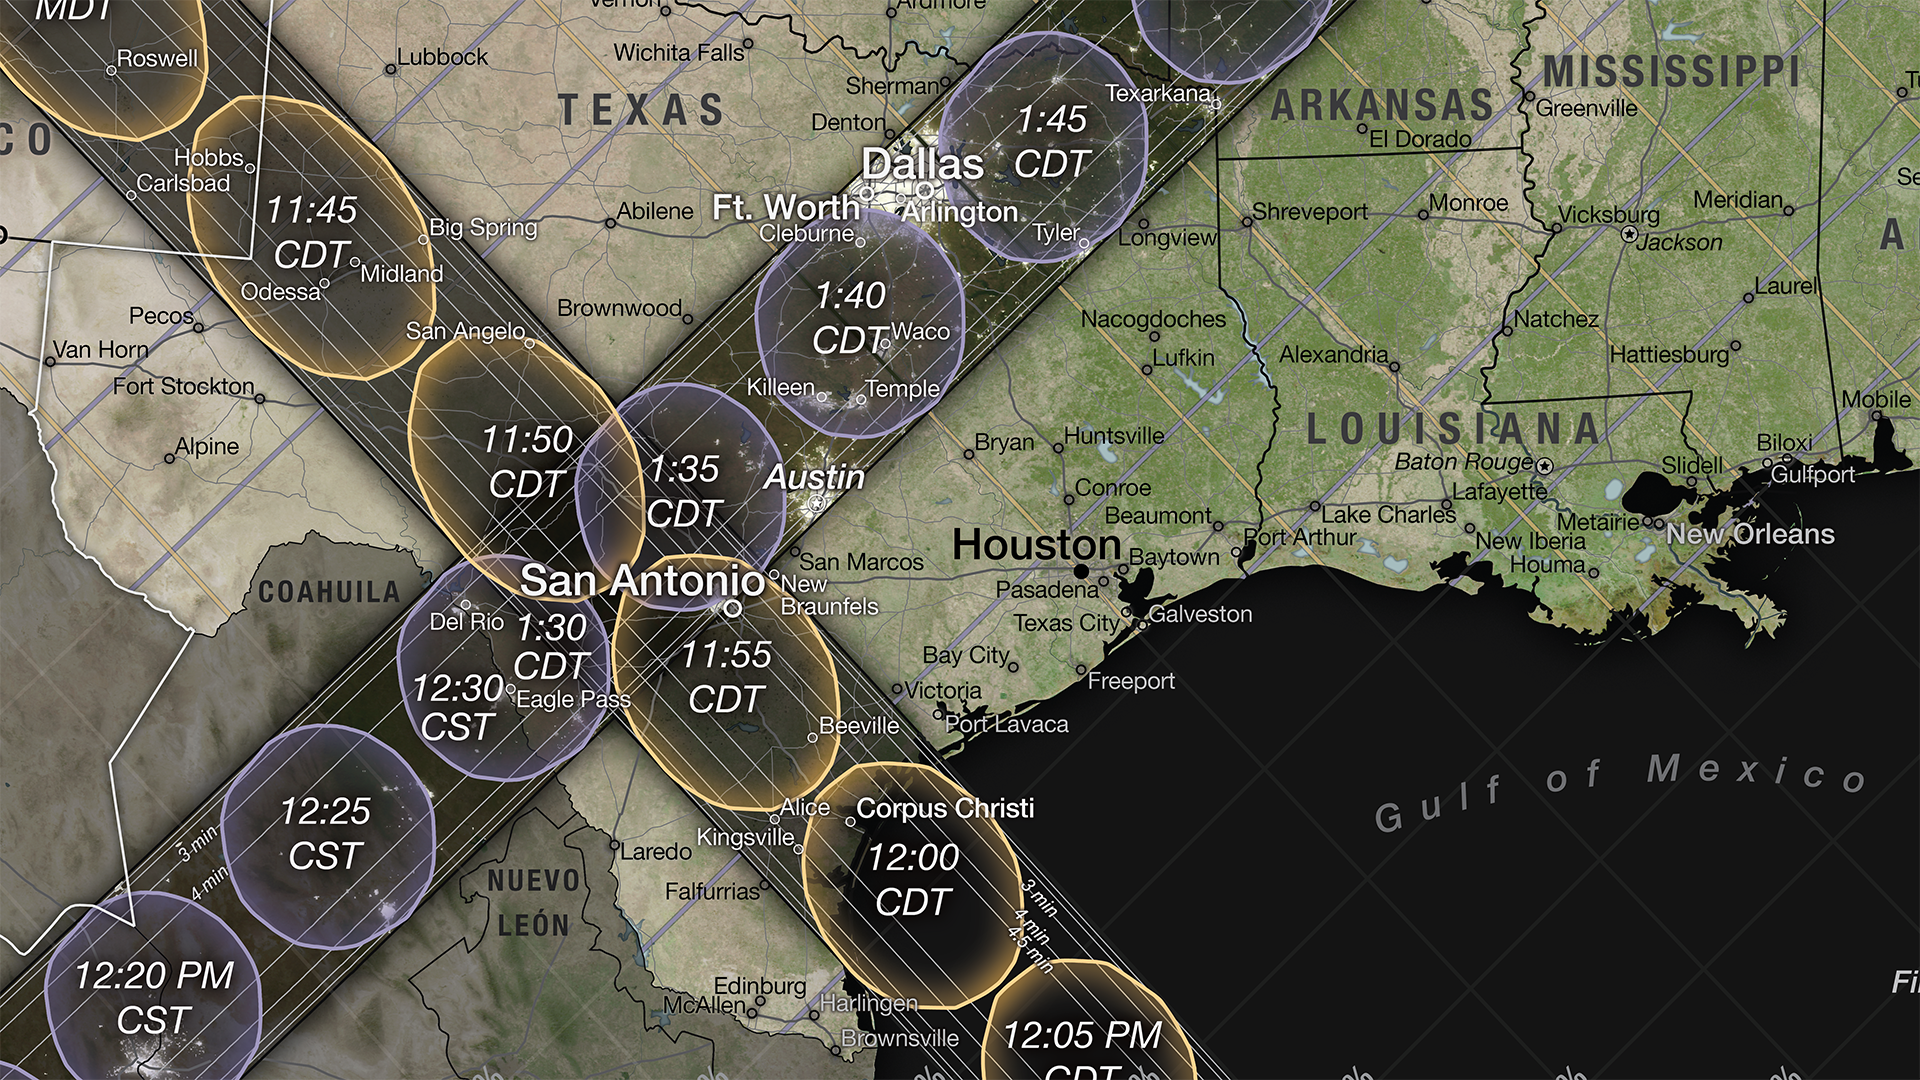
The dark paths across the map are where the largest area of the Sun will be covered by the Moon. People in these paths will experience either an annular or total solar eclipse. Inside these dark eclipse paths are irregular ovals that delineate the Moon’s shadow on the Earth’s surface. For an annular solar eclipse, these ovals are called the antumbra and together make up the path of annularity. For a total solar eclipse, the ovals are called the umbra and create the path of totality. On the map, the ovals contain times inside corresponding to the shape of the Moon’s shadow cast at that time during the eclipse.Also within the dark paths are duration contours. These delineate the length of time annularity or totality will last. The closer to the center of the solar eclipse path, the longer it will last. For the annular path, times range from a few seconds on the outer edge to a maximum of around 4.5 minutes in the center. For the total path, times range up to 4 minutes.
Outside the eclipse paths, the map displays contours of obscuration, or percentage of the Sun’s area covered by the Moon. Readers can trace the lines to percents printed along the left and top of map for the 2023 annular solar eclipse and along the right and bottom for the 2024 total solar eclipse. Notice how the 2024 total solar eclipse has a higher maximum percentage because the Moon will completely cover the Sun’s surface.
Learn more about the map here. View an up-close tour of the map here.
Download Eclipse Data
2023 Annular Eclipse Data:2023eclipse_shapefiles.zip / 2023eclipse_kml.zip / cities-eclipse-2023.json
2024 Total Solar Eclipse Data:2024eclipse_shapefiles.zip / 2024eclipse_kml.zip/ cities-eclipse-2024.json
Each .zip file above contains the following files:
- center A high-resolution polyline tracing the path of the shadow center. Region limited.
- duration Isocontours of maximum total or annular duration, at 30-second intervals.
- ppath “Penumbra path,” contours of maximum partial obscuration (area of the Sun covered by the Moon) at 5% intervals.
- ppath01 “Penumbra path,” contours of maximum partial obscuration (area of the Sun covered by the Moon) at 1% intervals.
- umbra_hi High resolution umbra (or antumbra) polygons, at 1-second intervals. Region limited.
- umbra_lo Lower resolution umbra (or antumbra) polygons, at 10-second intervals. Global.
- upath_hi High resolution path shape. Region limited.
- upath_lo Lower resolution path shape. Global.
Each city times JSON file contains the following information for a selection of over 32k major cities in the US:
- LON Longitude of the city center
- LAT Latitude of the city center
- ECLIPSE An array of UTC times for the [0.01%, 50%, 100%, 50%, 0.01%] points of coverage (normalized with respect to the maximum coverage achieved)
- NAME The name of the city
- STATE The U.S. state of the city
More Map Versions

Eclipse map with major cities, states, paths, Moon shadows and partial lines.
Eclipse map with paths, Moon shadows, and states.
Eclipse map with paths of annularity and totality.
Credits
Please give credit for this item to:
NASA's Scientific Visualization Studio
-
Visualizers
- Michala Garrison (SSAI)
- Ernie Wright (USRA)
-
Scientists
- Michael S. Kirk (NASA/GSFC)
- Carolyn Ng
-
Project manager
- Shannon Reed (ADNET Systems, Inc.)
-
Technical support
- Laurence Schuler (ADNET Systems, Inc.)
- Ian Jones (ADNET Systems, Inc.)
Release date
This page was originally published on Wednesday, March 8, 2023.
This page was last updated on Friday, April 12, 2024 at 12:17 AM EDT.
Datasets used in this visualization
-
DEM [SRTM: SIR-C]
ID: 481 -
BMNG (Blue Marble: Next Generation) [Terra and Aqua: MODIS]
ID: 508Credit: The Blue Marble data is courtesy of Reto Stockli (NASA/GSFC).
This dataset can be found at: http://earthobservatory.nasa.gov/Newsroom/BlueMarble/
See all pages that use this dataset -
DEM (Digital Elevation Map) [LRO: LOLA]
ID: 653 -
DE421 (JPL DE421)
ID: 752Planetary ephemerides
This dataset can be found at: http://ssd.jpl.nasa.gov/?ephemerides#planets
See all pages that use this dataset -
SLDEM2015 (DIgital Elevation Model) [LRO/SELENE: LOLA/TC]
ID: 948A digital elevation model of the Moon derived from the Lunar Orbiter Laser Altimeter and the SELENE Terrain Camera. See the description in Icarus. The data is here.
See all pages that use this dataset -
Black Marble (Black Marble: Next Generation) [Suomi NPP: VIIRS]
ID: 1176Earth at night imagery
Credit: NASA Earth Observatory images by Joshua Stevens, using Suomi NPP VIIRS data from Miguel Román, NASA GSFC.
This dataset can be found at: https://visibleearth.nasa.gov/images/144898/earth-at-night-black-marble-2016-color-maps/144947l
See all pages that use this dataset
Note: While we identify the data sets used in these visualizations, we do not store any further details, nor the data sets themselves on our site.
Related
- ID: 14551
- ID: 5186
 Visualization
 - ID: 14424
- ID: 14420
 Produced Video
 - ID: 5169
Alternate Versions
- ID: 14348

Used as a Source In
- ID: 5123
 Visualization
 - ID: 5124
 Visualization
 - ID: 5086
 Visualization