Earth
ID: 4861
The Stratospheric Aerosol and Gas Experiment III (SAGE III) is a science instrument mounted on the outside of the International Space Station (ISS). SAGE III observes atmospheric aerosols, ozone, and other gases in the Earth’s stratosphere. As the ISS orbits, SAGE III collects data using a technique called occultation. Occultation uses the light from the sun, or moon, as it passes through the atmosphere to measure the amounts of gases and particles in that region of the atmosphere.
This data is combined and processed into zonal means, which are averages for each latitude and altitude. Fast, upper level winds can move aerosols quickly around the Earth, so these zonal means help scientists understand the aerosol distributions in the atmosphere.
These visualizations show approximately three years of SAGE III aerosol data.
The first visualization starts by showing a zonal mean as a curved wall in relation to the Earth. The zonal mean extends between about 70 degrees south and 60 degrees north in latitude. The vertical scale is exaggerated so that the different heights of the SAGE III data can be discerned. The wall is swept around the Earth changing the representation of the data from a 2-D wall to a 3-D particle density field. This reinforces that the zonal means at a particular latitude and altitude are the same at all longitudes around the word.
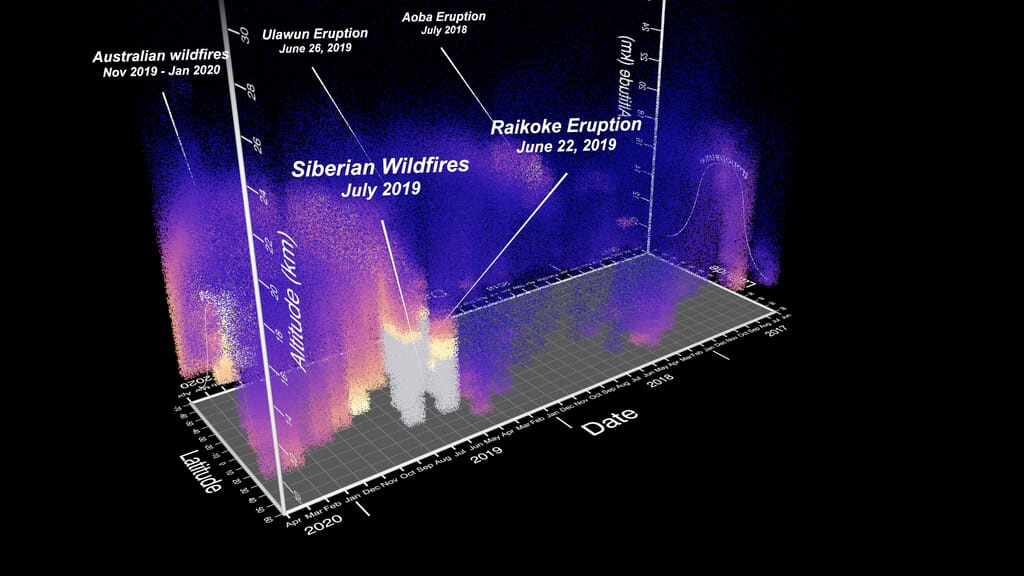
The particle representation of the SAGE III data is then wrapped and turned on the side. The initial data set starts at April 2020 as additional months are added building up a data cube that shows how the SAGE III data varies over time. The data ranges from April 2020 back to June 2017. The vertical scale of the cube is exaggerated to show the details in the data at various altitudes.
As the camera spins around the data, high stratospheric aerosol events detected by the SAGE III instrument are pointed out including:
The area below the data that looks like an arch is the tropopause. SAGE III primarily collects science data from the Earth’s stratosphere, which is above the tropopause. The tropopause is higher in Earth’s atmosphere closer to the equator due to temperature and air pressure, which is what causes the area under the data to look like an arch.
As the camera continues to spin around the data plot, the lower values are removed, leaving only the highest aerosol measurements from SAGE III.
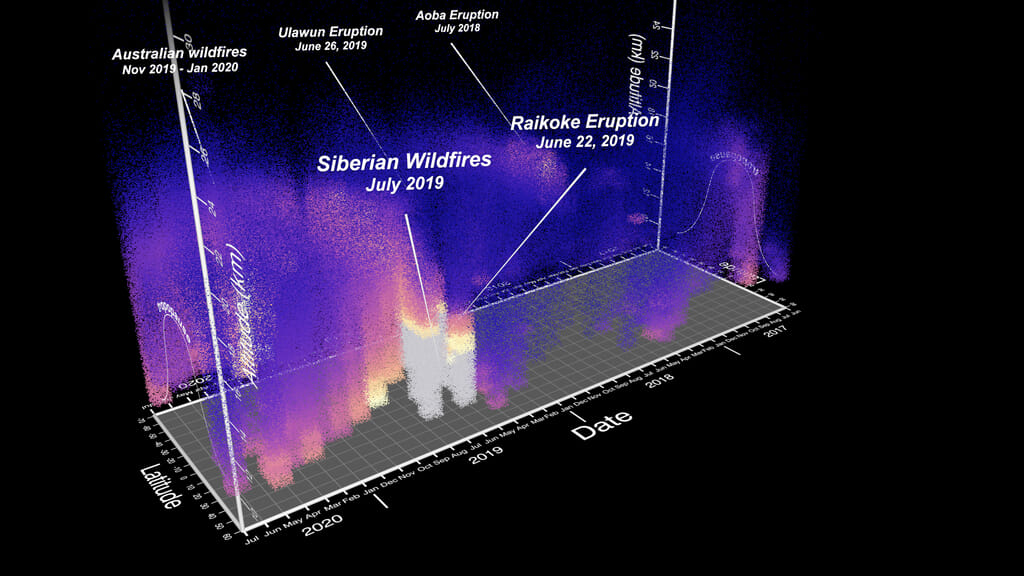
The second visualization is the same as the first except additional months of SAGE III data are included (May, June, and July 2020) and the beginning is left out.
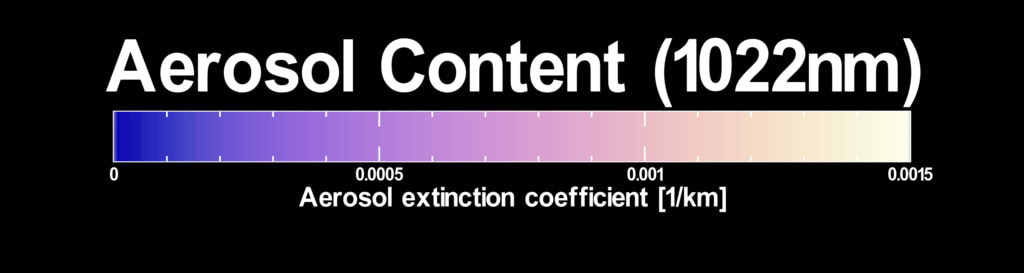
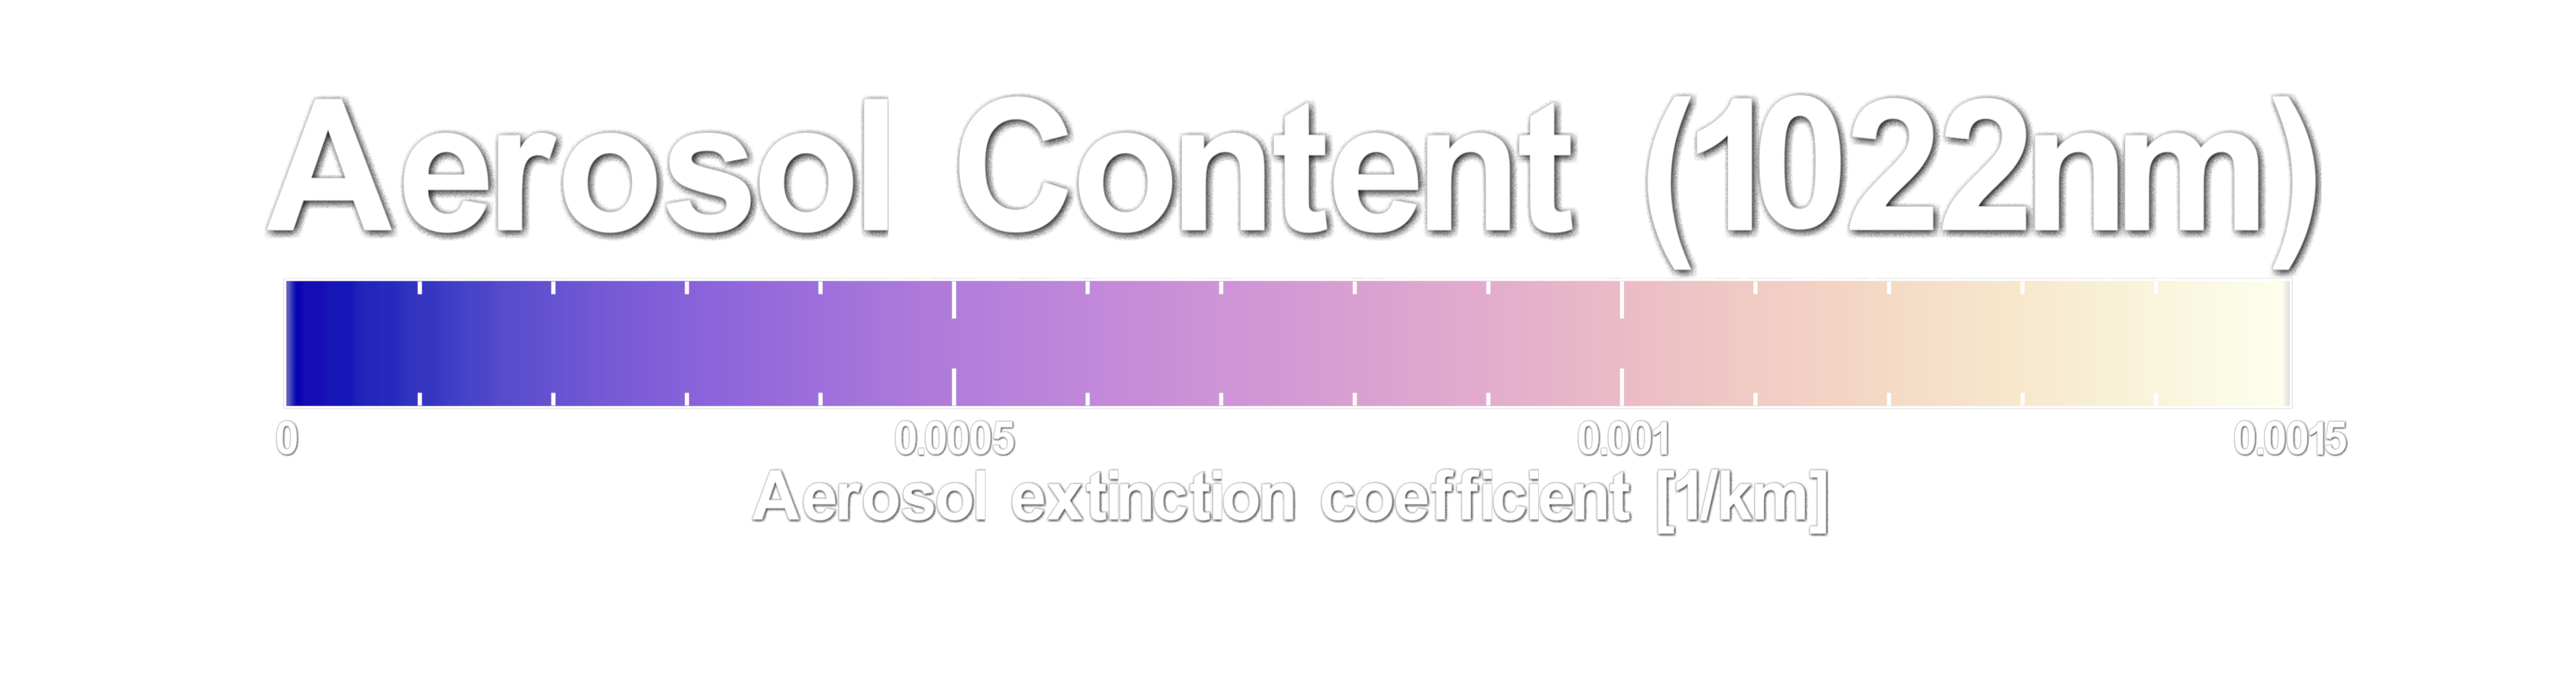
The SAGE III data cube consists of cells of data (i.e., a particular latitude, altitude, and date). Each of these cells are represented by a cloud of particles. The color and density of the particles in a cell are driven by the aerosol extinction coefficient measured at 1022nm (see color table below), which is related to the number of aerosols. The size of the particles in a cell is driven by the ratio of the aerosol extinction coefficient measured at two wavelengths, 750nm over 1022nm. This ratio is sensitive to the physical size of the atmospheric aerosols.
For more information, please visit the SAGE web site: sage.nasa.gov
Three years of SAGE III/ISS Stratospheric Aerosol Data
This data is combined and processed into zonal means, which are averages for each latitude and altitude. Fast, upper level winds can move aerosols quickly around the Earth, so these zonal means help scientists understand the aerosol distributions in the atmosphere.
These visualizations show approximately three years of SAGE III aerosol data.
The first visualization starts by showing a zonal mean as a curved wall in relation to the Earth. The zonal mean extends between about 70 degrees south and 60 degrees north in latitude. The vertical scale is exaggerated so that the different heights of the SAGE III data can be discerned. The wall is swept around the Earth changing the representation of the data from a 2-D wall to a 3-D particle density field. This reinforces that the zonal means at a particular latitude and altitude are the same at all longitudes around the word.
The particle representation of the SAGE III data is then wrapped and turned on the side. The initial data set starts at April 2020 as additional months are added building up a data cube that shows how the SAGE III data varies over time. The data ranges from April 2020 back to June 2017. The vertical scale of the cube is exaggerated to show the details in the data at various altitudes.
As the camera spins around the data, high stratospheric aerosol events detected by the SAGE III instrument are pointed out including:
- Aoba volcanic eruption in July 2018
- Ulawun volcanic eruption in June 2019
- Australian wildfires from November 2019 to January 2020
- Siberian wildfires in July 2019
- Raikoke volcanic eruption in June 2019
- Pacific Northwest wildfires from July 2017 to August 2017
The area below the data that looks like an arch is the tropopause. SAGE III primarily collects science data from the Earth’s stratosphere, which is above the tropopause. The tropopause is higher in Earth’s atmosphere closer to the equator due to temperature and air pressure, which is what causes the area under the data to look like an arch.
As the camera continues to spin around the data plot, the lower values are removed, leaving only the highest aerosol measurements from SAGE III.
The second visualization is the same as the first except additional months of SAGE III data are included (May, June, and July 2020) and the beginning is left out.
The SAGE III data cube consists of cells of data (i.e., a particular latitude, altitude, and date). Each of these cells are represented by a cloud of particles. The color and density of the particles in a cell are driven by the aerosol extinction coefficient measured at 1022nm (see color table below), which is related to the number of aerosols. The size of the particles in a cell is driven by the ratio of the aerosol extinction coefficient measured at two wavelengths, 750nm over 1022nm. This ratio is sensitive to the physical size of the atmospheric aerosols.
For more information, please visit the SAGE web site: sage.nasa.gov
Visualization Credits
Greg Shirah (NASA/GSFC): Lead Visualizer
Allison Leybold (SSAI): Producer
David Flittner (NASA/LaRC): Scientist
Marilee Roell (NASA/LaRC): Scientist
Jamie Nehrir (NASA/LaRC): Engineer
Kevin Leavor (SSAI): Scientist
Haley Reed (ADNET Systems, Inc.): Producer
Trent L. Schindler (USRA): Visualizer
Lori Perkins (NASA/GSFC): Visualizer
Allison Leybold (SSAI): Producer
David Flittner (NASA/LaRC): Scientist
Marilee Roell (NASA/LaRC): Scientist
Jamie Nehrir (NASA/LaRC): Engineer
Kevin Leavor (SSAI): Scientist
Haley Reed (ADNET Systems, Inc.): Producer
Trent L. Schindler (USRA): Visualizer
Lori Perkins (NASA/GSFC): Visualizer
Please give credit for this item to:
NASA's Scientific Visualization Studio
NASA's Scientific Visualization Studio
Short URL to share this page:
https://svs.gsfc.nasa.gov/4861
Data Used:
Note: While we identify the data sets used in these visualizations, we do not store any further details nor the data sets themselves on our site.
Keywords:
DLESE >> Atmospheric science
GCMD >> Earth Science >> Atmosphere >> Aerosols
SVS >> Hyperwall
NASA Science >> Earth
GCMD keywords can be found on the Internet with the following citation: Olsen, L.M., G. Major, K. Shein, J. Scialdone, S. Ritz, T. Stevens, M. Morahan, A. Aleman, R. Vogel, S. Leicester, H. Weir, M. Meaux, S. Grebas, C.Solomon, M. Holland, T. Northcutt, R. A. Restrepo, R. Bilodeau, 2013. NASA/Global Change Master Directory (GCMD) Earth Science Keywords. Version 8.0.0.0.0
https://svs.gsfc.nasa.gov/4861
Data Used:
ISS/SAGE-III/Stratospheric Aerosol
Observed Data - NASA/LaRCKeywords:
DLESE >> Atmospheric science
GCMD >> Earth Science >> Atmosphere >> Aerosols
SVS >> Hyperwall
NASA Science >> Earth
GCMD keywords can be found on the Internet with the following citation: Olsen, L.M., G. Major, K. Shein, J. Scialdone, S. Ritz, T. Stevens, M. Morahan, A. Aleman, R. Vogel, S. Leicester, H. Weir, M. Meaux, S. Grebas, C.Solomon, M. Holland, T. Northcutt, R. A. Restrepo, R. Bilodeau, 2013. NASA/Global Change Master Directory (GCMD) Earth Science Keywords. Version 8.0.0.0.0


