Earth
ID: 4858
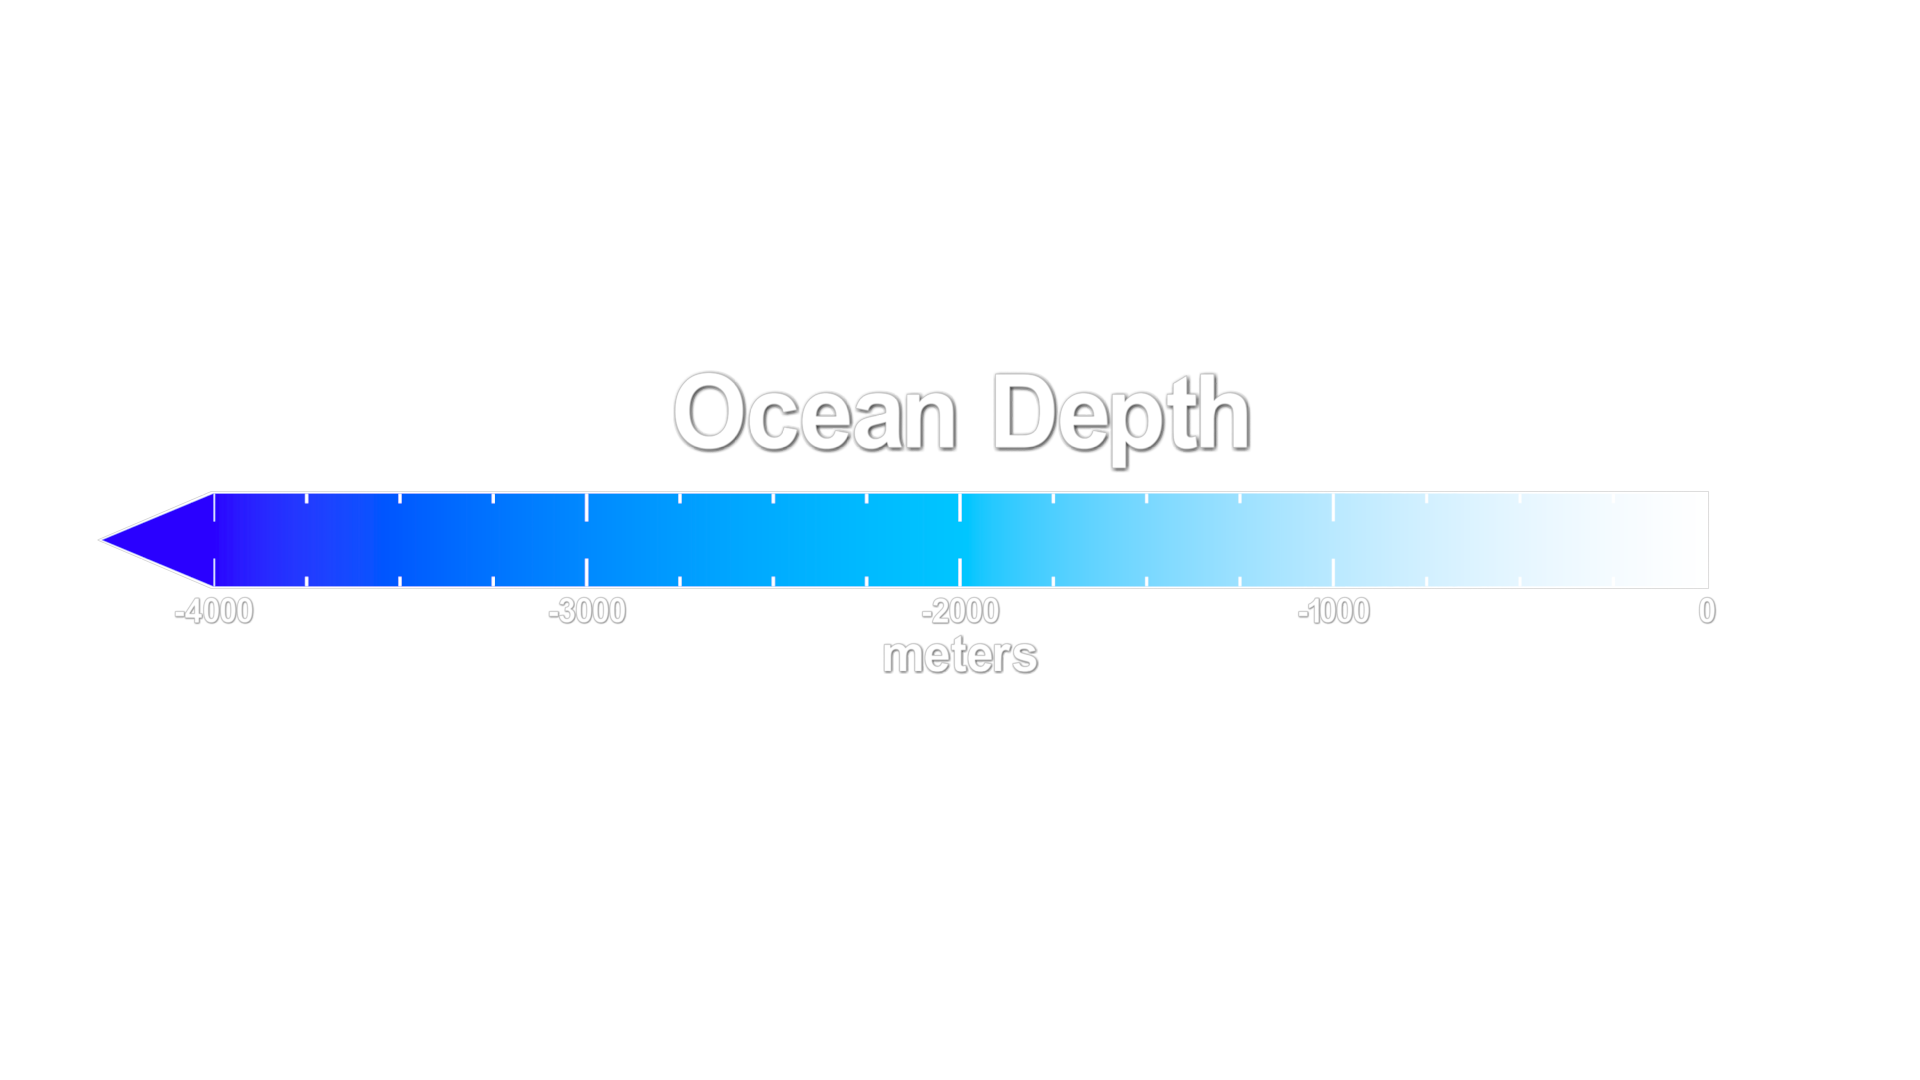
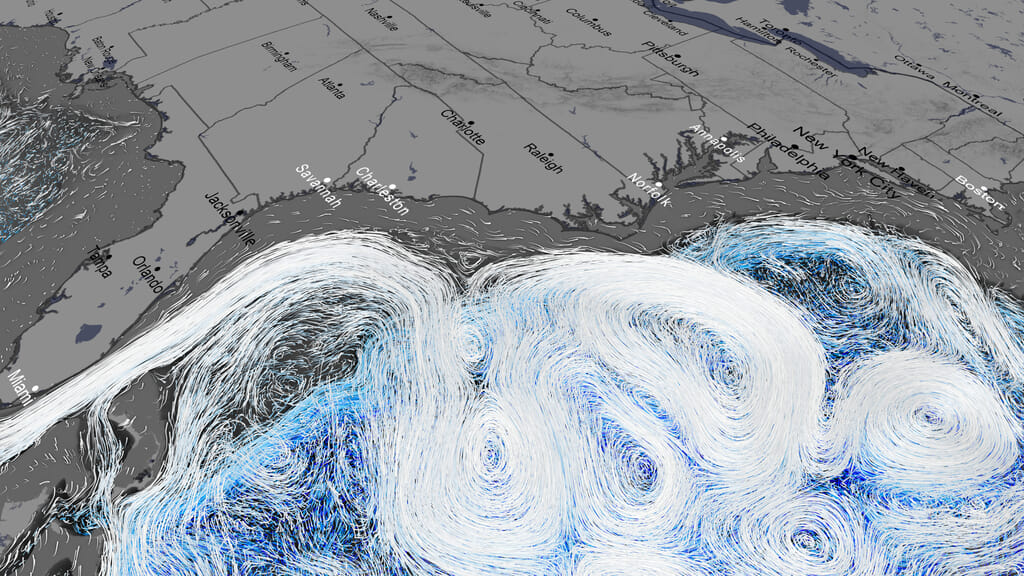
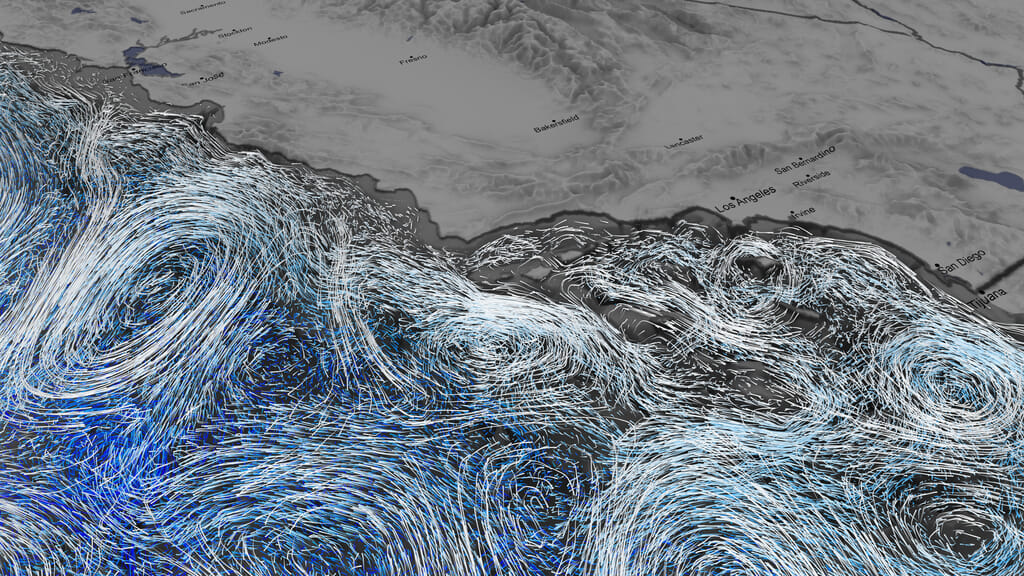
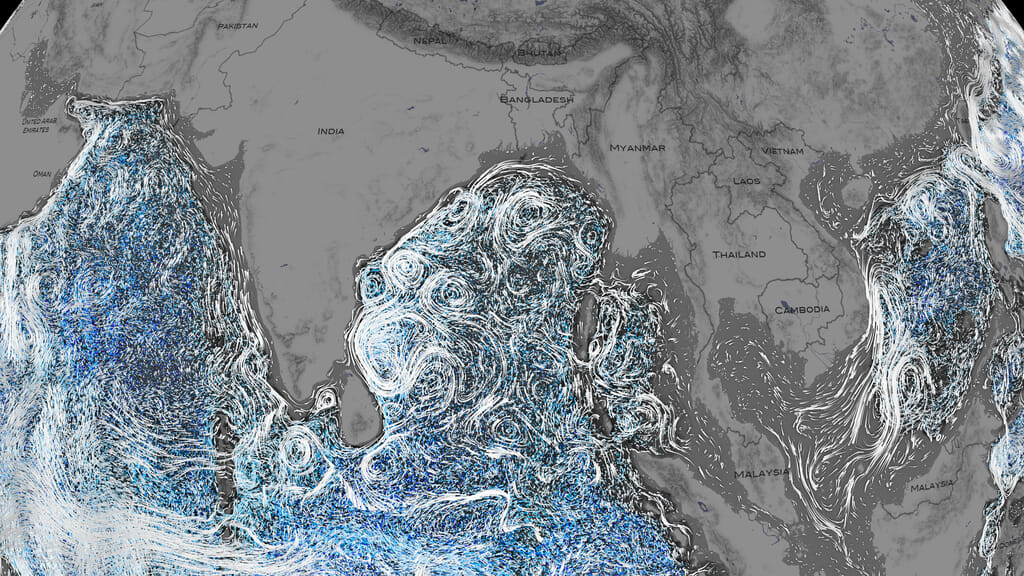
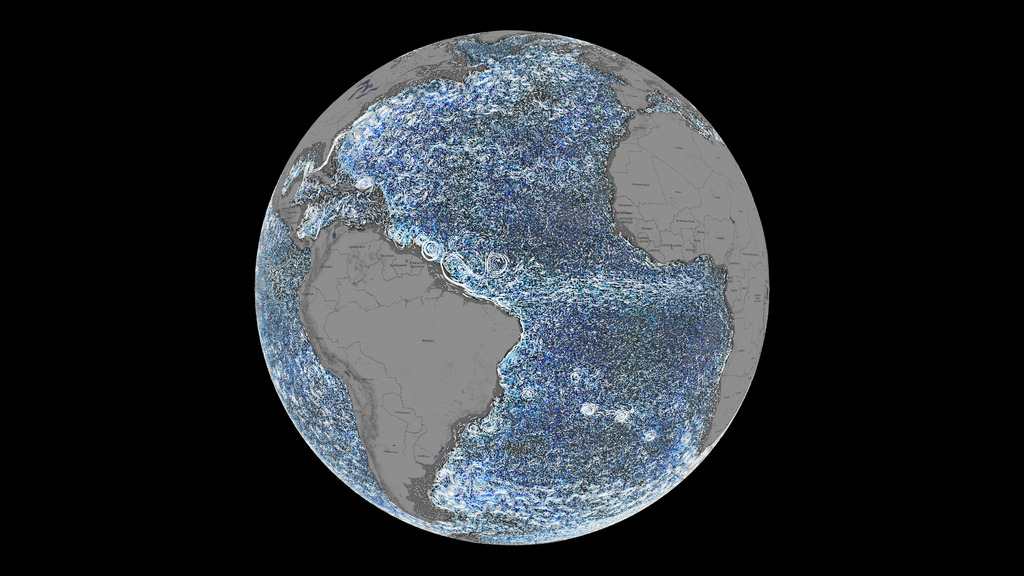
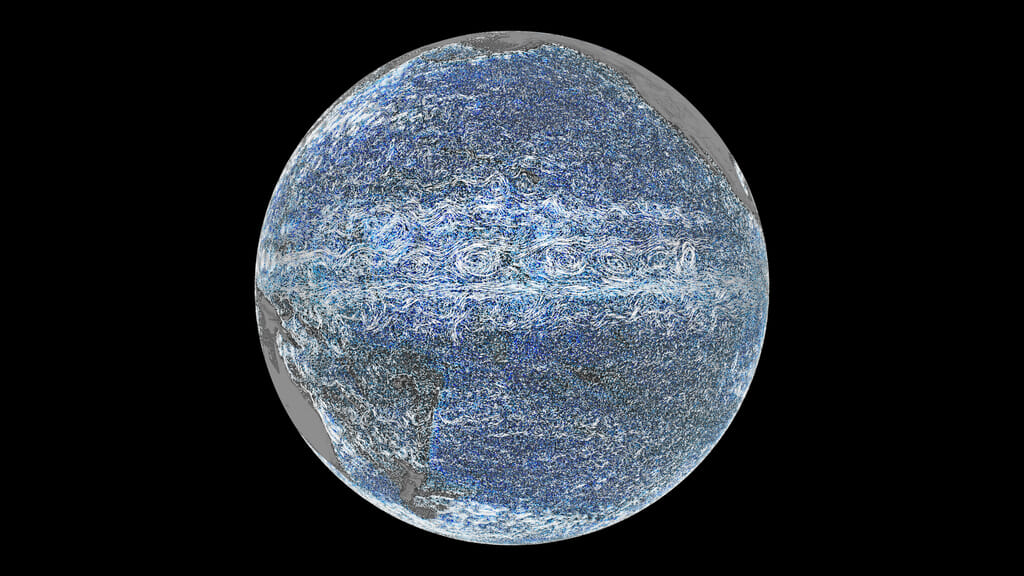
This is a collection of visualizations of ocean flows created in support of NASA's 2020 sea level rise campaign. There are 5 regions of focus:
• central Pacific
• central Atlantic
• southeast Asia
• US east coast
• US west coast
The span of time shown in each visualization is about 10 months. The data used for each visualization comes from the ECCO-2 ocean model using data from 2010-01-15T00:12:58 to 2010-11-22T11:10:31. Each frame of the animation is approximately 2 hours apart.
Ocean Flow Vignettes
• central Pacific
• central Atlantic
• southeast Asia
• US east coast
• US west coast
The span of time shown in each visualization is about 10 months. The data used for each visualization comes from the ECCO-2 ocean model using data from 2010-01-15T00:12:58 to 2010-11-22T11:10:31. Each frame of the animation is approximately 2 hours apart.
Used Elsewhere In
Related
Visualization Credits
Greg Shirah (NASA/GSFC): Lead Visualizer
Horace Mitchell (NASA/GSFC): Visualizer
Laurence Schuler (ADNET Systems, Inc.): Technical Support
Ian Jones (ADNET Systems, Inc.): Technical Support
Horace Mitchell (NASA/GSFC): Visualizer
Laurence Schuler (ADNET Systems, Inc.): Technical Support
Ian Jones (ADNET Systems, Inc.): Technical Support
Please give credit for this item to:
NASA's Scientific Visualization Studio
NASA's Scientific Visualization Studio
Short URL to share this page:
https://svs.gsfc.nasa.gov/4858
Data Used:
Note: While we identify the data sets used in these visualizations, we do not store any further details nor the data sets themselves on our site.
This item is part of this series:
Sea Level Rise
Keywords:
DLESE >> Physical oceanography
GCMD >> Earth Science >> Oceans >> Ocean Circulation
SVS >> Hyperwall
NASA Science >> Earth
GCMD keywords can be found on the Internet with the following citation: Olsen, L.M., G. Major, K. Shein, J. Scialdone, S. Ritz, T. Stevens, M. Morahan, A. Aleman, R. Vogel, S. Leicester, H. Weir, M. Meaux, S. Grebas, C.Solomon, M. Holland, T. Northcutt, R. A. Restrepo, R. Bilodeau, 2013. NASA/Global Change Master Directory (GCMD) Earth Science Keywords. Version 8.0.0.0.0
https://svs.gsfc.nasa.gov/4858
Data Used:
ECCO2 High Resolution Ocean and Sea Ice Model also referred to as: ECCO2
Model - NASA/JPLNOAA National Centers for Environmental Information/ETOPO1 Global Relief Model/Grid Version: ETOPO1 Ice Surface also referred to as: ETOPO1 Global Relief Model
Model - NOAA National Center for Environmental Information
Credit:
NOAA National Centers for Environmental Information
NOAA National Centers for Environmental Information
This item is part of this series:
Sea Level Rise
Keywords:
DLESE >> Physical oceanography
GCMD >> Earth Science >> Oceans >> Ocean Circulation
SVS >> Hyperwall
NASA Science >> Earth
GCMD keywords can be found on the Internet with the following citation: Olsen, L.M., G. Major, K. Shein, J. Scialdone, S. Ritz, T. Stevens, M. Morahan, A. Aleman, R. Vogel, S. Leicester, H. Weir, M. Meaux, S. Grebas, C.Solomon, M. Holland, T. Northcutt, R. A. Restrepo, R. Bilodeau, 2013. NASA/Global Change Master Directory (GCMD) Earth Science Keywords. Version 8.0.0.0.0


