Earth
ID: 4586
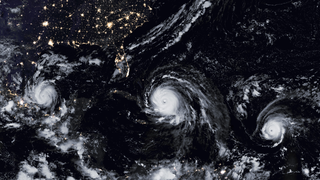
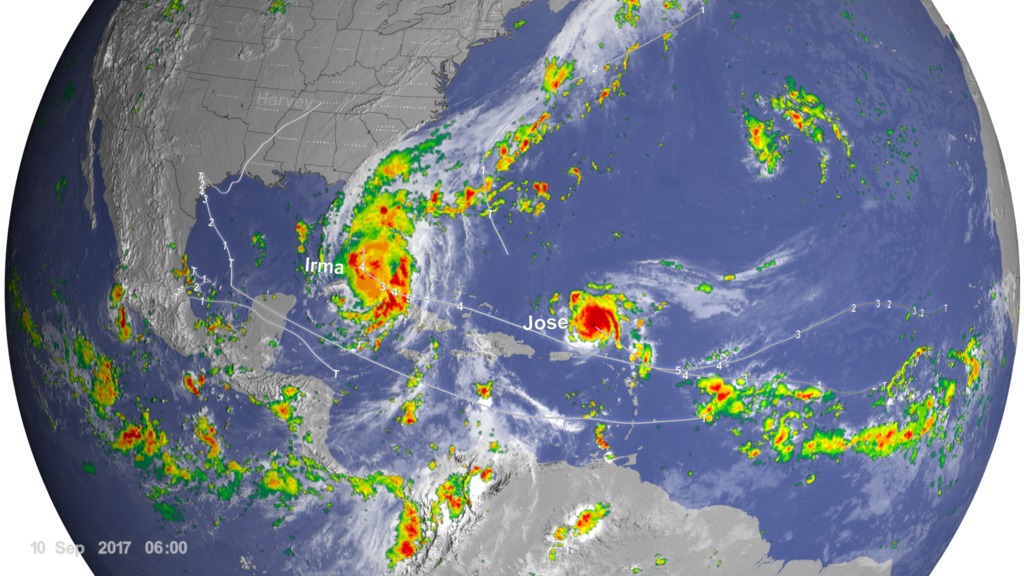
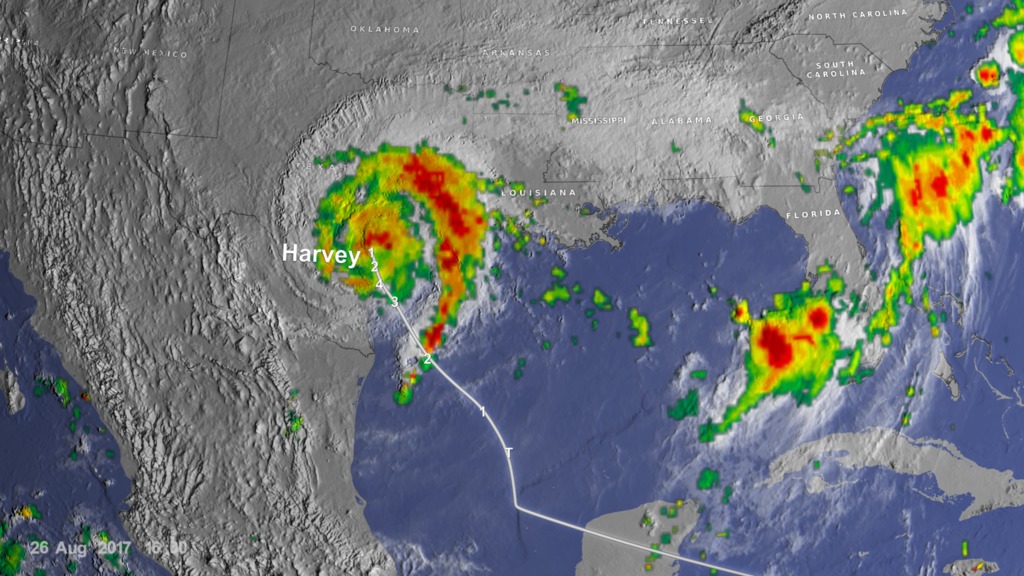
These visualizations show the tracks of Atlantic hurricanes during 2017. Data from the Global Precipitation Mission called IMERG is used to show rainfall and data from NOAA's GOES East shows clouds. Storm position and wind speed data from UNISYS are used to show the track lines. The numbers 1 through 5 as well as "T" are displayed when storms change categories. The "T" stands for tropical storm.
There are 2 visualizations at various resolutions:
- a wide Atlantic view that shows all of the hurricane tracks
- a view that follows and zooms in only on Hurricane Harvey
These visualizaitons were created to support NASA talks given at the National Air and Space Musuem (NASM) in October 2017. The wide Atlantic view was updated at the end of hurricane season to include all Atlantic hurricanes in 2017 for display at the American Geophysical Union (AGU) conference.
These visualizations only go through October 2017 because there were no Atlantic hurricanes in November or December 2017.
Hurricane Tracks from 2017 with Precipitation and Cloud Data
There are 2 visualizations at various resolutions:
- a wide Atlantic view that shows all of the hurricane tracks
- a view that follows and zooms in only on Hurricane Harvey
These visualizaitons were created to support NASA talks given at the National Air and Space Musuem (NASM) in October 2017. The wide Atlantic view was updated at the end of hurricane season to include all Atlantic hurricanes in 2017 for display at the American Geophysical Union (AGU) conference.
These visualizations only go through October 2017 because there were no Atlantic hurricanes in November or December 2017.
Used Elsewhere In
Visualization Credits
Greg Shirah (NASA/GSFC): Lead Visualizer
Laurence Schuler (ADNET Systems, Inc.): Technical Support
Ian Jones (ADNET Systems, Inc.): Technical Support
Horace Mitchell (NASA/GSFC): Visualizer
Alex Kekesi (Global Science and Technology, Inc.): Visualizer
Kel Elkins (USRA): Visualizer
Marshall Shepherd: Scientist
Matthew R. Radcliff (USRA): Producer
Patrick Lynch (NASA/GSFC): Writer
Please give credit for this item to:
NASA's Scientific Visualization Studio
NASA's Scientific Visualization Studio
Short URL to share this page:
https://svs.gsfc.nasa.gov/4586
Data Used:
Note: While we identify the data sets used in these visualizations, we do not store any further details nor the data sets themselves on our site.
This item is part of these series:
Hurricanes
NASM2017
Keywords:
DLESE >> Atmospheric science
SVS >> Clouds
SVS >> Earth
SVS >> GPM
SVS >> NASM
DLESE >> Natural hazards
GCMD >> Earth Science >> Atmosphere >> Clouds
GCMD >> Earth Science >> Atmosphere >> Precipitation
GCMD >> Earth Science >> Atmosphere >> Atmospheric Phenomena >> Hurricanes
SVS >> Hyperwall
NASA Science >> Earth
NASA Earth Science Focus Areas >> Weather and Atmospheric Dynamics
GCMD keywords can be found on the Internet with the following citation: Olsen, L.M., G. Major, K. Shein, J. Scialdone, S. Ritz, T. Stevens, M. Morahan, A. Aleman, R. Vogel, S. Leicester, H. Weir, M. Meaux, S. Grebas, C.Solomon, M. Holland, T. Northcutt, R. A. Restrepo, R. Bilodeau, 2013. NASA/Global Change Master Directory (GCMD) Earth Science Keywords. Version 8.0.0.0.0
https://svs.gsfc.nasa.gov/4586
Data Used:
GTOPO30 Topography and Bathymetry
Data Compilation - USGSHurricane/Tropical Data
Database - Unisys - 2017CPC (Climate Prediction Center) Cloud Composite
Data Compilation - Climate Prediction Center (CPC) - 2017
Global cloud cover from multiple satellites
also referred to as: IMERG
Data Compilation - NASA/GSFC - 2017This item is part of these series:
Hurricanes
NASM2017
Keywords:
DLESE >> Atmospheric science
SVS >> Clouds
SVS >> Earth
SVS >> GPM
SVS >> NASM
DLESE >> Natural hazards
GCMD >> Earth Science >> Atmosphere >> Clouds
GCMD >> Earth Science >> Atmosphere >> Precipitation
GCMD >> Earth Science >> Atmosphere >> Atmospheric Phenomena >> Hurricanes
SVS >> Hyperwall
NASA Science >> Earth
NASA Earth Science Focus Areas >> Weather and Atmospheric Dynamics
GCMD keywords can be found on the Internet with the following citation: Olsen, L.M., G. Major, K. Shein, J. Scialdone, S. Ritz, T. Stevens, M. Morahan, A. Aleman, R. Vogel, S. Leicester, H. Weir, M. Meaux, S. Grebas, C.Solomon, M. Holland, T. Northcutt, R. A. Restrepo, R. Bilodeau, 2013. NASA/Global Change Master Directory (GCMD) Earth Science Keywords. Version 8.0.0.0.0


