Earth
ID: 13347
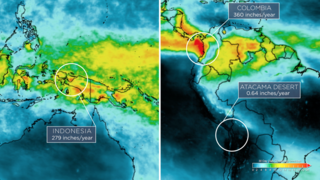
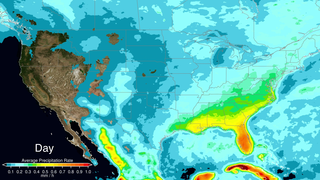
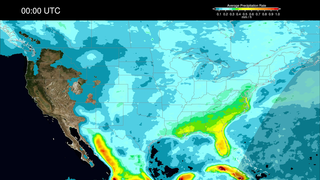
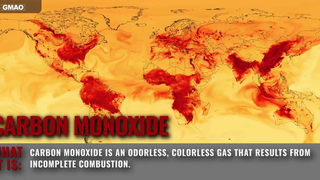
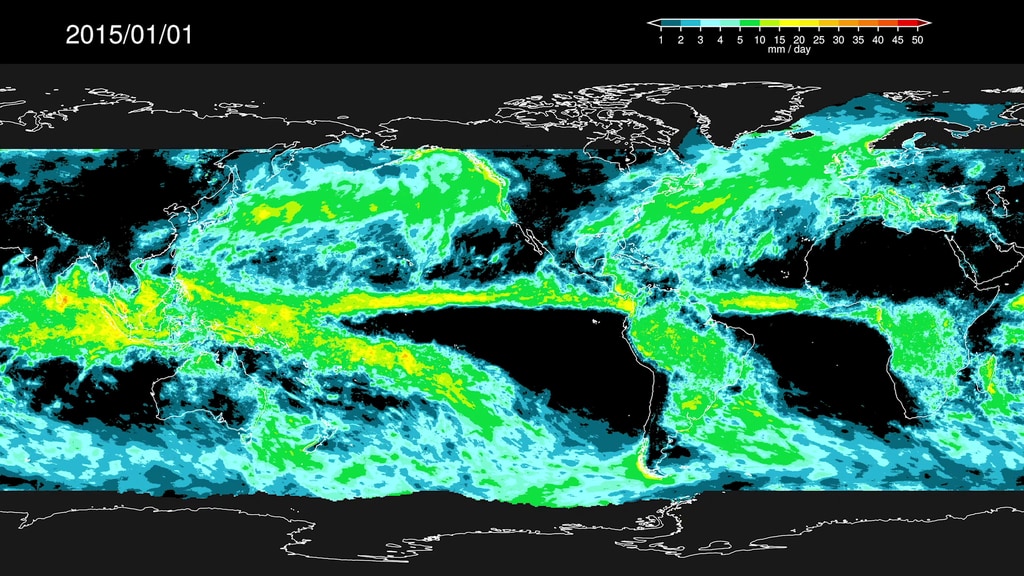
This visualization of the precipitation from IMERG, averaged over 90 days, shows how the broad patterns of global precipitation fluctuate during this particular time period. Unlike the climatology, the vigorous, relatively small-scale precipitation systems create a very "lumpy", continually evolving pattern. Most notably here, the 2015-2016 El Niño is one of the strongest on record. The changes in the atmospheric circulation shift the rainfall that typically falls in the western Pacific—over Southeast Asia and northern Australia—to the central or eastern Pacific.
Precipitation Accumulation and Anomalies
The anomalies show the deviation from the normal seasonal cycle of precipitation. These maps help interpret the accumulation maps by isolating attention on the changes. Most notably here, the 2015-2016 El Niño is one of the strongest on record. The changes in the atmospheric circulation shift the rainfall that typically falls in the western Pacific—over Southeast Asia and northern Australia—to the central or eastern Pacific. As well, there are dry conditions across the Caribbean, tropical Atlantic, and northern South America. This display reduces the welter of "ordinary" precipitation and focuses attention on the systematic changes that are persistent, but not necessarily large enough to be readily noticed in the accumulations.
Used Elsewhere In
Related
Credits
Ryan Fitzgibbons (USRA): Lead Producer
Joy Ng (USRA): Lead Producer
George Huffman (NASA/GSFC): Lead Scientist
Dalia B Kirschbaum (NASA/GSFC): Lead Scientist
Jackson Boon Sze Tan (USRA): Lead Visualizer
Alex Kekesi (Global Science and Technology, Inc.): Visualizer
Joy Ng (USRA): Lead Producer
George Huffman (NASA/GSFC): Lead Scientist
Dalia B Kirschbaum (NASA/GSFC): Lead Scientist
Jackson Boon Sze Tan (USRA): Lead Visualizer
Alex Kekesi (Global Science and Technology, Inc.): Visualizer
Please give credit for this item to:
NASA's Goddard Space Flight Center
NASA's Goddard Space Flight Center
Short URL to share this page:
https://svs.gsfc.nasa.gov/13347
Keywords:
SVS >> Hyperwall
NASA Science >> Earth
https://svs.gsfc.nasa.gov/13347
Keywords:
SVS >> Hyperwall
NASA Science >> Earth


