Precipitation Diurnal Cycles
The daily cycle of weather, also known as the diurnal cycle, shapes how and when our weather develops and is fundamental to regulating our climate.
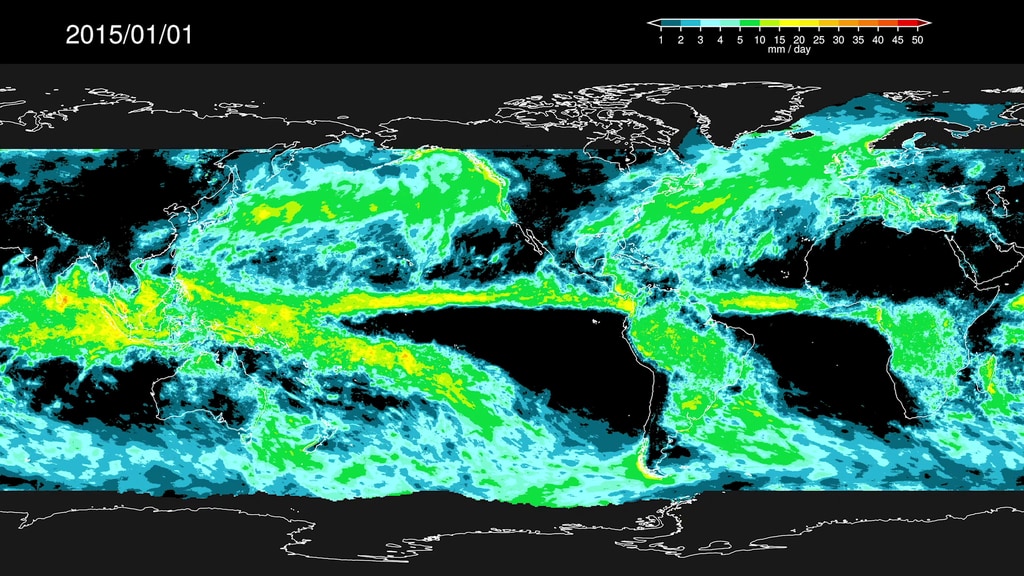
These animations show the most detailed view of the diurnal cycles over the United States. They were created using NASA's newest extended precipitation record known as the Integrated Multi-satellitE Retrievals for GPM, or IMERG analysis.
The IMERG analysis combines almost 20 years of rain and snow data from the Tropical Rainfall Measuring Mission (TRMM) and the joint NASA-JAXA Global Precipitation Measurement mission (GPM).
Learn more at NASA.gov.
Continental United States
This IMERG visualization depicts the average amount of rainfall every 30 minutes around the day during the summer months of June, July and August. This detailed information on the diurnal cycle of precipitation over the globe can help improve numerical weather and climate models by providing a reliable dataset based on observations.
Florida and Southeast
This IMERG visualization depicts the average amount of rainfall every 30 minutes around the day during the summer months of June, July and August. The heat from the Sun builds up over the course of a day, culminating in afternoon thunderstorms over land. Near the coast, this is further accentuated by coastal breezes, feeding the rainfall systems over land with moisture from the sea. This detailed information on the diurnal cycle of precipitation over the globe can help improve numerical weather and climate models by providing a reliable dataset based on observations.
Northeast
This IMERG visualization depicts the average amount of rainfall every 30 minutes around the day during the summer months of June, July and August. The heat from the Sun builds up over the course of a day, culminating in afternoon thunderstorms over land. This detailed information on the diurnal cycle of precipitation over the globe can help improve numerical weather and climate models by providing a reliable dataset based on observations.
Midwest and Great Plains
This IMERG visualization depicts the average amount of rainfall every 30 minutes around the day during the summer months of June, July and August. Over the Great Plains, thunderstorms flare up east of the Rocky Mountains in the late afternoon and roll eastwards over the night across the central U.S. This detailed information on the diurnal cycle of precipitation over the globe can help improve numerical weather and climate models by providing a reliable dataset based on observations.
West Coast (winter)
This IMERG visualization depicts the average amount of rainfall every 30 minutes throughout the day during the winter months of December, January and February. The average precipitation varies weakly over the course of a day, but the coastal regions generally receive similar amounts of precipitation at any hour, day or night. During the winter, precipitation systems in this region are driven less by the daily cycle of heating from the Sun and more by atmospheric rivers coming in from the Pacific Ocean. This detailed information on the diurnal cycle of precipitation over the globe can help improve numerical weather and climate models by providing a reliable dataset based on observations.
Credits
Please give credit for this item to:
NASA's Goddard Space Flight Center
-
Visualizers
- Jackson Boon Sze Tan (USRA)
- Alex Kekesi (Global Science and Technology, Inc.)
-
Producers
- Ryan Fitzgibbons (USRA)
- Joy Ng (USRA)
Release date
This page was originally published on Tuesday, October 15, 2019.
This page was last updated on Wednesday, November 15, 2023 at 12:23 AM EST.
Missions
This visualization is related to the following missions:Related
- ID: 13347
 Produced Video
Used as a Source In
- ID: 13348
![Complete transcript available.Music Credits: "Battle For Our Future" and "Wonderful Orbit" by Tom Furse Fairfax Cowan [PRS], "Transitions" by Ben Niblett [PRS] and Jon Cotton [PRS], "Emerging Discovery by "Rik Carter [PRS] from Killer Tracks](/vis/a010000/a013300/a013348/13348_DailyCycleOfRain_YouTube.00561_print.jpg) Produced Video
Produced Video - ID: 13345
 Produced Video