Earth
ID: 11746

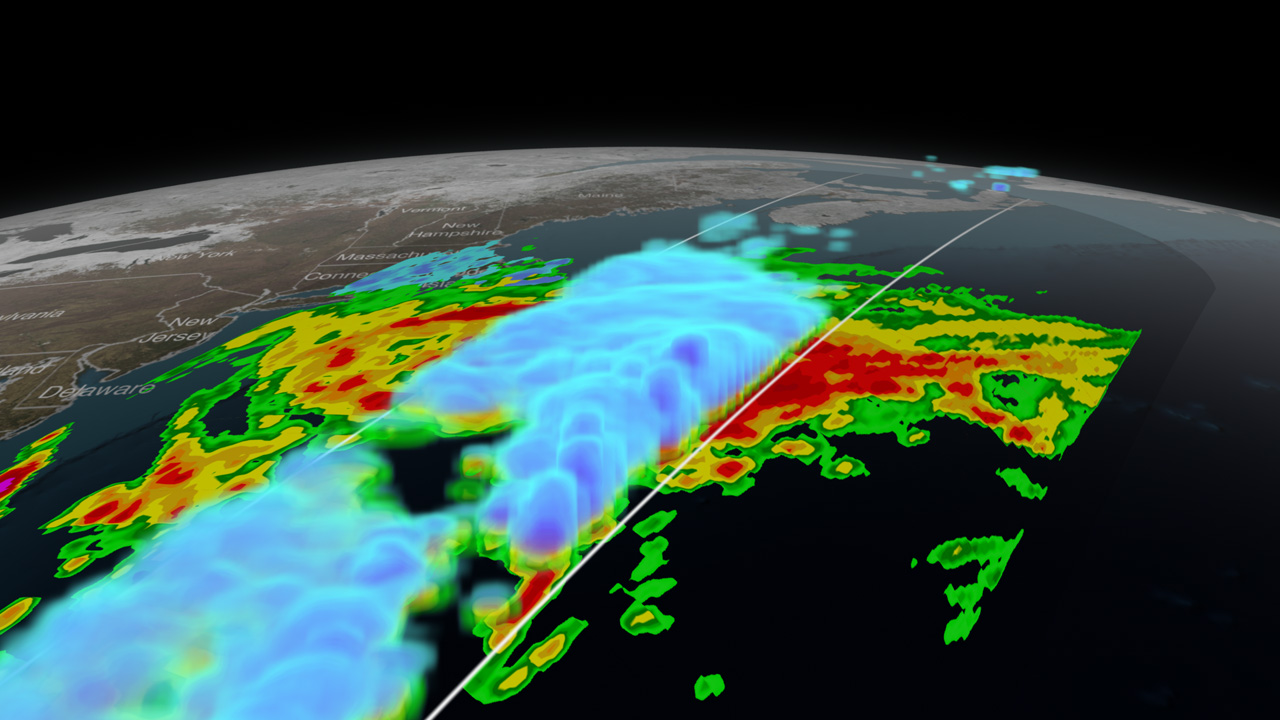
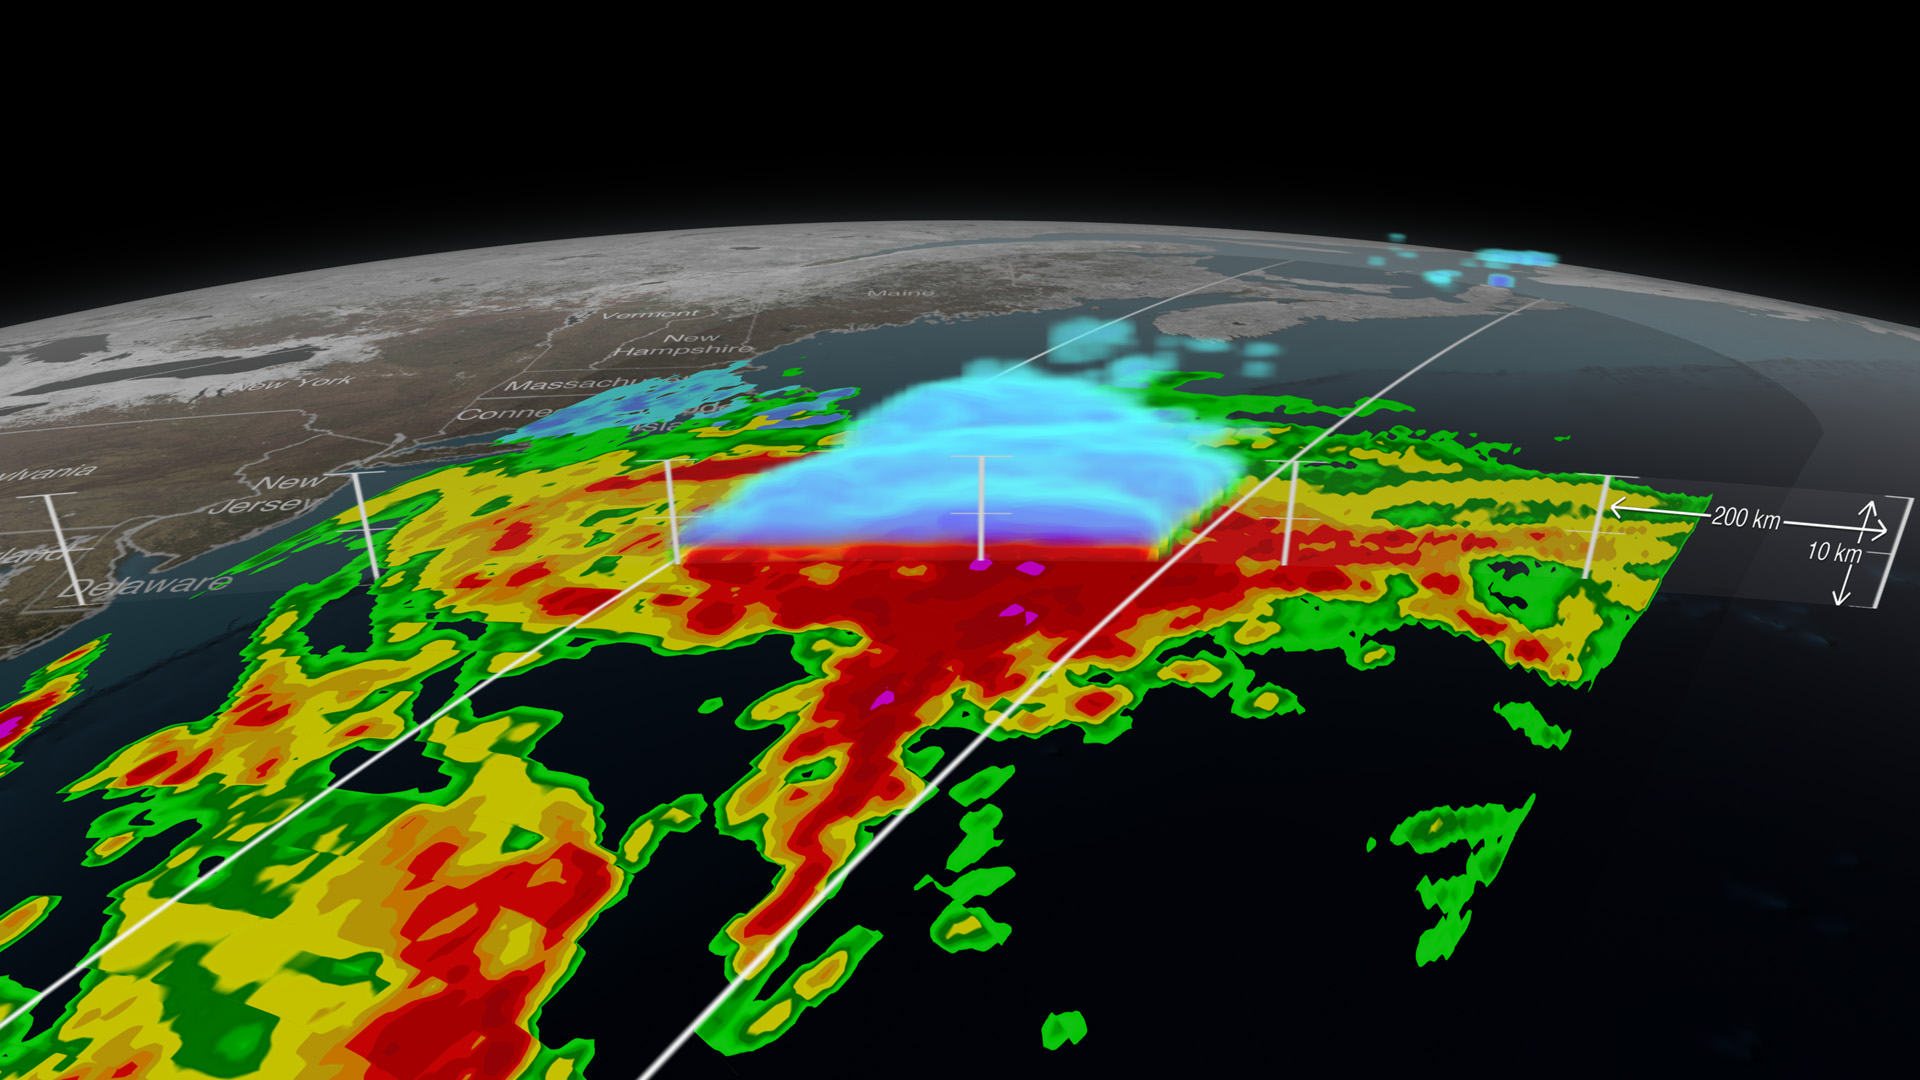
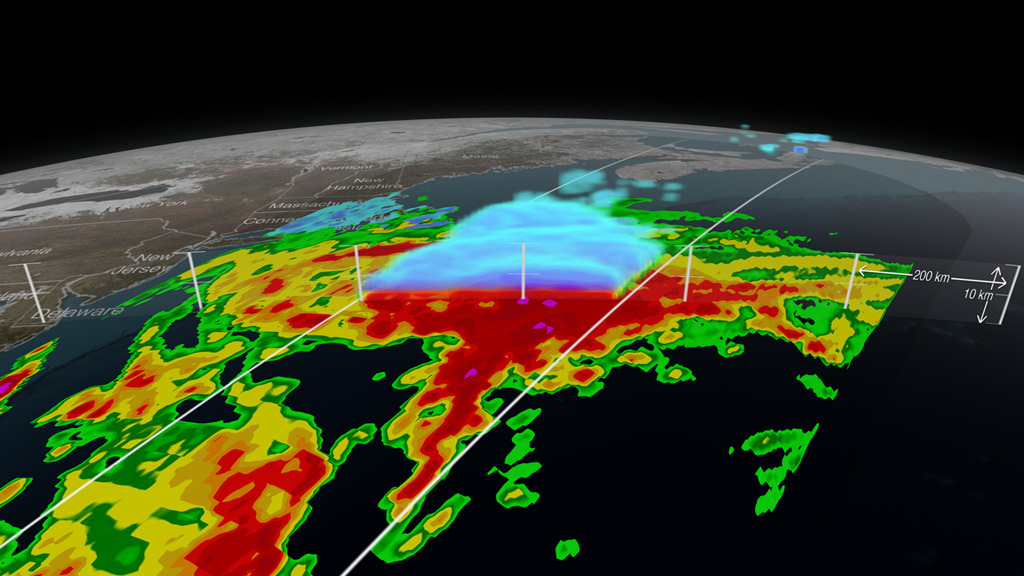
Winter in the northeastern United States is bleak. Biting cold air streams down from Canada, while storms like nor’easters can dump enough snow and ice to shut down cities for days. When a nor’easter begins to whirl, accurate forecasts are crucial in determining how much snow will land where. In 2014, NASA launched the Global Precipitation Measurement (GPM) mission to visualize storms in three dimensions—and a January 2015 nor’easter was the perfect opportunity for it to strut its stuff. High-precision radar aboard GPM’s Core Observatory satellite mapped the vertical distribution of rain and snow, while a microwave imager pierced the atmosphere like an X-ray to create a detailed projection of precipitation rates along the storm’s base. Together, these tools identified the wettest and most forceful parts of the nor’easter. Watch the video to see the winter storm in 3-D.
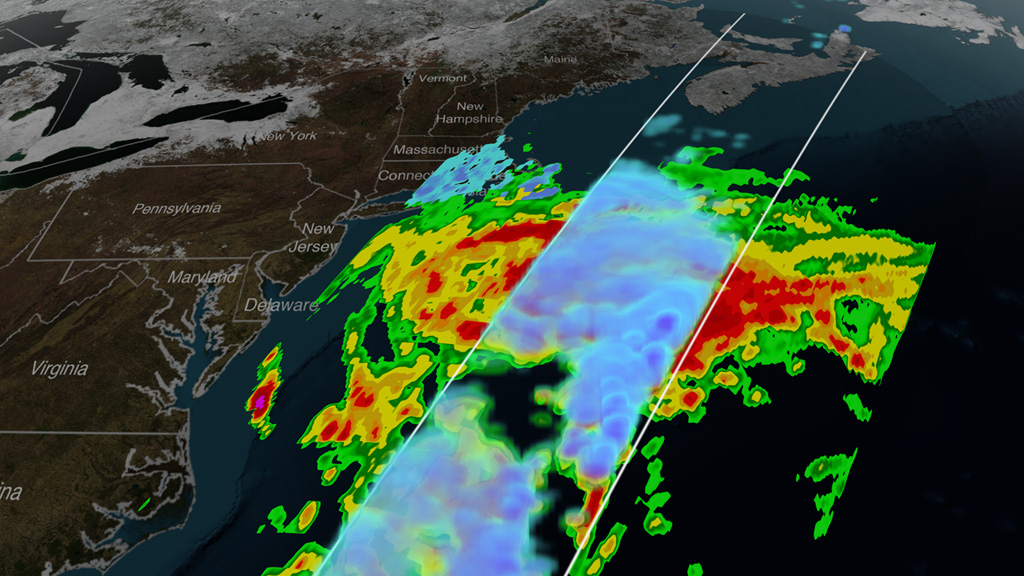

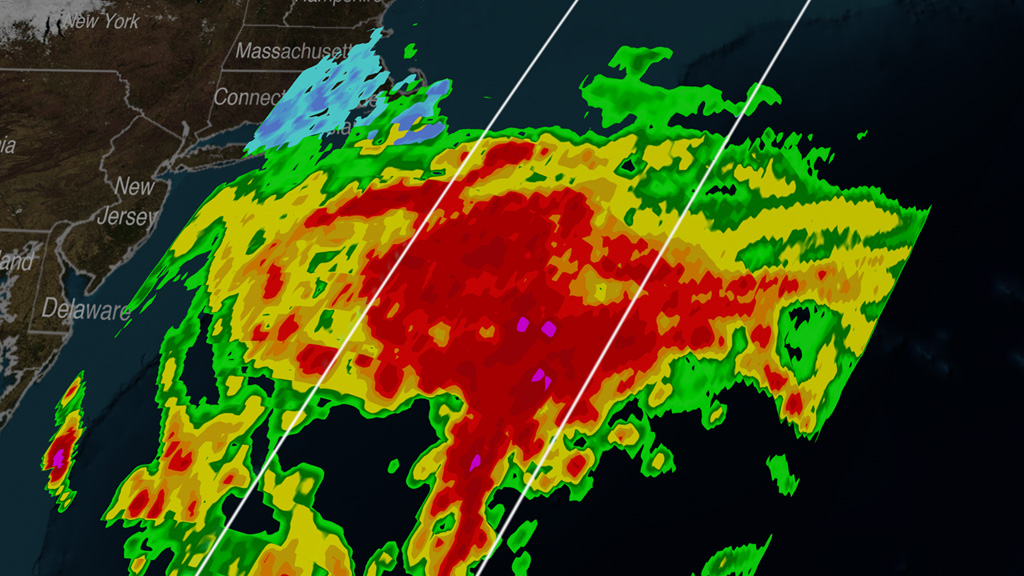
3-D Blizzard
Related Story

For More Information
Story Credits
Lead Visualizer/Animator:
Alex Kekesi (Global Science and Technology, Inc.)
Visualizer/Animator:
Greg Shirah (NASA/GSFC)
Lead Producer:
Ryan Fitzgibbons (USRA)
Producer:
Rani Gran (NASA/GSFC)
Lead Scientists:
Gail Skofronick Jackson (NASA/GSFC)
Dalia B Kirschbaum (NASA/GSFC)
George Huffman (NASA/GSFC)
Lead Writer:
Kerry Klein (USRA)
Please give credit for this item to:
NASA's Scientific Visualization Studio
NASA's Scientific Visualization Studio
Short URL to share this page:
https://svs.gsfc.nasa.gov/11746
Keywords:
NASA Science >> Earth
SVS >> App
https://svs.gsfc.nasa.gov/11746
Keywords:
NASA Science >> Earth
SVS >> App