GPM Sees 2015 Nor'easter Dump Snow on New England
Animation of the Nor'easter as it develops and moves east of the New England coast and then stops on January 26 at 5:06pm EST while GPM takes a snapshot of the storm. Slicing through the volumetric precipitation data shows the low lying nature of this storm as well as the intense precipitation amounts at it's center. The massive potentional for precipitation can be seen in the underlying GMI ground precipitation data. Had the center of the storm parked over New England, it could have generated massive amounts of snowfall. Luckily, it quickly moved out over the warmer ocean water and only the outer bands affected New England, still generating considerable snowfall, but not the historical totals that had been anticipated.
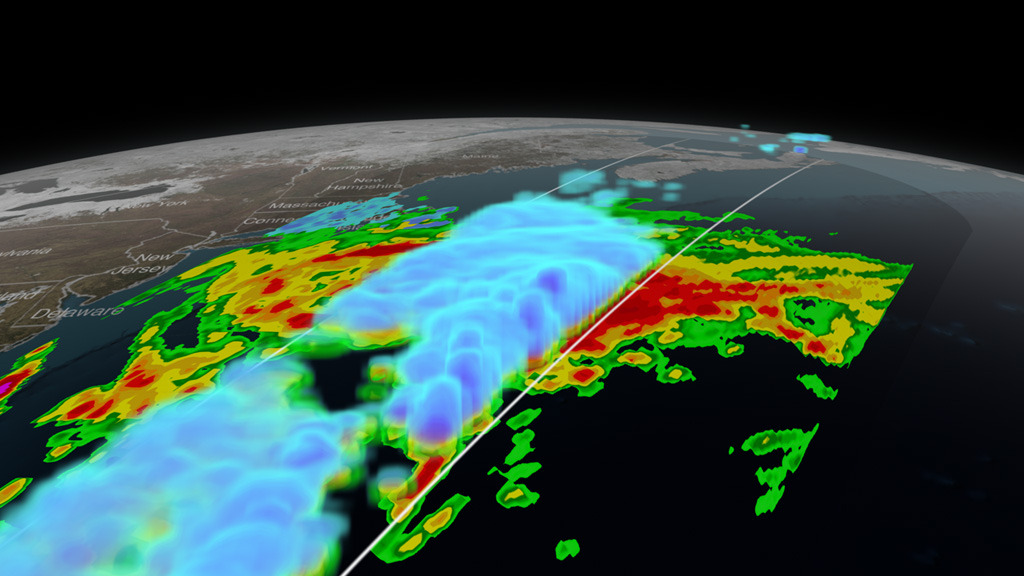
At 5:06 p.m. EST Monday, Jan. 26, 2015, the Global Precipitation Measurement mission's Core Observatory flew over the nor'easter dumping snow on New England. This satellite image shows precipitation rate of rainfall, in green to red, and snowfall, in blue to purple. The center of the storm, shown in 3-D, was offshore with far reaching bands of snowfall. More intense snow rates are shown in shades of blue, which can be seen on the northern edge of the storm and also over land up the coast from New York to Maine and into Canada, as well in the upper atmosphere before turning to heavy rainfall over the ocean.
Nor'easters form when warm moist air traveling north with the Gulf Stream up the coast collides with cold air travelling down from Canada. The combination of moisture and cold can develop into snowstorms. In Jan. 2015, these air masses collided into a storm that brought blizzard conditions with, as of Tuesday morning, up to 30 inches of snow and 70 mile per hour winds across parts of Connecticut, Maine, Massachusetts, New Hampshire New York and Rhode Island. Lesser snow totals also hit New Jersey, Pennsylvania, Maryland, Virginia and West Virginia. Snow is expected to continue to fall into Wednesday as the storm moves northeast up the coast.
The GPM Core Observatory carries two instruments that show the location and intensity of rain and snow, which defines a crucial part of the storm structure – and how it will behave. The GPM Microwave Imager sees through the tops of clouds to observe how much and where precipitation occurs, and the Dual-frequency Precipitation Radar observes precise details of precipitation in 3-dimensions.
GPM data is part of the toolbox of satellite data used by forecasters and scientists to understand how storms behave. GPM is a joint mission between NASA and the Japan Aerospace Exploration Agency. Current and future data sets are available with free registration to users from NASA Goddard's Precipitation Processing Center website.

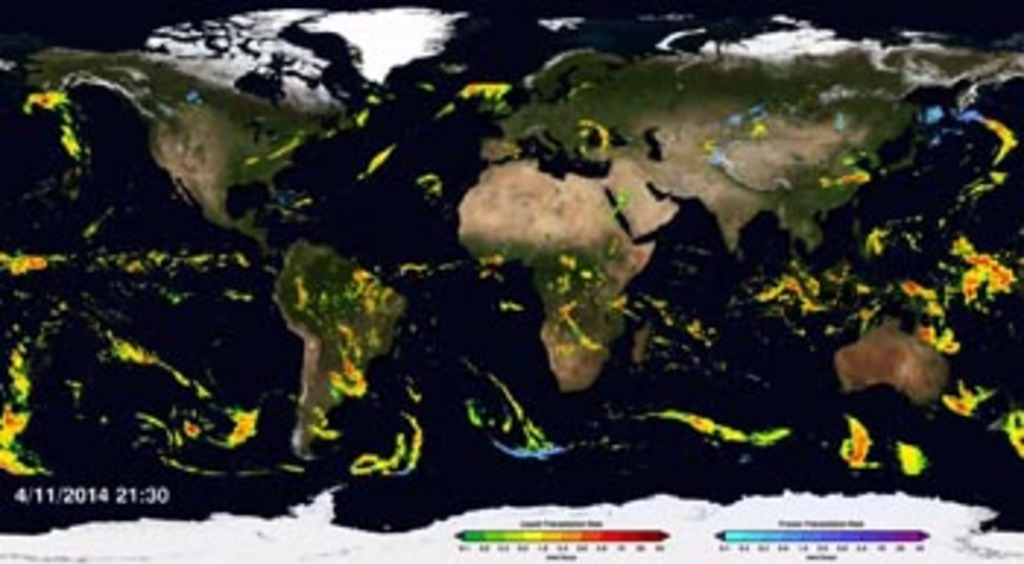
Color bar for frozen precipitation rates (eg, snow rates). Shades of cyan represent low amounts of frozen precipitation, whereas shades of purple represent high amounts of precipitation.

Color bar for liquid precipitation rates (ie, rain rates). Shades of green represent low amounts of liquid precipitation, whereas shades of red represent high amounts of precipitation.

Print resolution still of GPM/GMI precipitation measurements in conjunction with GOES (semi-transparent) cloud cover as the storm churns off the East coast dumping snow over part of New England.
Print resolution still of GPM/GMI and DPR data over the Nor'easter as it sits offshore the New England coast.
Print resolution still showing a bisected view of the Nor'easter's precipitation rates. This view highlights one of the taller frozen precipitation features in the volumetric DPR data.
Print resolution still of the bisected storm. Notice the heavy amounts of precipitation (depicted in deep blue and red) in this bisected view.
Print resolution view of the Nor'easter showing a cross-section of the storm as it churned off the New England coast.
Print resolution still of the Nor'easter showing an angular cross-section of the storm.
Print resolution still showing a cross-section side-view of the Nor'easter.
Print resolution still of the Nor'easter showing a cross-section of the volumetric precipitation amounts.
Print resolution image of GPM/GMI precipitation rates. Notice the heavy snowfall amounts falling across Massachusetts, Connecticut, Rhode Island, and New York in the upper left corner.
Credits
Please give credit for this item to:
NASA's Scientific Visualization Studio
-
Animators
- Alex Kekesi (Global Science and Technology, Inc.)
- Greg Shirah (NASA/GSFC)
-
Producers
- Ryan Fitzgibbons (USRA)
- Rani Gran (NASA/GSFC)
-
Scientists
- Gail Skofronick Jackson (NASA/GSFC)
- Dalia B Kirschbaum (NASA/GSFC)
- George Huffman (NASA/GSFC)
-
Project support
- Laurence Schuler (ADNET Systems, Inc.)
- Ian Jones (ADNET Systems, Inc.)
-
Writer
- Ellen T. Gray (ADNET Systems, Inc.)
Release date
This page was originally published on Wednesday, January 28, 2015.
This page was last updated on Tuesday, November 14, 2023 at 12:05 AM EST.
Missions
This visualization is related to the following missions:Series
This visualization can be found in the following series:Datasets used in this visualization
-
[GOES: IR4]
ID: 33 -
Rain Rates (Surface Precipitation) [GPM: GMI]
ID: 822Credit: Data provided by the joint NASA/JAXA GPM mission.
See all pages that use this dataset -
Volumetric Precipitation data (Ku) [GPM: DPR]
ID: 830Credit: Data provided by the joint NASA/JAXA GPM mission.
See all pages that use this dataset
Note: While we identify the data sets used in these visualizations, we do not store any further details, nor the data sets themselves on our site.
Related
- ID: 11826
 Produced Video
 - ID: 11746
 Produced Video