50 Kilometers of Brazilian Forest Canopy
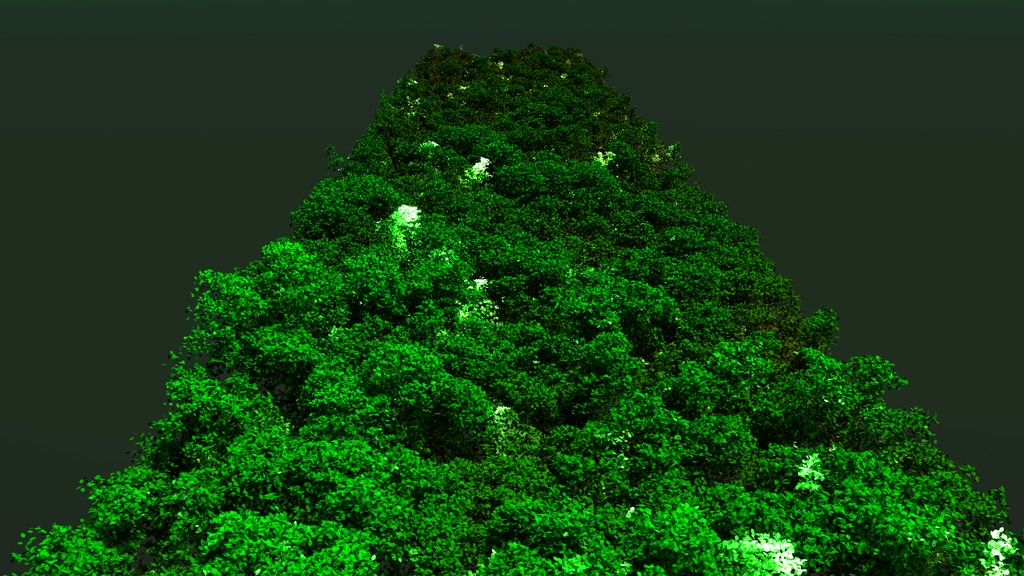
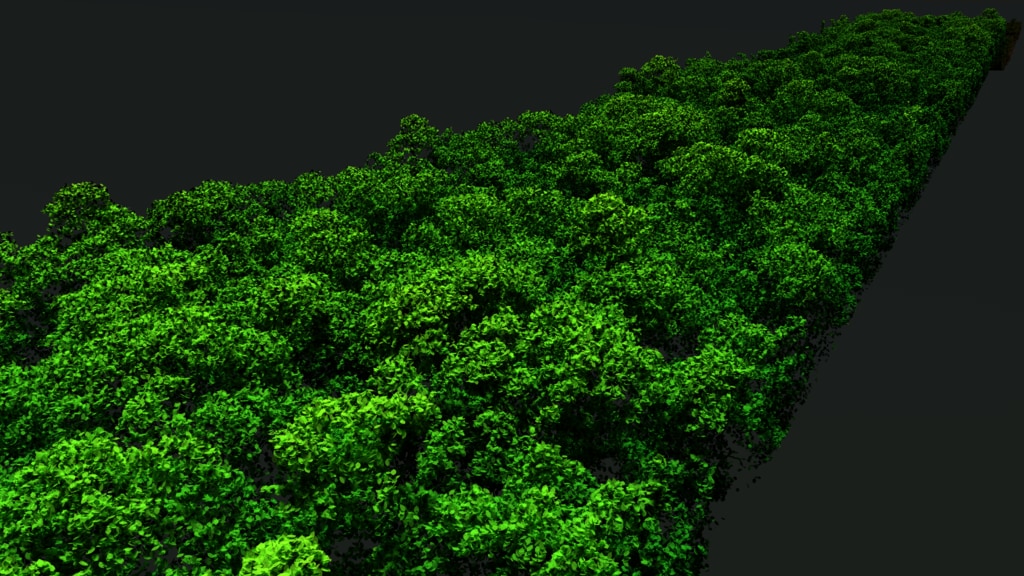
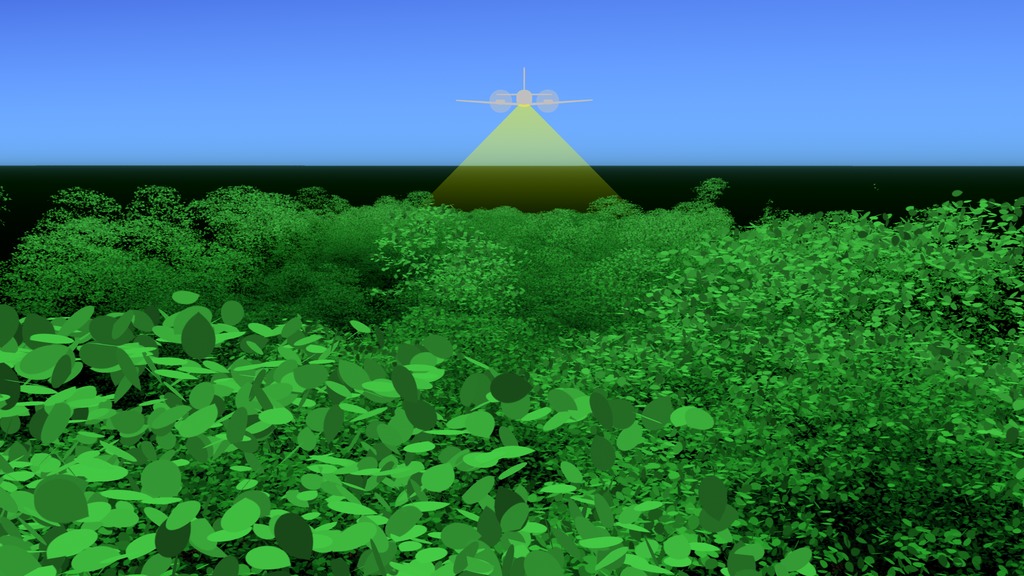
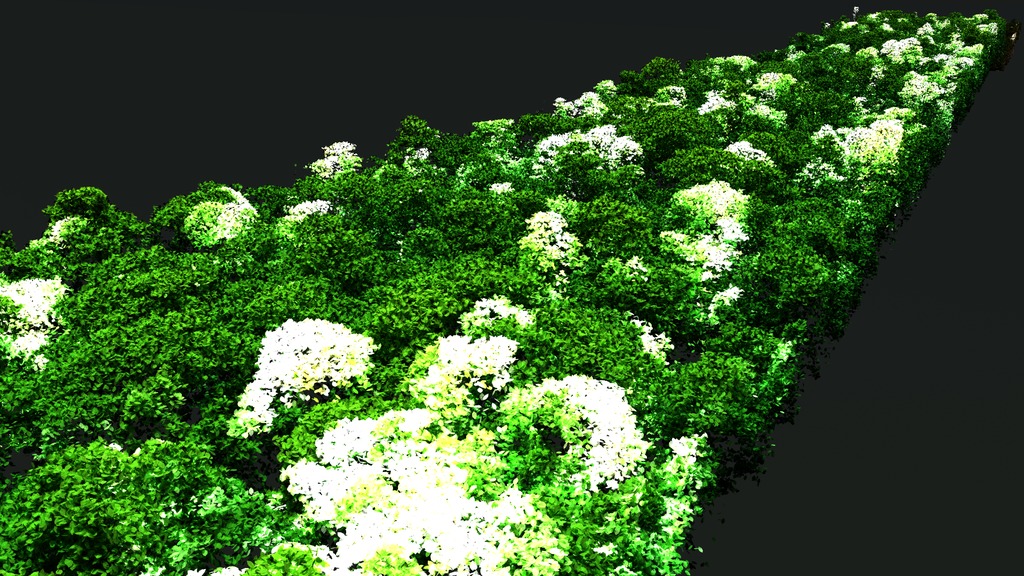
This visualization shows an airplane collecting a 50 kilometer swath of lidar data over the Brazilian rainforest. For ground level features, colors range from deep brown to tan. Vegetation heights are depicted in shades of green, where dark greens are closest to the ground and light greens are the highest.
Full 50 kilometer transect of 2014 lidar data over Brazil. The full swath of data consists of approximately 1 billion data points, where each data point is a position in 3D space. Together these data points provide scientists with information on foliage distribution and the elements of tree canopy. For more information on NASA Goddard's Lidar project, please visit http://gliht.gsfc.nasa.gov
Credits
Please give credit for this item to:
NASA's Scientific Visualization Studio
-
Data visualizers
- Alex Kekesi (Global Science and Technology, Inc.)
- Greg Shirah (NASA/GSFC)
-
Scientists
- Doug C. Morton (NASA/GSFC)
- Veronika Leitold (University of Maryland)
-
Technical support
- Laurence Schuler (ADNET Systems, Inc.)
- Ian Jones (ADNET Systems, Inc.)
Release date
This page was originally published on Tuesday, June 12, 2018.
This page was last updated on Wednesday, November 15, 2023 at 12:10 AM EST.
Series
This visualization can be found in the following series:Datasets used in this visualization
-
LiDAR (LiDAR 3D point cloud) [Airplane: G-LiHT]
ID: 965
Note: While we identify the data sets used in these visualizations, we do not store any further details, nor the data sets themselves on our site.
Related
- ID: 12398
 Produced Video
 - ID: 4532
 Visualization
 - ID: 4650
 Visualization
 - ID: 4651
 Visualization
 - ID: 4652