GPM/GMI First Light
Eleven days after the Feb. 27 launch of the Global Precipitation Measurement (GPM) Core Observatory, the two instruments aboard took their first joint images of an interesting precipitation event. On March 10, the Core Observatory passed over an extra-tropical cyclone about 1055 miles (1700 kilometers) due east of Japan's Honshu Island. The storm formed from the collision of a cold front wrapping around a warm front, emerging over the ocean near Okinawa on March 8. It moved northeast over the ocean south of Japan, drawing cold air west-to-east over the land, a typical winter weather pattern that also brought heavy snow over Hokkaido, the northernmost of the four main islands. After the GPM images were taken, the storm continued to move eastward, slowly intensifying before weakening in the central North Pacific.
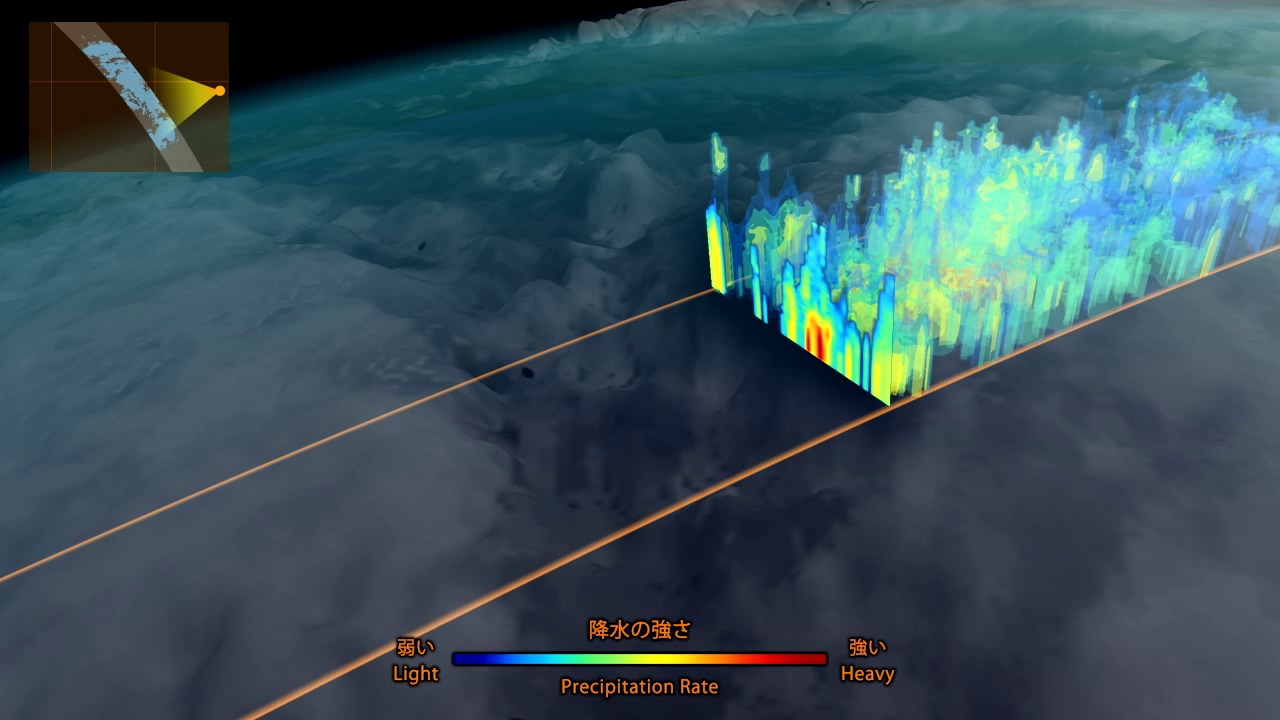
This visualization shows data from the GPM Microwave Imager, which observes different types of precipitation with 13 channels. Scientists analyze that data and then use it to calculate the light to heavy rain rates and falling snow within the storm.
For more information on this topic:
GPM web site
Other multimedia items related to this story:
GPM GMI First Light (#11508)
GPM DPR First Light (#11509)
This animation shows GPM collecting some of it's very first data on March 10th over a Pacific storm east of Japan. The animation begins with GPM collecting 37 GHz horizontally polarized brightness temperature data over the storm (in shades of aquamarine). All of GPM's 13 bands are then spread out to reveal the entire range of brightness temperature data. This data then collapses into rain rates for this storm, which are colored in a rainbow spectrum going from blue (low values) to dark red (high values). As the camera pulls out, GPM continues traversing the globe showing rain rates for the remainder of the swath.
This animation rides along with the satellite revealing 37 GHz horizontally polarized Brightness Temperature data over the ground (in shades of aquamarine) as the satellite goes through one orbit.
This animation rides along with the satellite revealing rain rates (in a rainbow colormap, where blue is low, and dark red is high) as the satellite goes through one orbit.
All multimedia items from this point on are print stills.

Print resolution still of GPM/GMI collecting 37 GHz horizontally polarized Brightness Temperature data (colored in shades of aquamarine) on March 10th over a Pacific storm east of Japan.
Print resolution still of all 13 GPM/GMI bands grouped according to the kinds of precipitation that they help detect. This image shows the brightness temperature data from GMI’s 13 passive microwave channels. From left to right the channels are 10.6 GHz vertical polarization (V), 10.6 horizontal polarization (H), 18.7 V, 18.7 H, 23 V, 37 V, 37 H, 89 V, 89 H, 166 V, 166 H, 183±3 V, 183±7 V GHz and are labeled thusly. Frequencies between 10-23 GHz are sensitive primarily to liquid rain, between 36-89 GHz the channels are sensitive to both liquid and frozen precipitation, while the high frequencies are sensitive to frozen (snow) precipitation.
Print resolution still of all 13 GPM/GMI bands grouped according to the kinds of precipitation that they help detect. The 5 bands to the left are sensitive primarily to liquid rain. The middle 4 are sensitive to both liquid and frozen precipitation, and the rightmost 4 are sensitive to frozen (snow) precipitation, as the associated icons represent.
Print resolution still of all 13 GPM/GMI bands without additional annotations.
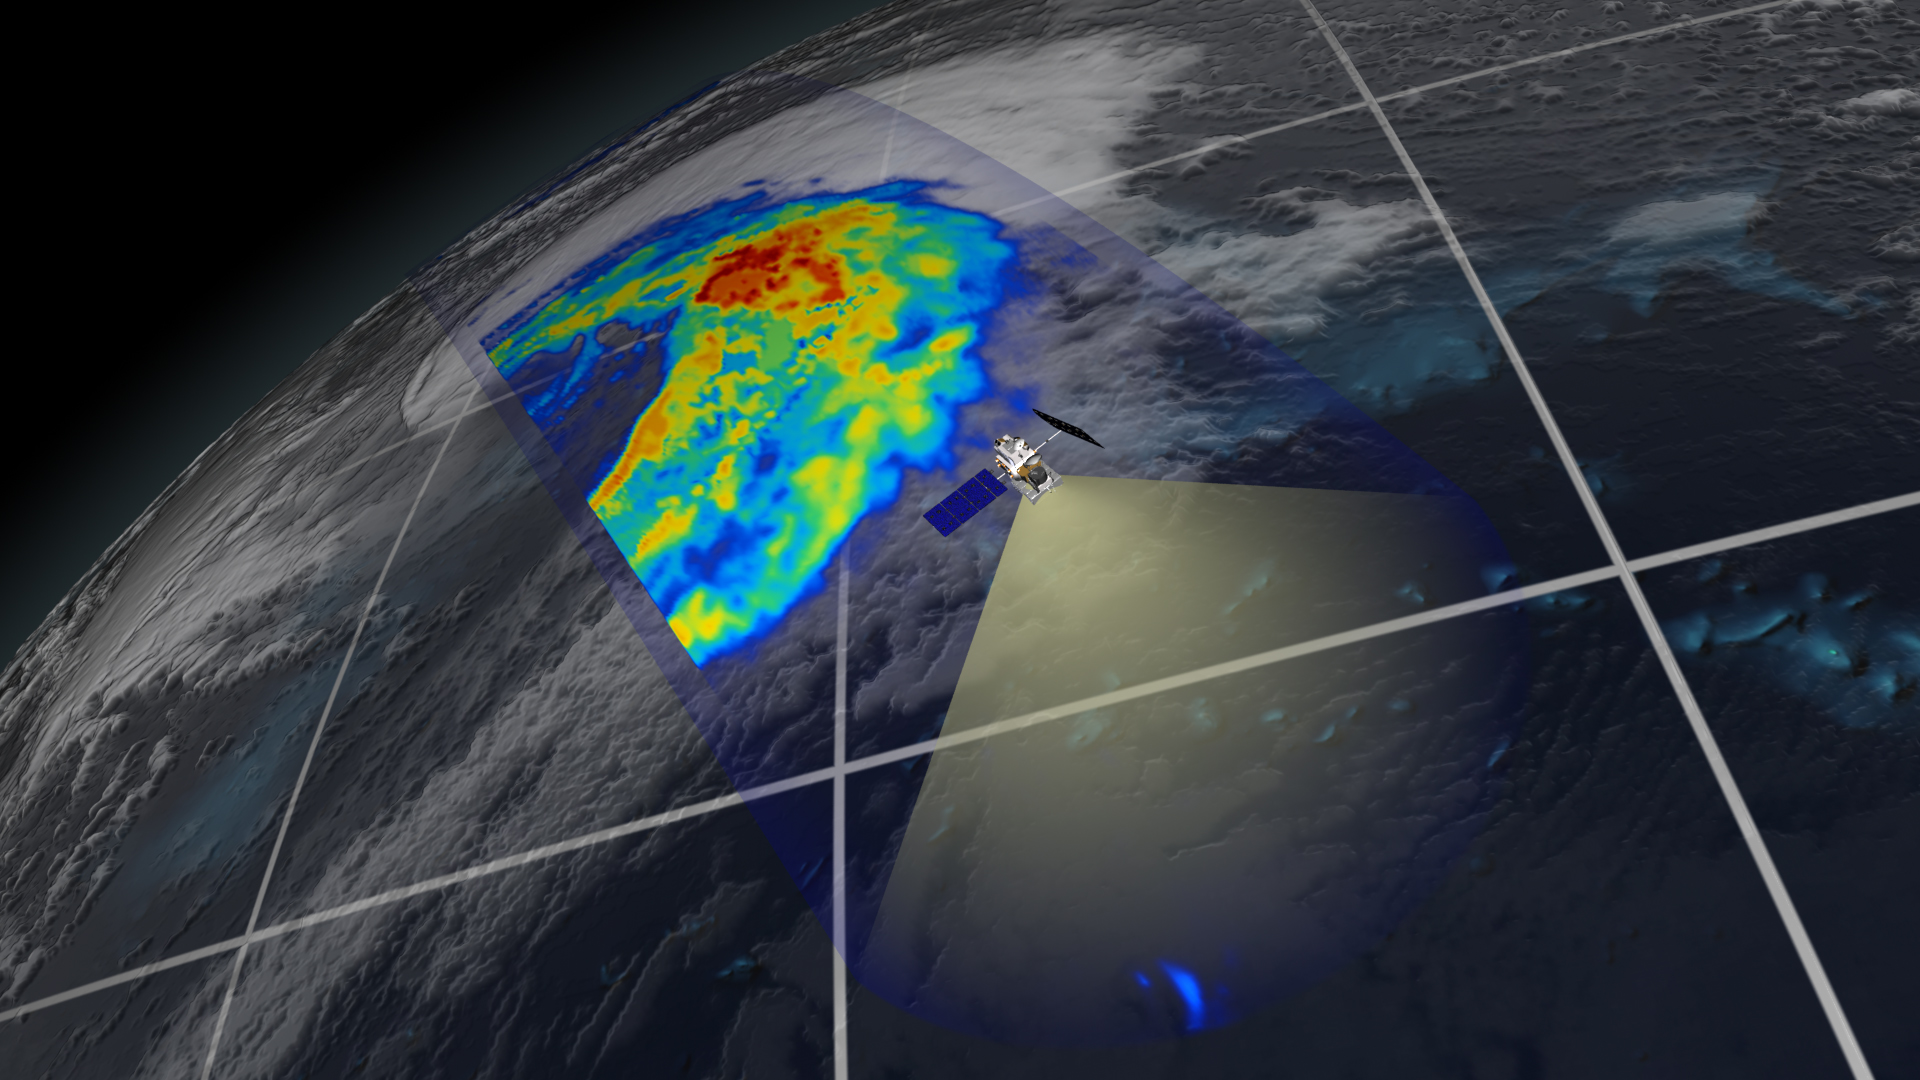
Print resolution still showing rain rates across a 550-mile (885 kilometer) wide swath of an extra-tropical cyclone observed off the coast of Japan on March 10, 2014. Red areas indicate heavy rainfall, while yellow and blue indicate less intense rainfall. The upper right blue areas indicate falling snow.
This image also includes an icon representing rain rates across a rainbow colored spectrum with blue on the left and dark red on the far right.
Print resolution still showing rain rates across a 550-mile (885 kilometer) wide swath of an extra-tropical cyclone observed off the coast of Japan on March 10, 2014. Red areas indicate heavy rainfall, while yellow and blue indicate less intense rainfall. The upper right blue areas indicate falling snow.
Print resolution still of the GPM rain rate swath spanning across the entire Pacific Ocean on March 10th.
Print resolution still of GPM collecting 37 GHz horizontally polarized Temperature Brightness data (colored in shades of aquamarine) on March 10th over a Pacific storm east of Japan.
Print resolution still showing rain rates across a 550-mile (885 kilometer) wide swath of an extra-tropical cyclone observed off the coast of Japan on March 10, 2014. Red areas indicate heavy rainfall, while yellow and blue indicate less intense rainfall. The upper left blue areas indicate falling snow.
Print resolution still showing a top down view of GPM/GMI's 37 GHz horizontally polarized Brightness Temperature swath (depicted in shades of aquamarine) as it cuts across from the top of the image down to the lower right. Japan can be seen in the center left portion of the image.
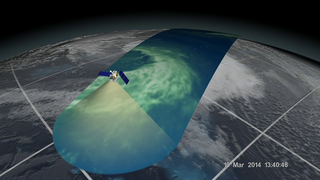
Print resolution still showing a top down view of GPM rain rate swath as it cuts across from the top center of the image down to the lower right. Red areas indicate heavy rainfall, while yellow and blue indicate less intense rainfall. The upper blue areas indicate falling snow. Japan can be seen in the center left portion of the image.
Print resolution still showing a top down view of GPM rain rate swath as it cuts across from the top center of the image down to the lower right. Red areas indicate heavy rainfall, while yellow and blue indicate less intense rainfall. The upper blue areas indicate falling snow. Japan can be seen in the center left portion of the image. No datestamp is shown in this image.
Print resolution icon used to symbolize liquid and frozen precipitation.
Print resolution icon used to symbolize frozen precipitation (ie, snow).
Print resolution icon used to symbolize rain rates.
Print resolution still showing a top down view of GPM rain rate swath as it cuts across from the top center of the image down to the lower right. Red areas indicate heavy rainfall, while yellow and blue indicate less intense rainfall. The upper blue areas indicate falling snow. Japan can be seen in the center left portion of the image. There is no timestamp with this image.
Credits
Please give credit for this item to:
NASA's Scientific Visualization Studio
-
Animators
- Alex Kekesi (Global Science and Technology, Inc.)
- Greg Shirah (NASA/GSFC)
- Ernie Wright (USRA)
-
Producers
- Ryan Fitzgibbons (USRA)
- Rani Gran (NASA/GSFC)
-
Scientists
- Gail Skofronick Jackson (NASA/GSFC)
- Dalia B Kirschbaum (NASA/GSFC)
- Chris Kidd (University of Maryland)
-
Project support
- Laurence Schuler (ADNET Systems, Inc.)
- Ian Jones (ADNET Systems, Inc.)
- Robert Simmon (Sigma Space Corporation)
- Jesse Allen (Sigma Space Corporation)
- John M. Kwiatkowski (George Mason University)
-
Writer
- Ellen T. Gray (ADNET Systems, Inc.)
Release date
This page was originally published on Tuesday, March 25, 2014.
This page was last updated on Wednesday, May 3, 2023 at 1:51 PM EDT.
Missions
This visualization is related to the following missions:Series
This visualization can be found in the following series:Datasets used in this visualization
-
[EO-1: ALI]
ID: 13This dataset can be found at: http://eo1.gsfc.nasa.gov/Technology/ALIhome1.htm
See all pages that use this dataset -
Brightness Temperature [GPM: GMI]
ID: 821Credit: Data provided by the joint NASA/JAXA GPM mission.
See all pages that use this dataset -
Rain Rates (Surface Precipitation) [GPM: GMI]
ID: 822Credit: Data provided by the joint NASA/JAXA GPM mission.
See all pages that use this dataset
Note: While we identify the data sets used in these visualizations, we do not store any further details, nor the data sets themselves on our site.
Related
- ID: 12494
 Produced Video
 - ID: 11470
 Produced Video
 - ID: 11508
 Produced Video
 - ID: 11509
 Produced Video