GPM DPR First Light
Images and animation from the GPM DPR first light.
Credit: JAXA
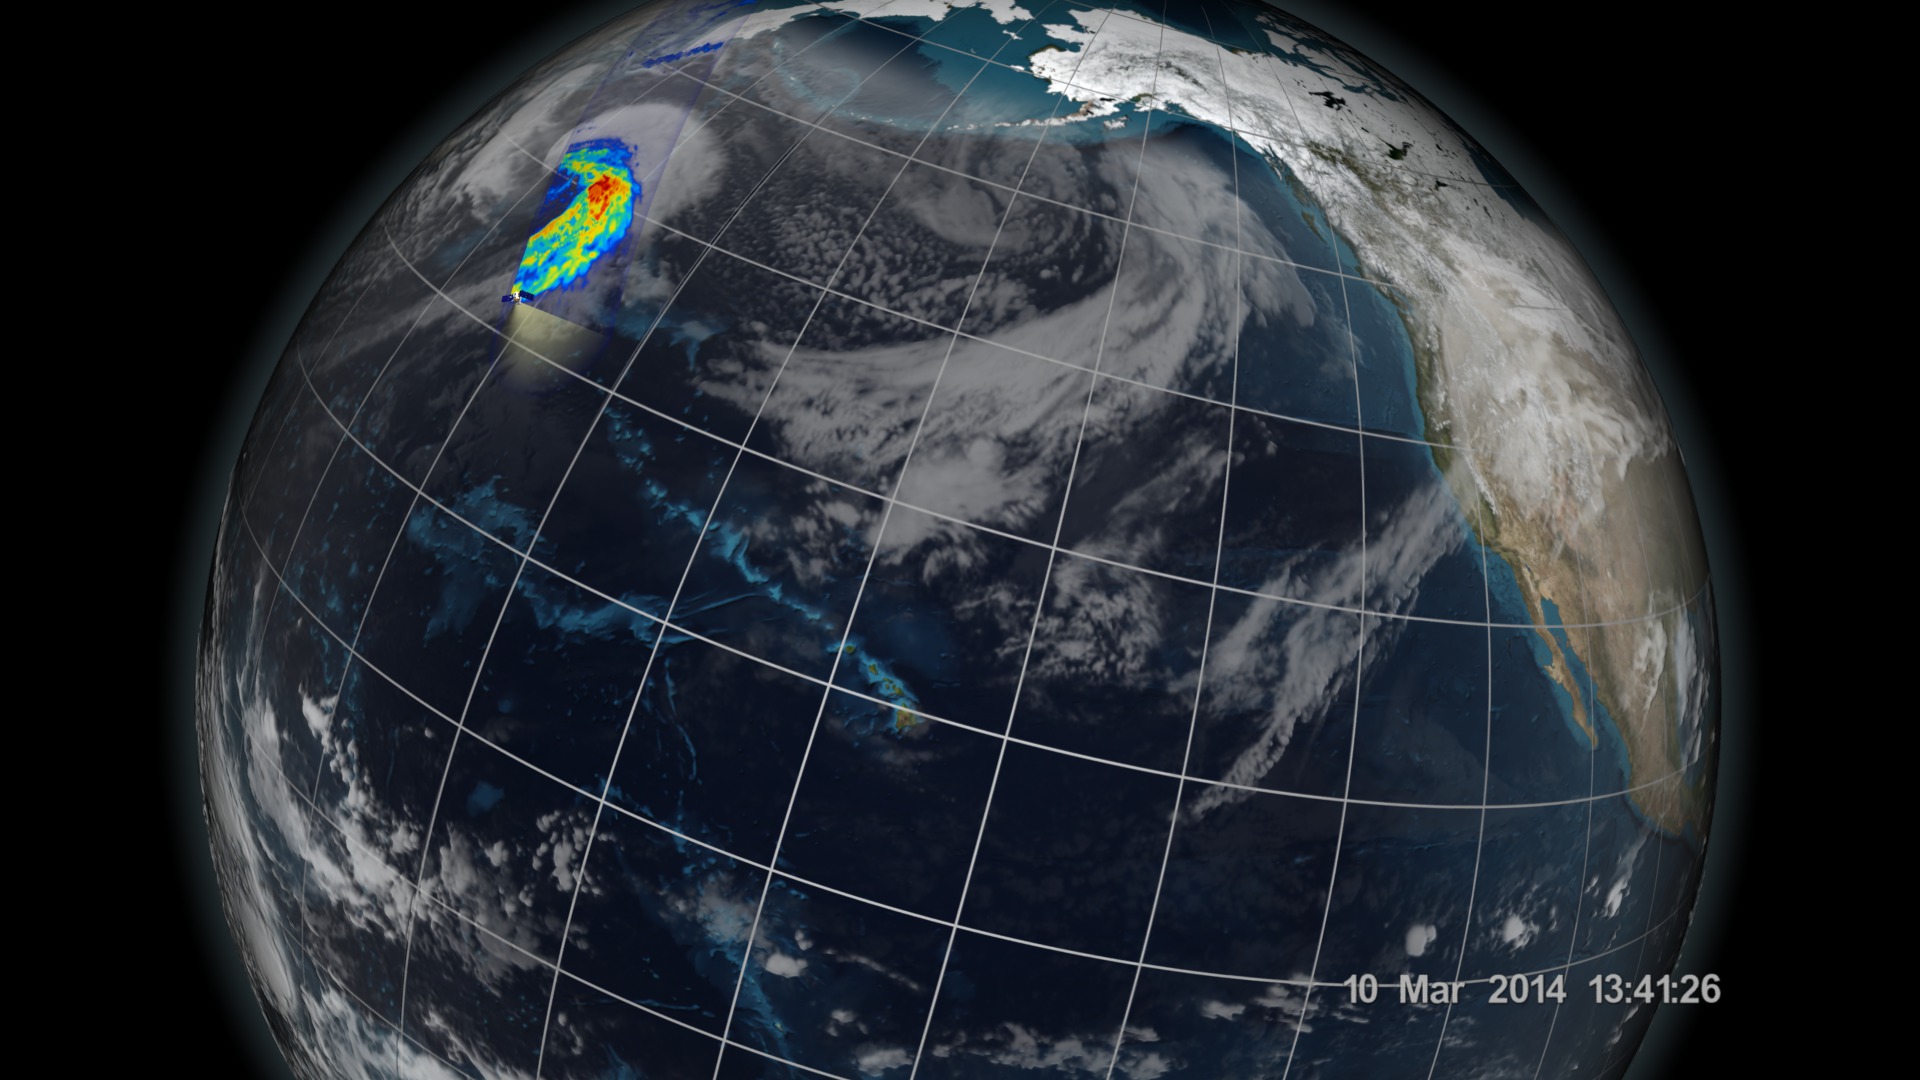
Extratropical cyclone in the Northwest Pacific observed by the Dual-frequency Precipitation Radar (DPR) on board the Global Precipitation Measurement (GPM) Core Observatory around 13:39Z on March 10th, 2014.

Credit: JAXA
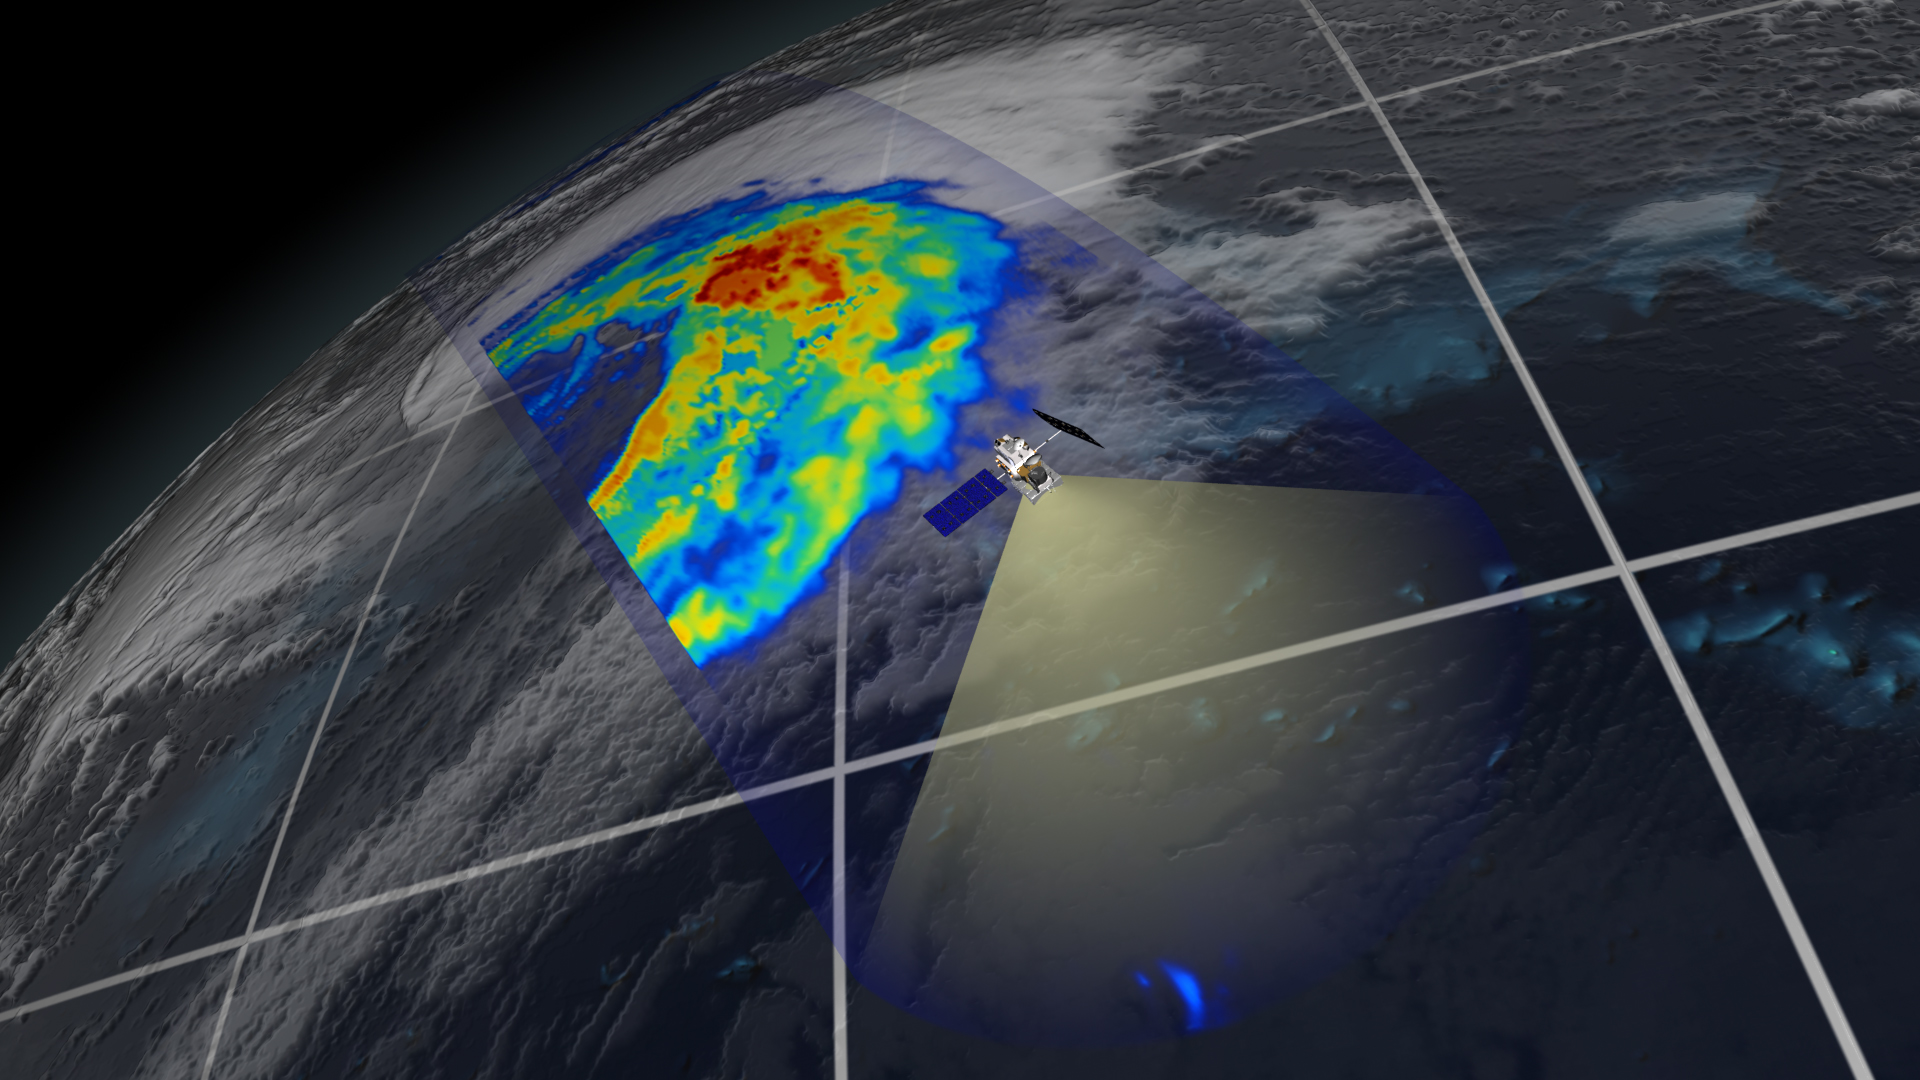
First data visualization of the three-dimensional structure of precipitation collected by the Dual-frequency Precipitation Radar aboard the Global Precipitation Measurement (GPM) mission's Core Observatory. The image shows rain rates across a vertical cross-section approximately 4.4 miles (7 kilometers) high through an extra-tropical cyclone observed off the coast of Japan on March 10, 2014. The DPR 152-mile (245 kilometers) wide swath is nested within the center of the GPM Microwave Imager's wider observation path. Red areas indicate heavy rainfall while yellow and blue indicate less intense rainfall.
The GPM Core Observatory collects precipitation information that unifies data from an international network of existing and future satellites to map global rainfall and snowfall every three hours.
Credit: JAXA
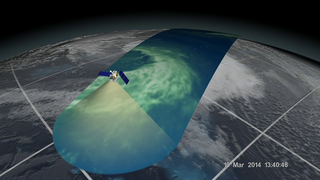
The Dual-frequency Precipitation Radar observes rainfall and snowfall that occurs within clouds in three dimensions, across the surface of the Earth and upward into the atmosphere. An extra-tropical cyclone was observed over the northwest Pacific Ocean off the coast of Japan on March 10, 2014.
The graph on the left shows the extra-tropical storm seen by the DPR as the satellite passed overhead. The x-axis is the east-west longitude and the y-axis is north-south latitude. The colors show the rain rate at sea-level, with more intense rainfall represented by red and lighter precipitation shown in blue. The line from A to B shows the location of the two cross-sections on the right.
The two sections on the right show the side-view of the storm from the surface, up into the atmosphere. This shows scientists the distribution of different precipitation types within the storm in three dimensions.
The colors show the radar reflectivity, the type of data returned by the DPR instrument that is interpreted by scientists analyzing the data and then used to calculate rain rates. The x-axis shows the distance in kilometers from point A in the lefthand graph. The y-axis shows height above the ocean in kilometers. The top image is the Ku-band radar frequency that is more sensitive to heavy and moderate rainfall. The bottom image is the Ka-band radar frequency that is more sensitive to light rain and snow. The most notable feature of these images is where the height of the heavier precipitation dips to the ocean surface at about 240 kilometers on the x-axis. This indicates a transition from rain on the right (reds and yellows) to falling snow on the left (blues and greens).
The GPM Core Observatory collects precipitation information that unifies data from an international network of existing and future satellites to map global rainfall and snowfall every three hours.
Credits
Please give credit for this item to:
NASA's Goddard Space Flight Center
-
Producer
- Ryan Fitzgibbons (USRA)
-
Project support
- Aaron E. Lepsch (ADNET Systems, Inc.)
Release date
This page was originally published on Tuesday, March 25, 2014.
This page was last updated on Wednesday, May 3, 2023 at 1:51 PM EDT.
Related
- ID: 11470
 Produced Video
 - ID: 4153
 Visualization
 - ID: 11508
 Produced Video
 - ID: 4135
 Visualization