How do we know for sure about Atmospheric Aerosols?
Dr. Brent Holben explains how NASA's program of global ground-based sun photometers measure aerosols at the surface and why those measurements are so vital to understanding the Earth's processes at the 2021 United Nations Climate Change Conference. Also available on YouTube
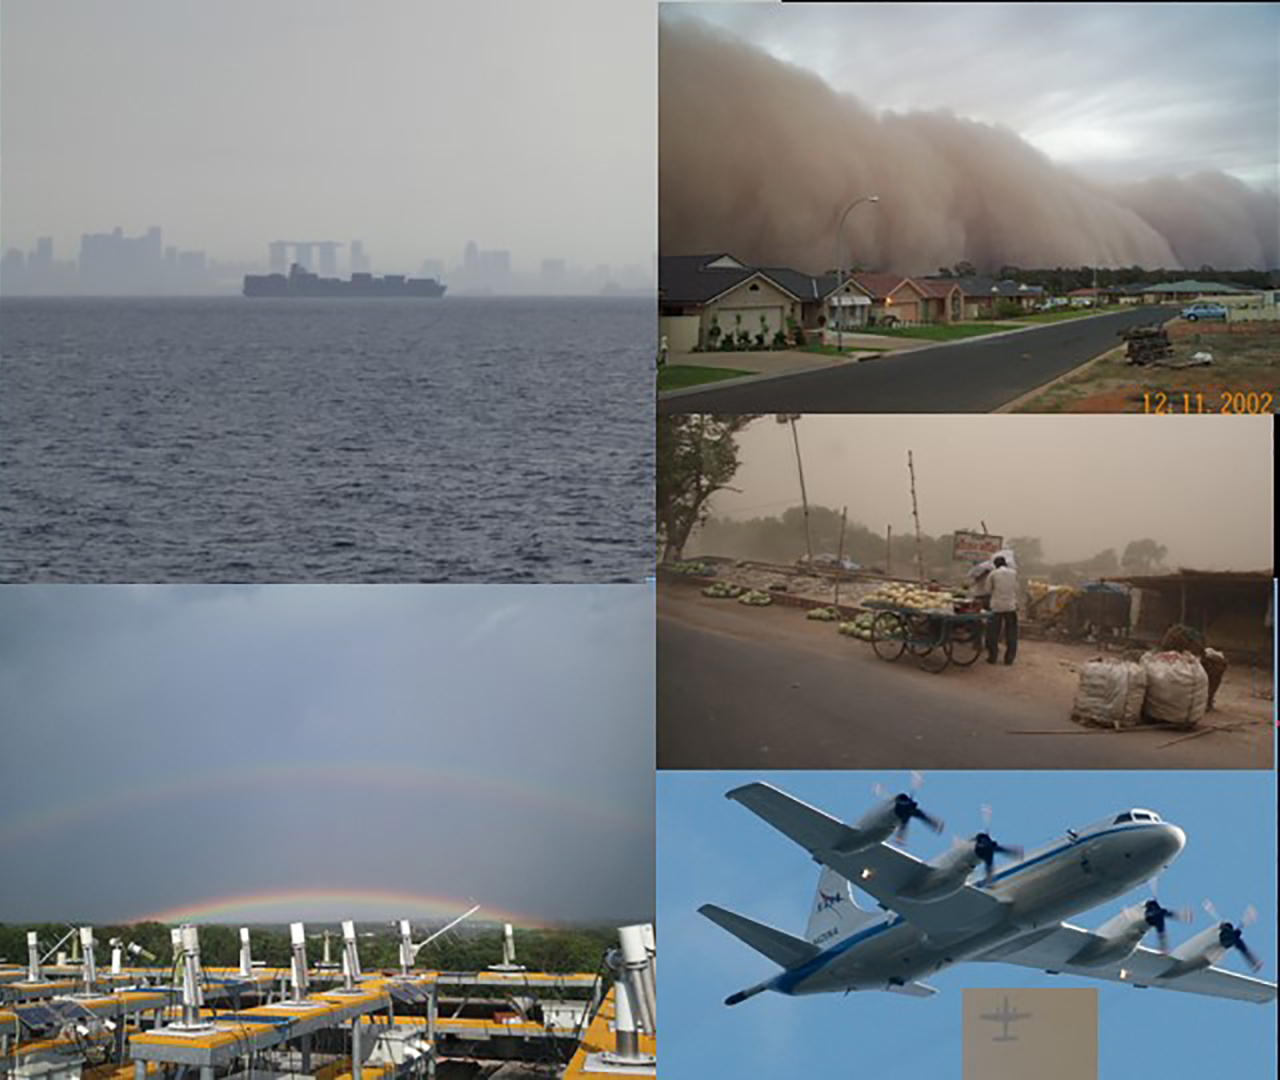
The Aerosol Robotic Network (AERONET) is one of the first places that scientists turn when volcanoes, wildfires, pollution plumes, dust storms and many other phenomena-both natural and manmade-make an appearance. The network of ground-based instruments, called sun photometers, measures the many tiny particles blowing about in the atmosphere called aerosols. The particles are often impossible to see with human eyes, but AERONET's sensors can detect their presence by measuring subtle fluctuations in sunlight as the particles reflect and scatter the sun's rays.
This presentation was given at the United States Center at the 2021 United Nations Climate Change Conference on Nov 10, 2021.
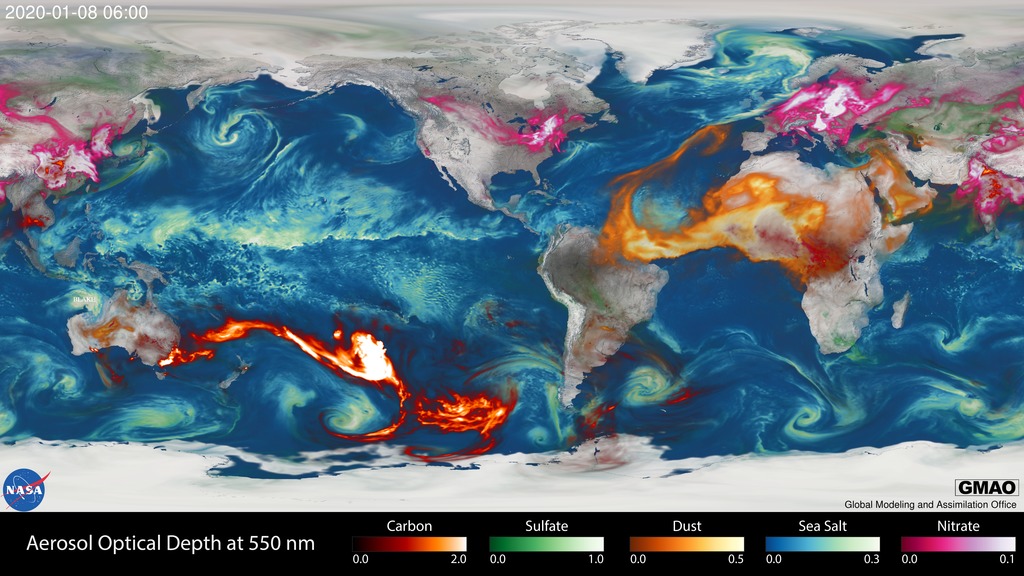
This visualization by Dr. Bill Putman shows the global distribution of aerosols, generated by NASA’s GEOS-FP data assimilation system, from August 1, 2019 to January 14,2020. Different aerosol species are highlighted by color, including dust (orange), sea-salt (blue), nitrates (pink), sulfates (green), and carbon (red), with brighter regions corresponding to higher aerosol amounts. More information is available about this animation at https://svs.gsfc.nasa.gov/31100

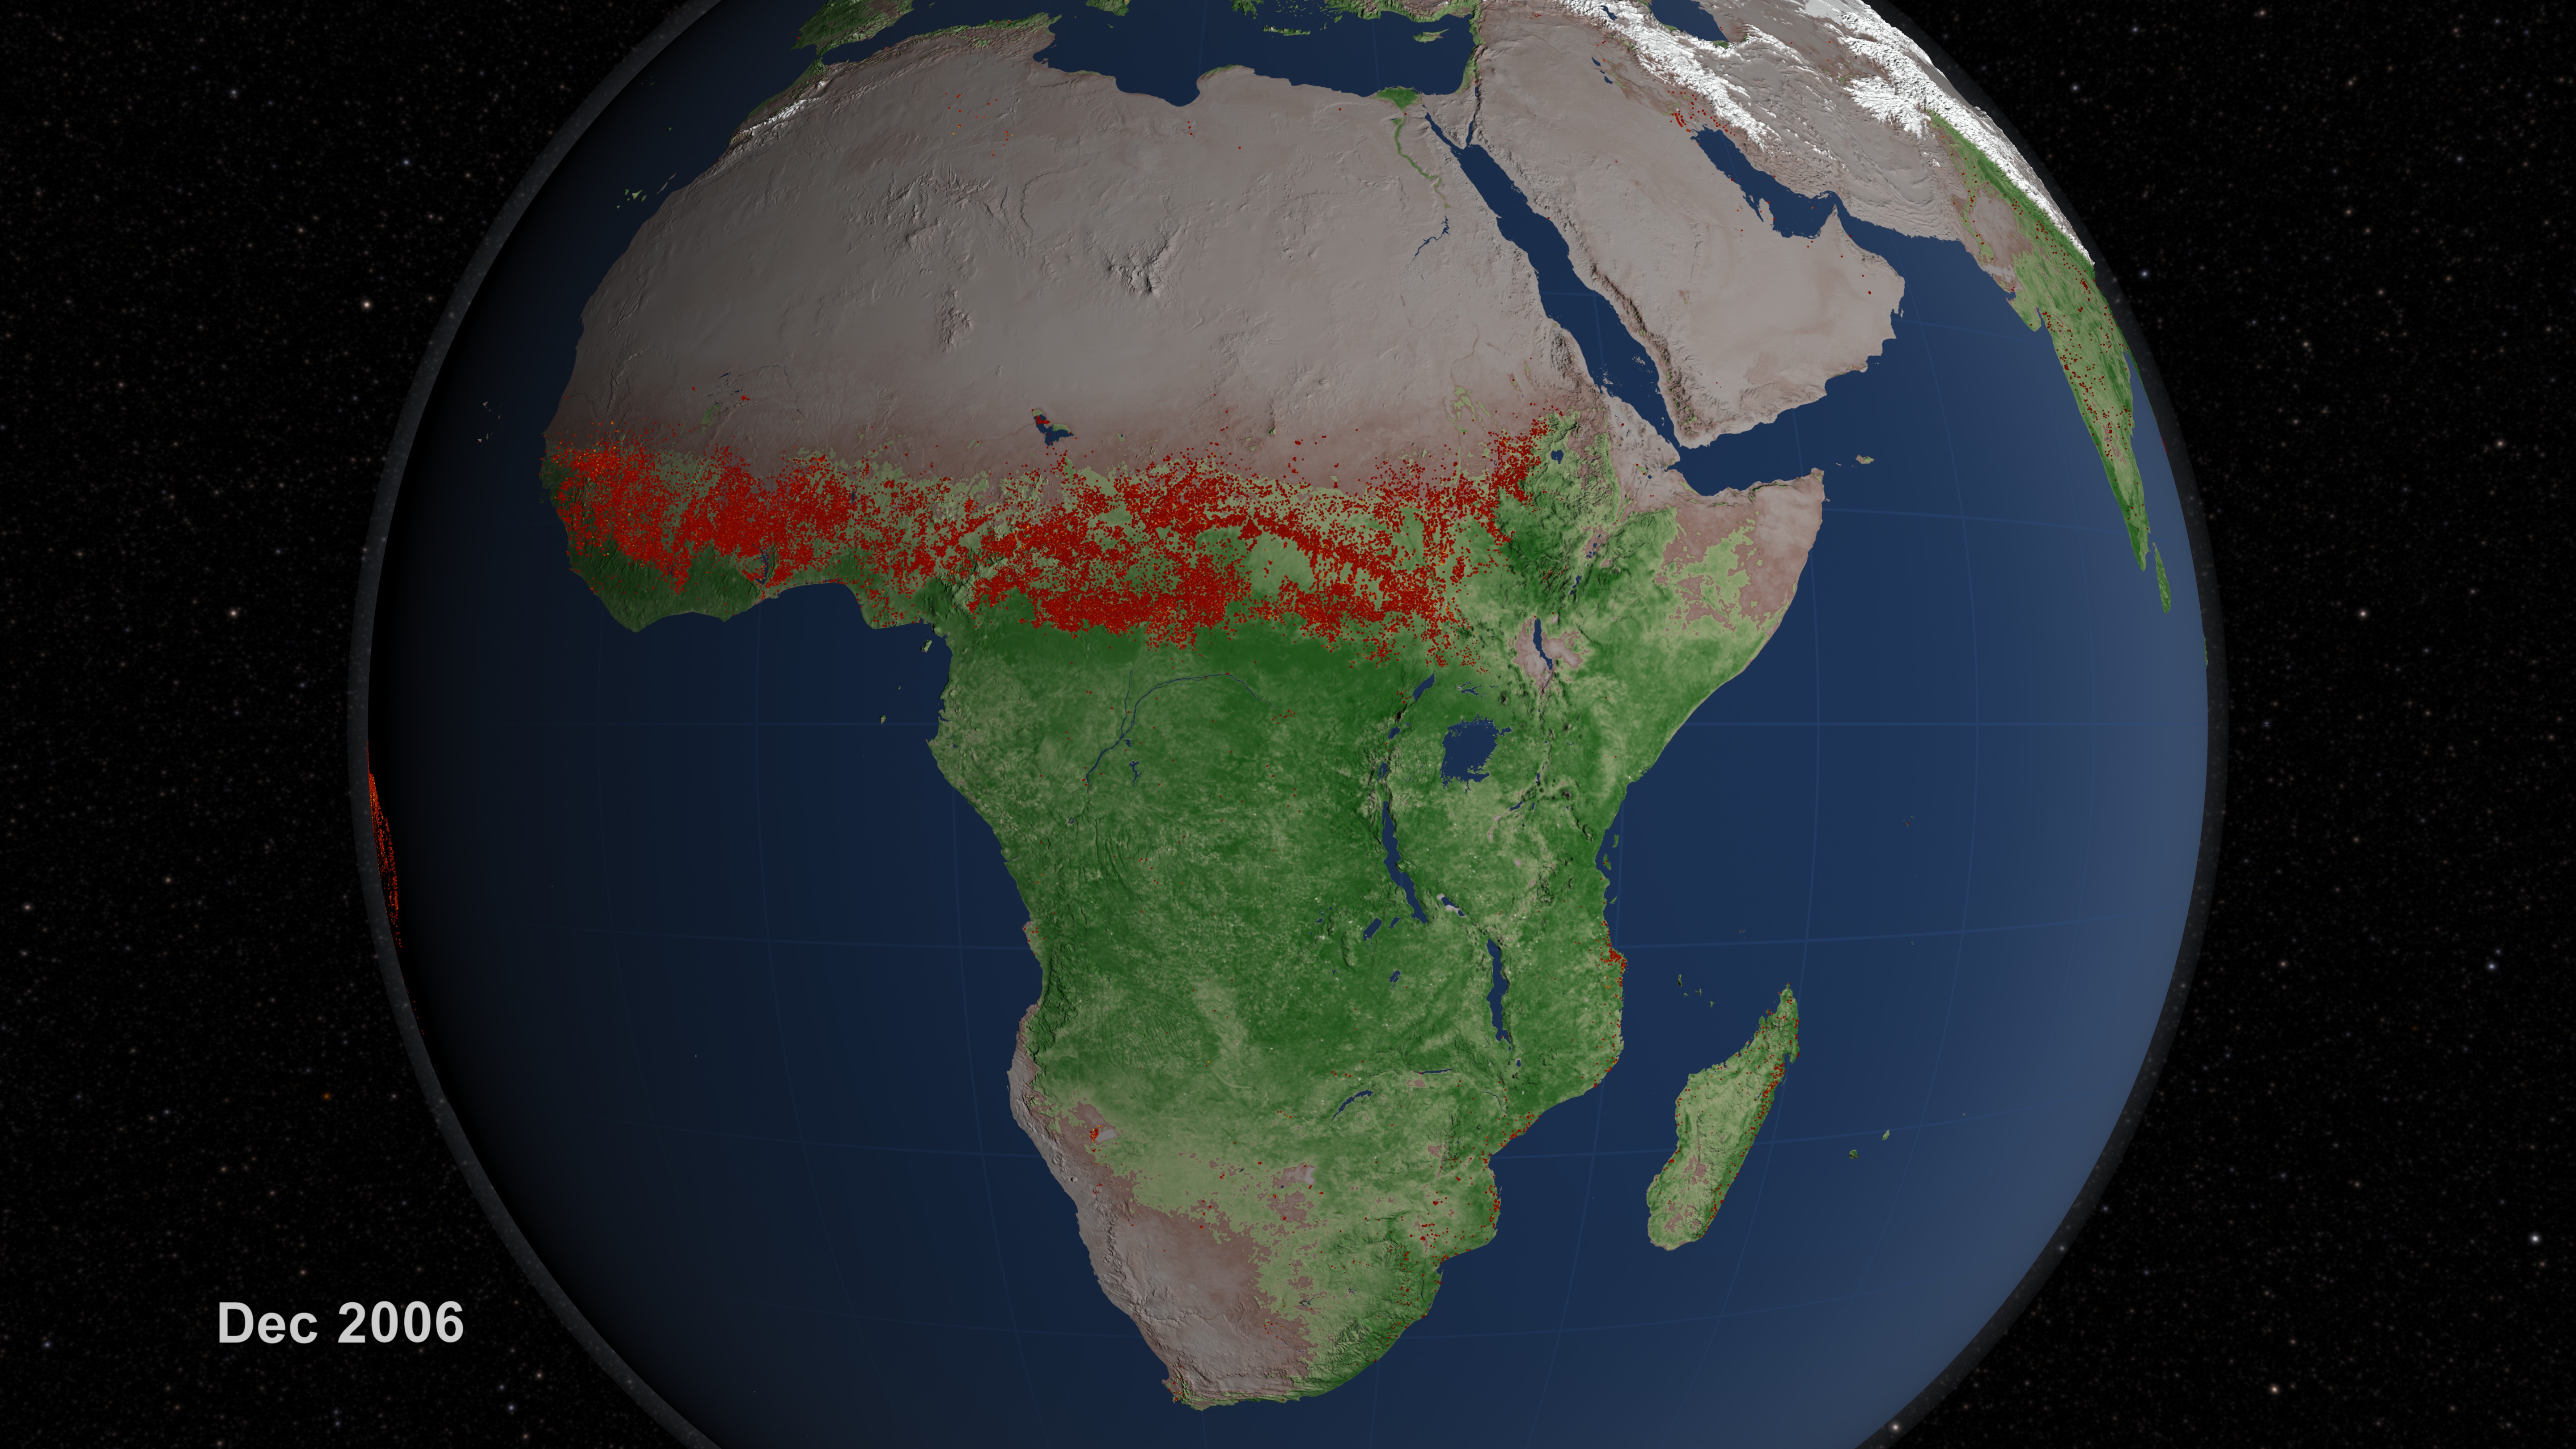
Fire and smoke and the African AERONET Team in Africa.

AERONET in Europe. The map shows red dots for every European AERONET observation site.

European AERONET sites
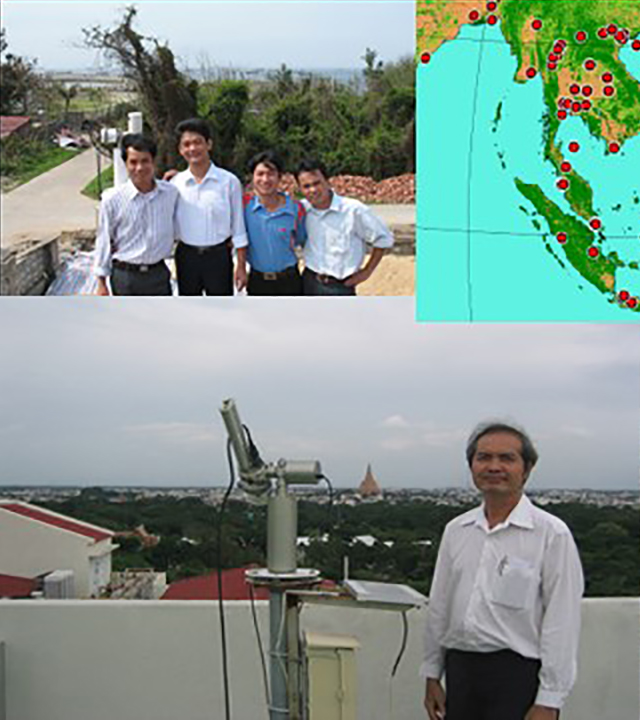
The 7 Seas AERONET sites. The map shows red dots for every observation installation in this region.
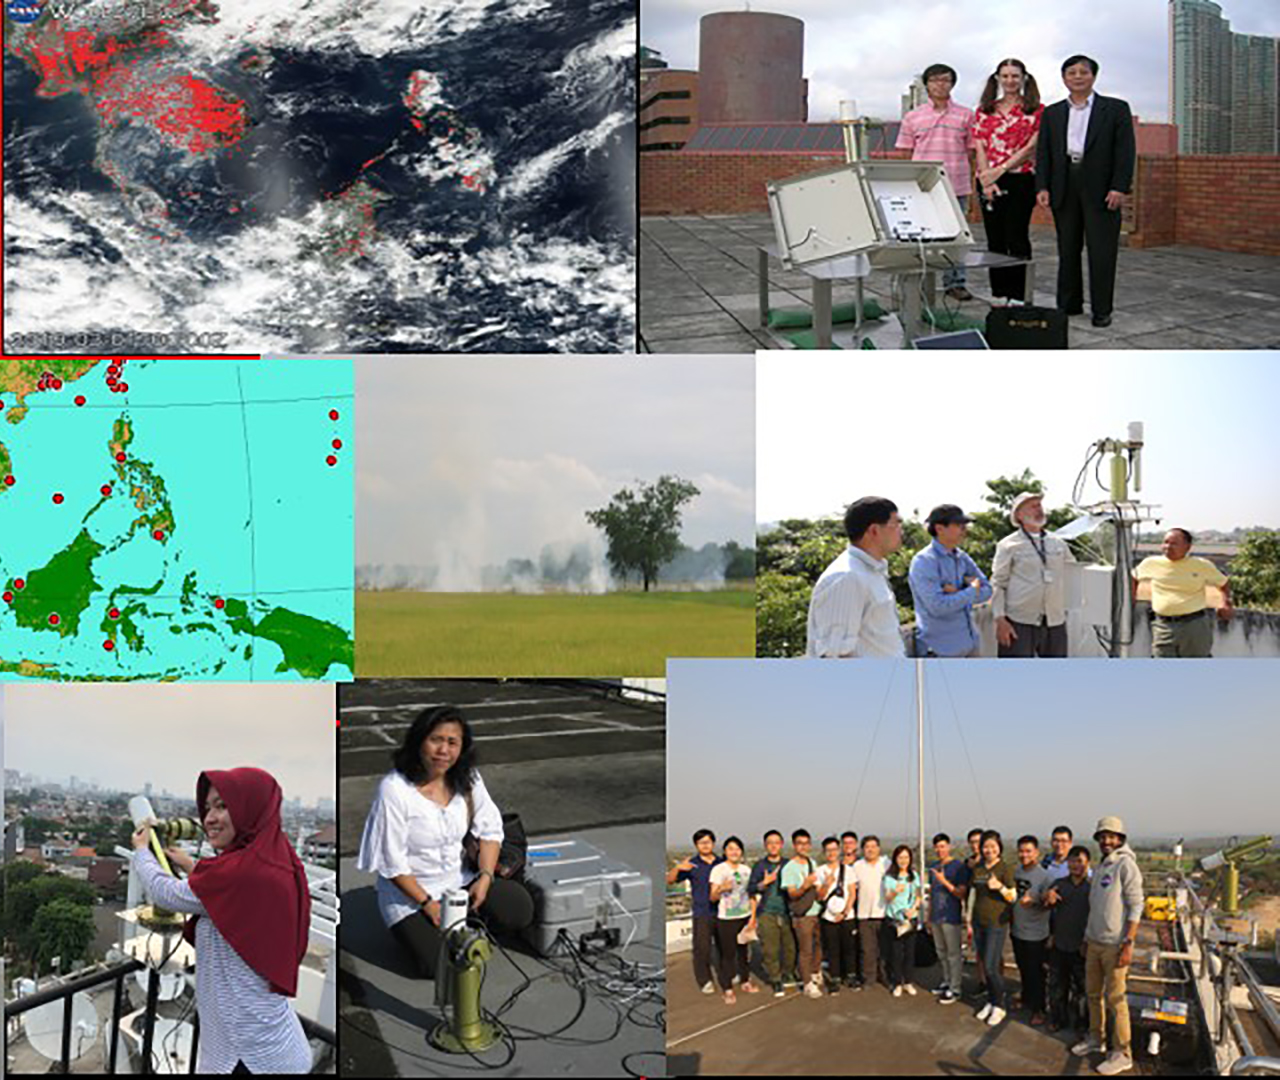
Images of the team of scientists from the AERONET installations in the 7 Seas region.
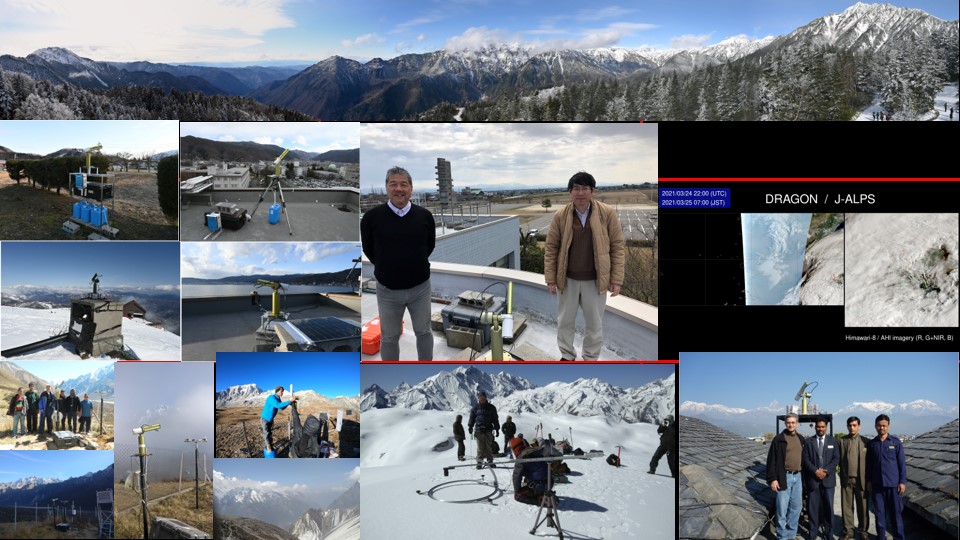
AERONET in the Japanese Alps. Topography changes the transport of aerosols and these direct measurements help scientists understand how aerosols move in high and low elevations.
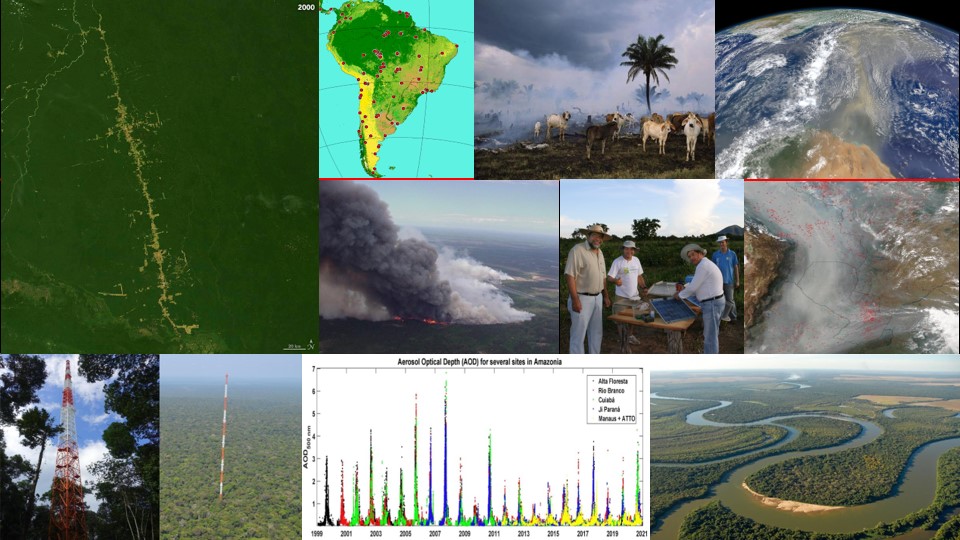
AERONET installation in South America. Rapid deforestation of the Amazon makes these measurements taken in South America even more critical to understanding the role global aerosols have on our planet.

AERONET helps the science community understand the role clouds play in our climate system.
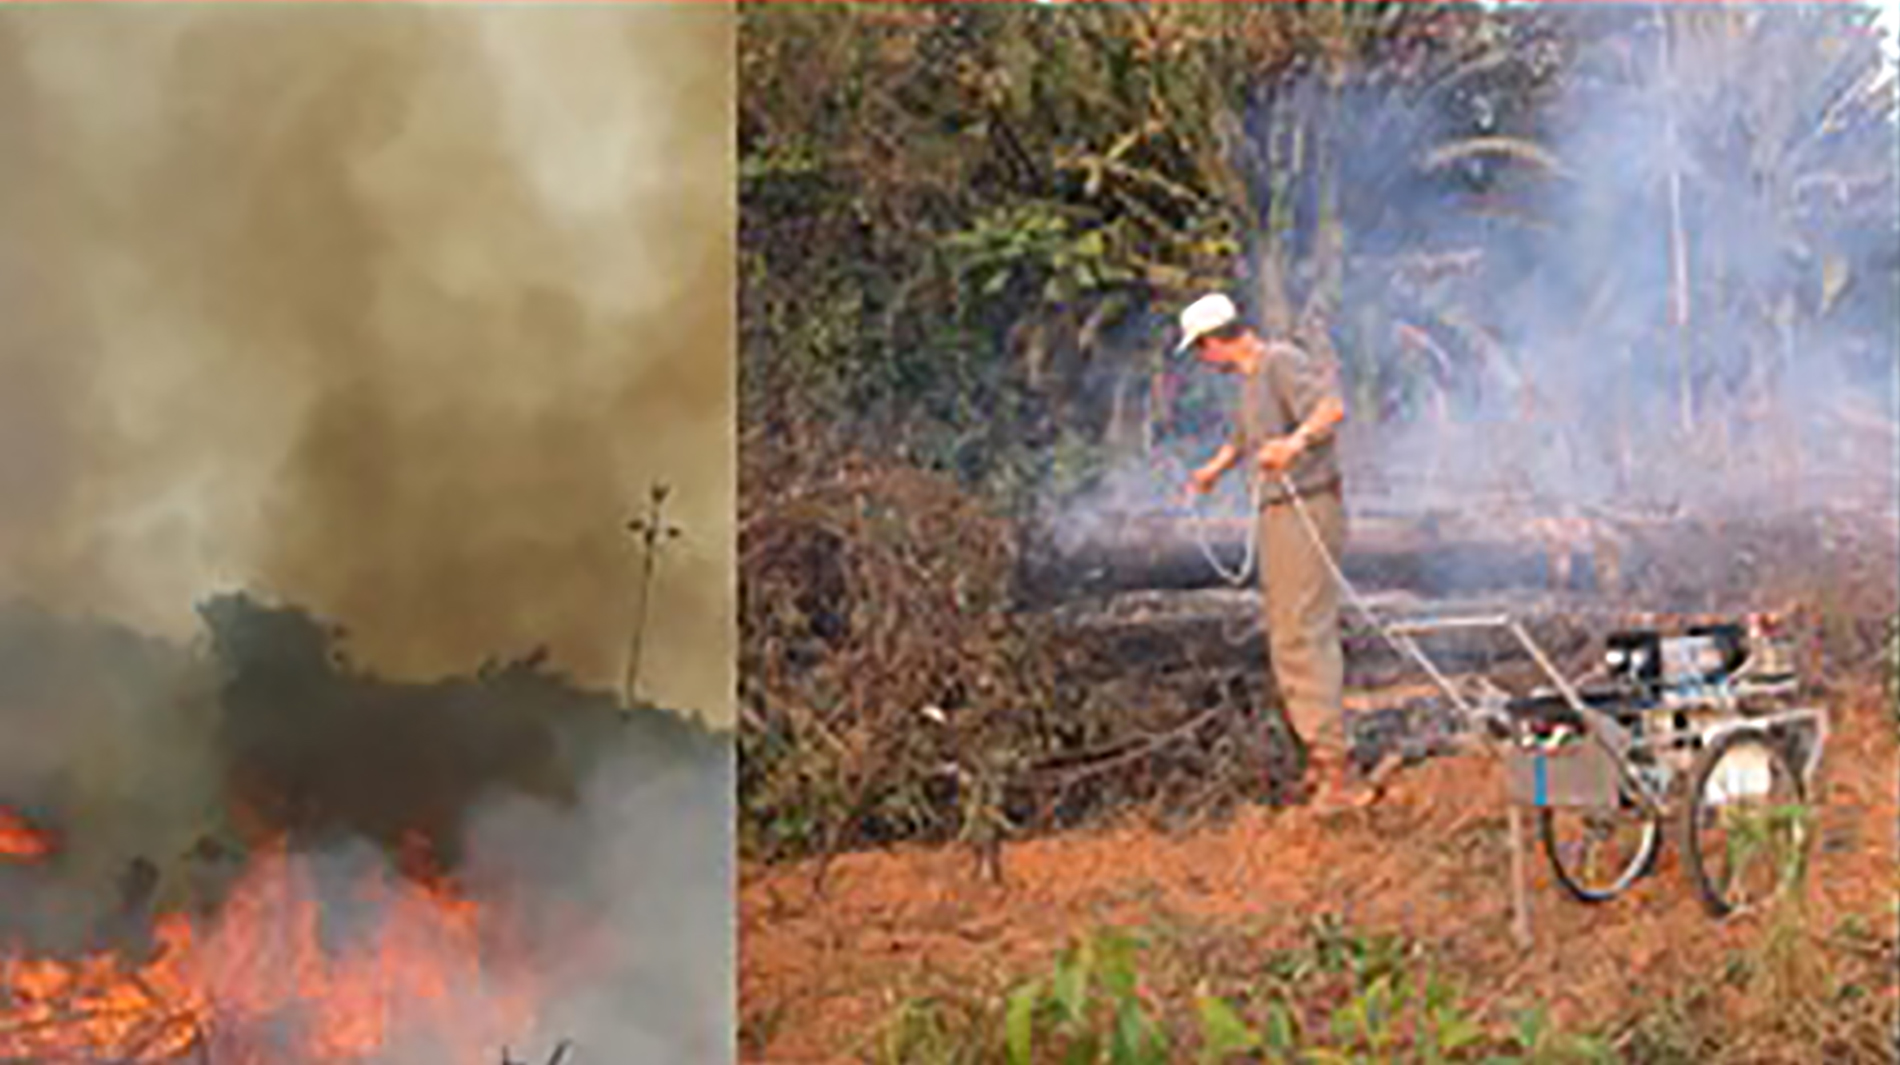
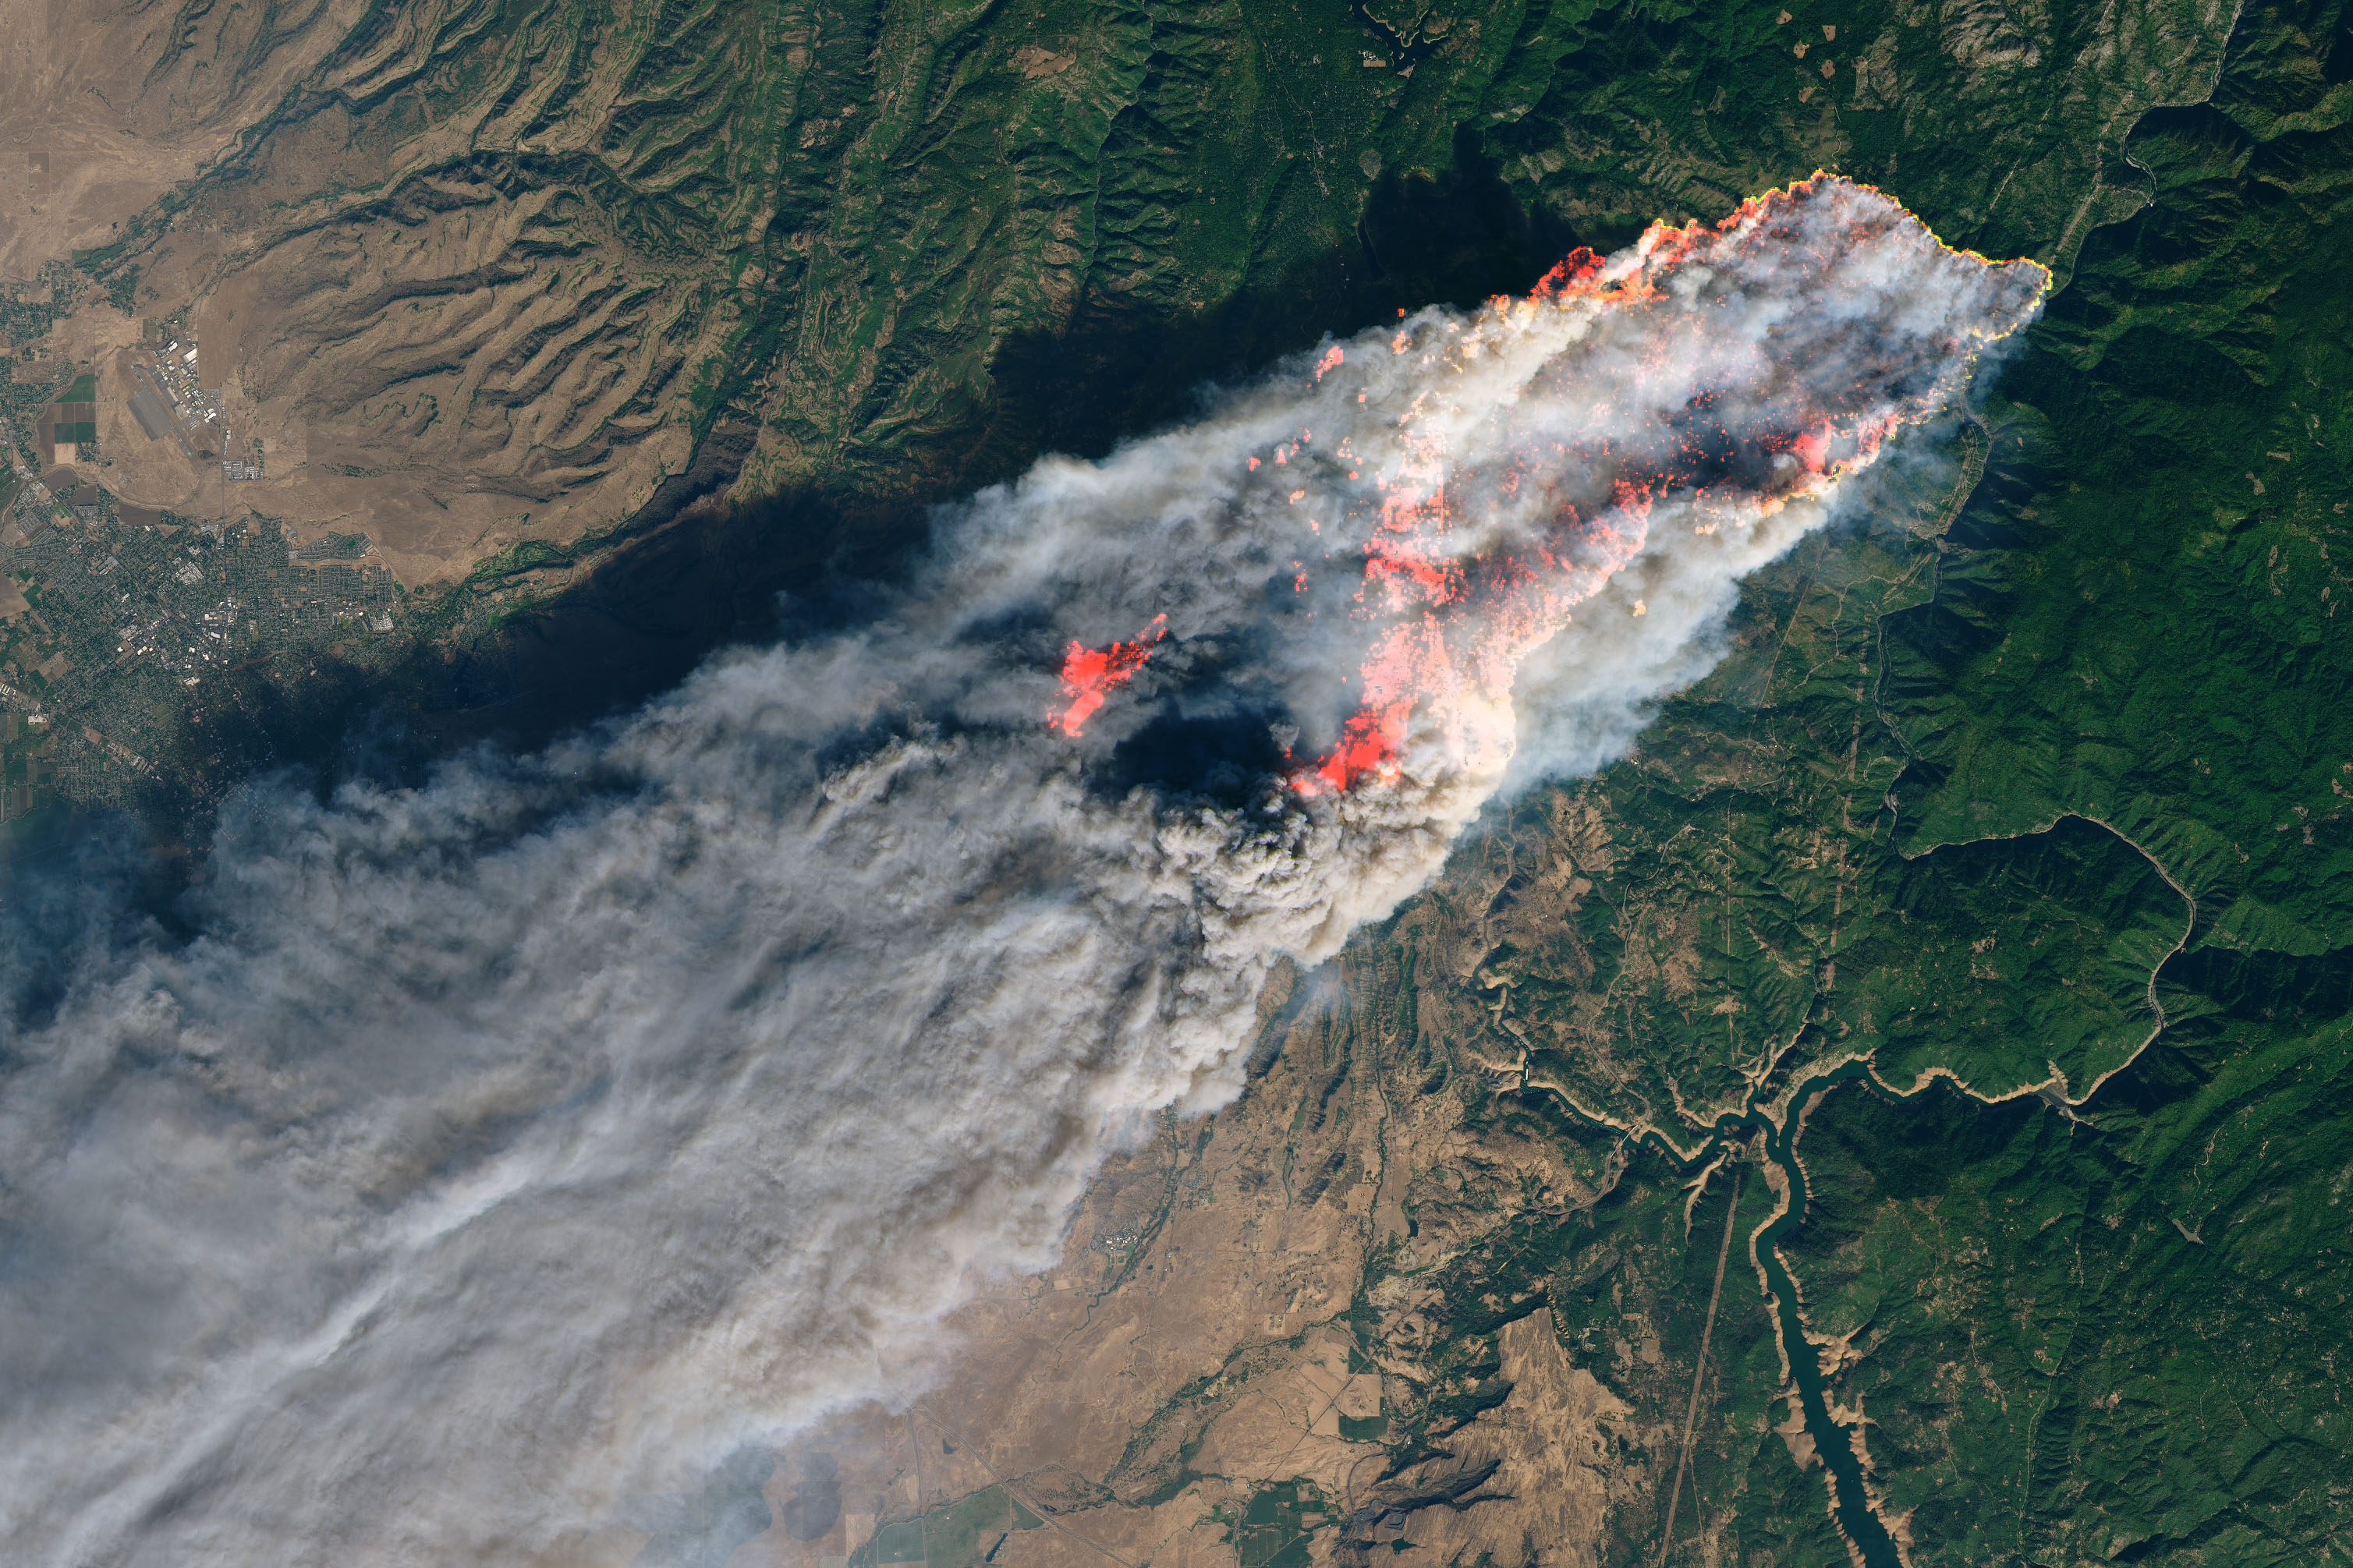
Fire and smoke
AERONET can detect unhealthy air quality
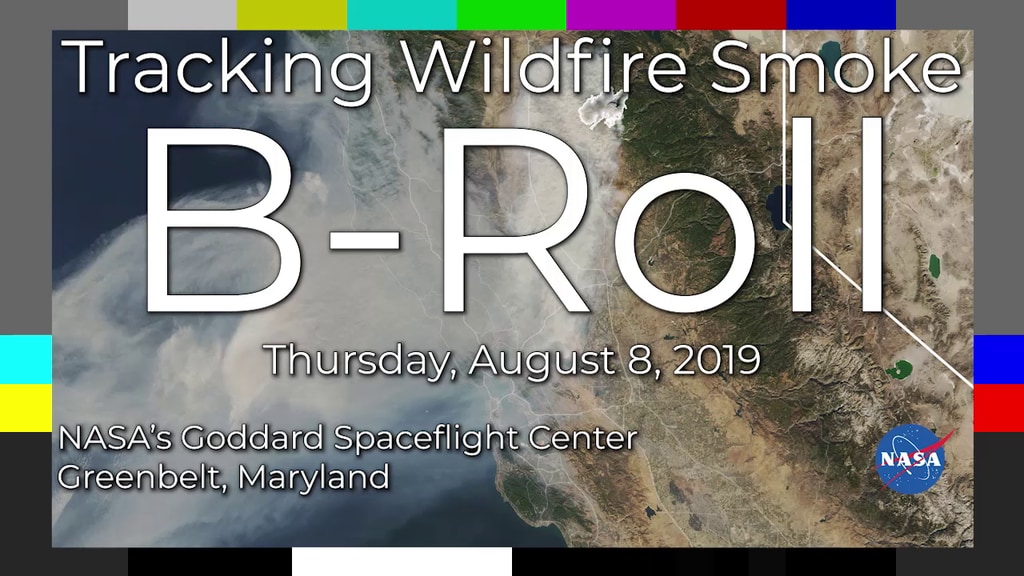
Video footage to support a NASA campaign to tracks wildfire smoke for improved Air Quality. More information is available about this at https://svs.gsfc.nasa.gov/13263

AERONET is only possible because of the cooperative efforts of the global AERONET community. Here are some of the people that make this data possible.From Clockwise, Beijing, Lille, Boulder, Valladolid, Greenbelt (GSFC). The photo above the Beijing group was contributed by Sharon J. Anderson, a story teller, taken at sunrise on Tuesday Oct. 5 on the Beltsville farm.
Credits
Please give credit for this item to:
NASA/Goddard Space Flight Center
-
Scientists
- Brent Holben (NASA/GSFC)
- David Giles (NASA)
- Alexander Smirnov (SSAI)
- Joel Schafer (SSAI)
- Gavin A. Schmidt (NASA/GSFC GISS)
-
Technical support
- Lori Perkins (NASA/GSFC)
- Marit Jentoft-Nilsen
- Eric Sokolowsky (Global Science and Technology, Inc.)
-
Videographers
- Michelle Williams (UMBC)
- Rob Andreoli (Advocates in Manpower Management, Inc.)
-
Animator
- Megan Willy (IRC/UMBC)
-
Video editor
- Brooke Harris (UMBC)
Release date
This page was originally published on Tuesday, December 14, 2021.
This page was last updated on Wednesday, May 3, 2023 at 1:43 PM EDT.
Series
This visualization can be found in the following series:Sources
- ID: 12772
![Tracking aerosols over land and water from August 1 to November 1, 2017. Hurricanes and tropical storms are obvious from the large amounts of sea salt particles caught up in their swirling winds. The dust blowing off the Sahara, however, gets caught by water droplets and is rained out of the storm system. Smoke from the massive fires in the Pacific Northwest region of North America are blown across the Atlantic to the UK and Europe. This visualization is a result of combining NASA satellite data with sophisticated mathematical models that describe the underlying physical processes.Music: Elapsing Time by Christian Telford [ASCAP], Robert Anthony Navarro [ASCAP]Complete transcript available.Watch this video on the NASA Goddard YouTube channel.](/vis/a010000/a012700/a012772/12772_hurricanes_and_aerosols_1080p_youtube_1080.00001_print.jpg) Produced Video
Produced Video - ID: 31100
 Hyperwall Visual
 - ID: 13263
- ID: 13253
 Produced Video
 - ID: 3868
 Visualization
 - ID: 10621
 Produced Video