Parker Solar Probe: The Origins of Switchbacks
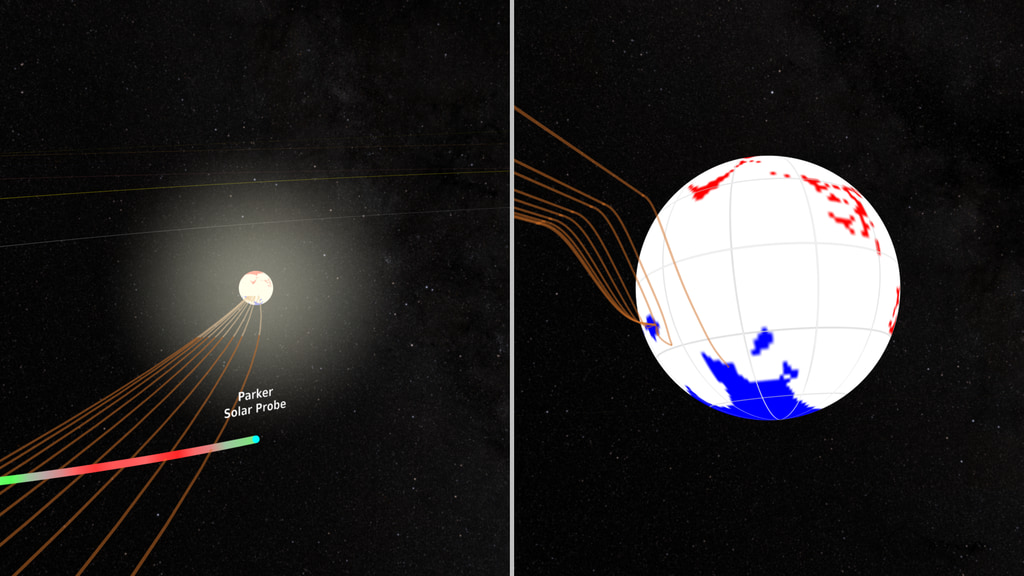
Most of the magnetic field measured at Parker during this time is directed sunward (blue field lines and vectors). A switchback occurs when the field changes direction almost 180 degrees for a short period of time. FIELDS instrument magnetic vector data are projected from the spacecraft position as arrows. The arrows are colored deep blue for sunward vectors, deep red for anti-sunward, and in between for directions off from this line. The heliospheric magnetic field lines are represented as gold.
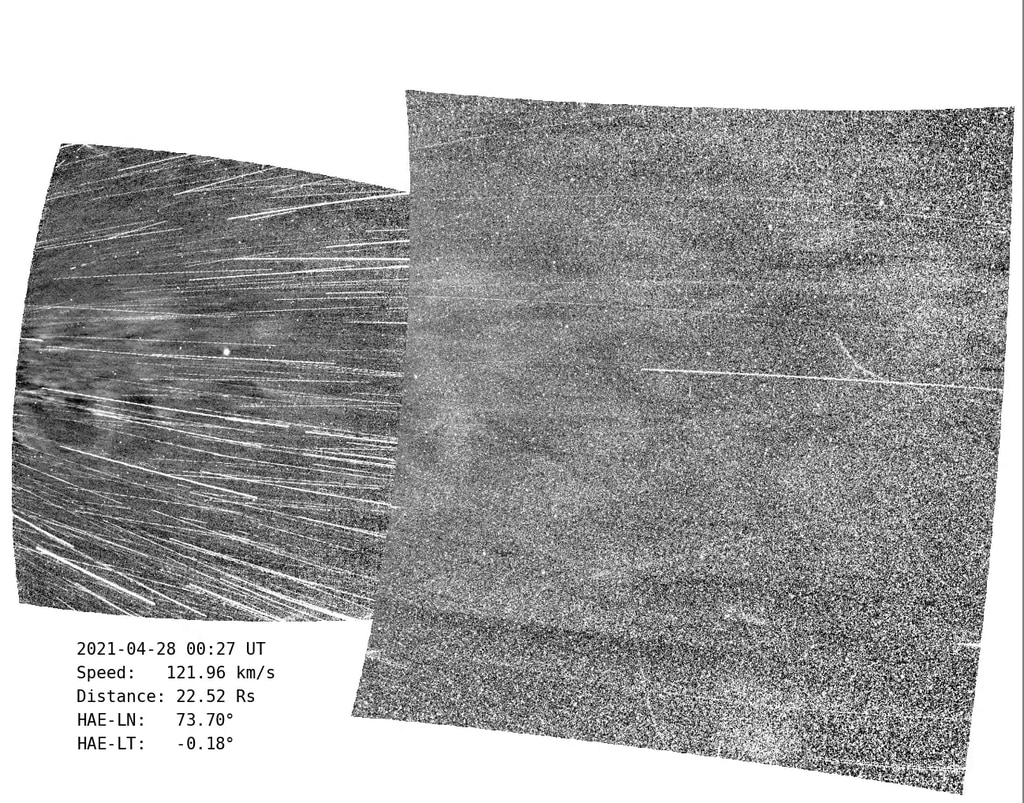
For a number of years, solar scientists have known about a phenomenon they called 'switchbacks'. Switchbacks are short-term 'flips' in the polarity of the magnetic field in the outflowing solar wind. Parker Solar Probe has detected these 'switchbacks' (Switchbacks Science: Explaining Parker Solar Probe’s Magnetic Puzzle), which appear to be more plentiful closer to the Sun.
In the visualization above, Parker is passing through a region of inward bound magnetic flux (blue lines). This surrounding field is computed from a running average of the measurements by Parker, which are computing from the individual measurements at Parker's position (arrows projecting from the spacecraft position). For a brief time, these vectors flip direction, in this particular case changing color from blue to white and red, from the surrounding field, which is the signature of a switchback.
Closer to the Sun, the average field lines trace back to coronal structures called pseudostreamers, that are magnetic structures which overlay and connect multiple pole magnetic regions. These regions also appear to correlate with where magnetic flux emerges between supergranule convection cells.
Most of the magnetic field measured at Parker during this time is directed sunward (blue field lines and vectors). A switchback occurs when the field changes direction almost 180 degrees for a short period of time. FIELDS instrument magnetic vector data are projected from the spacecraft position as arrows. The arrows are colored deep blue for sunward vectors, deep red for anti-sunward, and in between for directions off from this line. The heliospheric magnetic field lines are represented as gold.
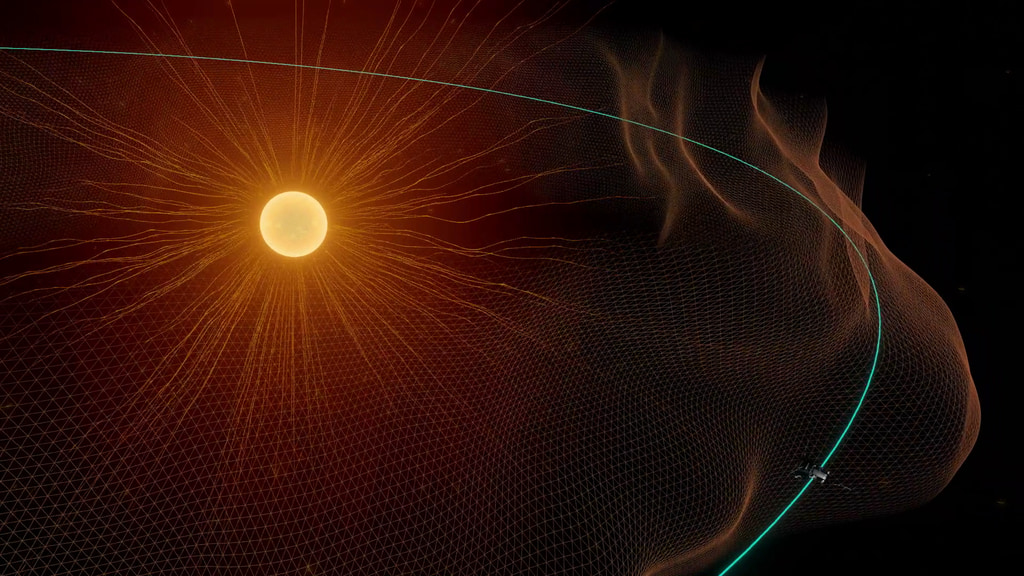
A top-down view from the ecliptic pole of the orbit of Parker Solar Probe for Encounter 6. FIELDS instrument magnetic vector data are projected from the spacecraft position with arrows. The arrows are colored deep blue for sunward vectors, deep red for anti-sunward, and in between for directions off from this line. The heliospheric magnetic field lines are the gold lines, representing the propagation of the average field measured at Parker, propagated back to the solar photosphere.
View of FIELDS instrument magnetic data measured at Parker Solar Probe during encounter 6. FIELDS instrument magnetic vector data are projected from the spacecraft position as arrows. The arrows are colored deep blue for sunward vectors, deep red for anti-sunward, and in between for directions off from this line. The heliospheric magnetic field lines are the gold lines, representing the propagation of the average field measured at Parker, propagated back to the solar photosphere.
A top-down view from the ecliptic pole of the orbit of Parker Solar Probe for Encounter 6.
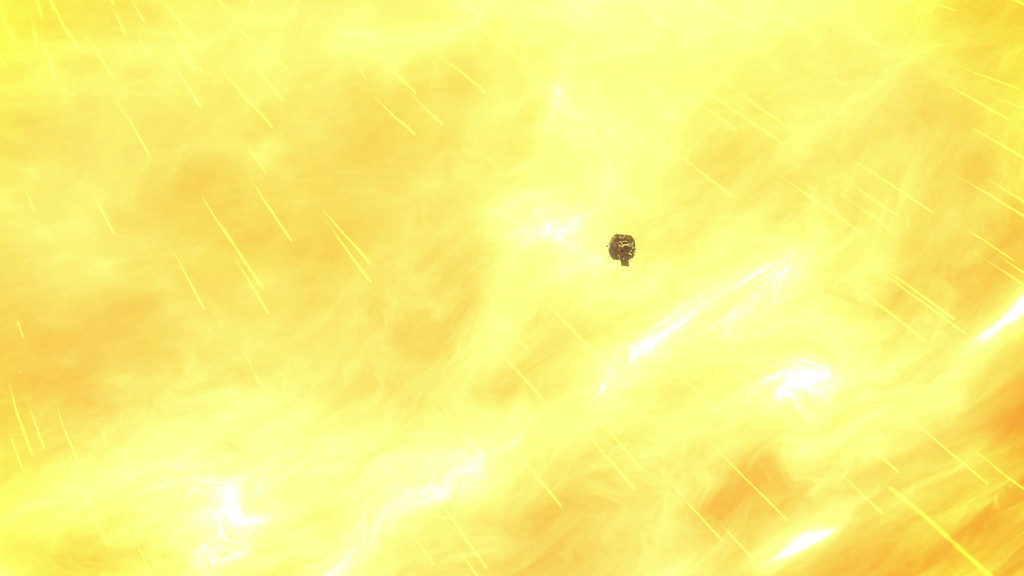
A visualization from behind Parker Solar Probe as it approaches the Sun on Encounter 6.
Credits
Please give credit for this item to:
NASA's Scientific Visualization Studio
-
Visualizer
- Tom Bridgman (Global Science and Technology, Inc.)
-
Scientists
- Stuart Bale (University of California, Berkeley)
- Samuel Badman (University of California at Berkeley)
-
Producer
- Joy Ng (KBR Wyle Services, LLC)
-
Writer
- Mara Johnson-Groh (Wyle Information Systems)
-
Technical support
- Laurence Schuler (ADNET Systems, Inc.)
- Ian Jones (ADNET Systems, Inc.)
Release date
This page was originally published on Tuesday, December 14, 2021.
This page was last updated on Wednesday, November 15, 2023 at 12:17 AM EST.
Missions
This visualization is related to the following missions:Series
This visualization can be found in the following series:Datasets used in this visualization
-
SPICE Ephemerides (SPICE Ephemerides)
ID: 755Satellite and planetary ephemerides
See all pages that use this dataset -
FIELDS [Parker Solar Probe: FIELDS]
ID: 1132Measurements of electric and magnetic fields and waves.
This dataset can be found at: https://fields.ssl.berkeley.edu/
See all pages that use this dataset
Note: While we identify the data sets used in these visualizations, we do not store any further details, nor the data sets themselves on our site.
Related
- ID: 14055
- ID: 4958
 Visualization
 - ID: 14035
- ID: 14036
 Produced Video
 - ID: 20354
 Animation
Used as a Source In
- ID: 14045
 Produced Video