Earth
ID: 5050
Hurricane Nicole hit the East Coast of Florida early morning, November 10th, 2022, at 3:00 am (EST) just south of Vero Beach at North Hutchinson Island. But, unlike Hurricane Ian which came ashore in late September as a powerful Category 4 storm that devasted parts of southwest Florida, Nicole made landfall as a minimal Category 1 storm. Though far less intense, Nicole still brought some heavy rain and gusty winds to the region.
Nicole originated from a non-tropical low pressure system over the southwestern Atlantic. As a result, when the National Hurricane Center (NHC) was first able to identify a rather well-defined center at 4:00 am EST on the morning of the 7th, the low-level circulation was fairly broad with the strongest winds well away from the center, so the system was named Subtropical Storm Nicole. At this time, the center was located about 555 miles due east of the northwestern Bahamas with initial movement was towards the northwest. Nicole maintained its subtropical storm structure throughout the 7th, but by the morning of the 8th, deep convective storms had emerged near the center, suggesting that Nicole was poised to intensify and had transitioned from subtropical to tropical. As a result, Nicole was renamed as a tropical storm by NHC at 10:00 am EST on the 8th. The system also took on a westward track as a deep layer ridge of high pressure north of Nicole shunted the system back towards Florida. Nicole slowly but steadily intensified throughout the day with maximum sustained winds increasing to 70 mph, nearly hurricane strength; however, further intensification ceased as NHC reported that evening that dry air was likely inhibiting thunderstorm development near the center.
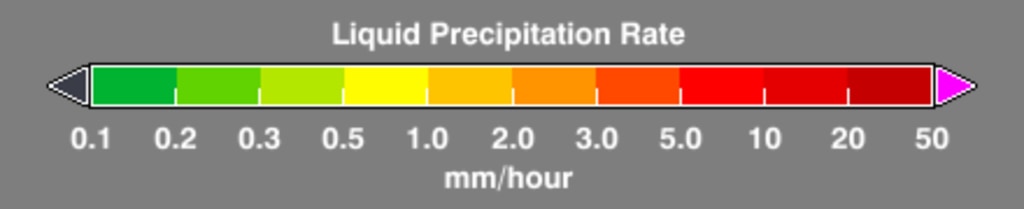
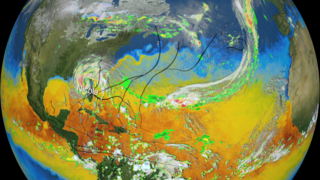
The combination of NASA’s IMERG precipitation product and the GPM Core Observatory satellite with its array of active and passive sensors is ideal for monitoring and studying tropical cyclones, including hurricanes. The following animation shows Nicole as it passes through the Bahamas and into central Florida. The first part of the animation shows a time loop of IMERG surface rainfall estimates beginning at 16:11 UTC (11:11 am EST) on November 9, 2022 when Nicole was nearing Great Abaco Island in the Bahamas. At the start, IMERG shows that Nicole’s precipitation field is attached to the southwestern end of a long quasi-linear band of precipitation associated with a midlatitude frontal system extending well out into the central and northern Atlantic. IMERG also shows that most of the precipitation, including the moderate and heavy rain (shown in orange and red, respectively), associated with Nicole is fairly well north and west of the center. However, enough convective storms had formed near the center as evidenced by areas of moderate to occasionally heavy areas of rain wrapping nearer to the center around the southeast side of the storm, that Nicole was able to reach hurricane strength at 6:00 pm EST (23:00 UTC) while making landfall on Grand Bahama Island. IMERG shows Nicole continuing on to make landfall on Florida’s east coast on the morning of the 10th and continuing on across the peninsula. By the end of the loop at 16:21 UTC (11:21 am EST) on the 10th, after the center had crossed most of central Florida, heavier rain bands are located over western and northern Florida and southeastern Georgia.
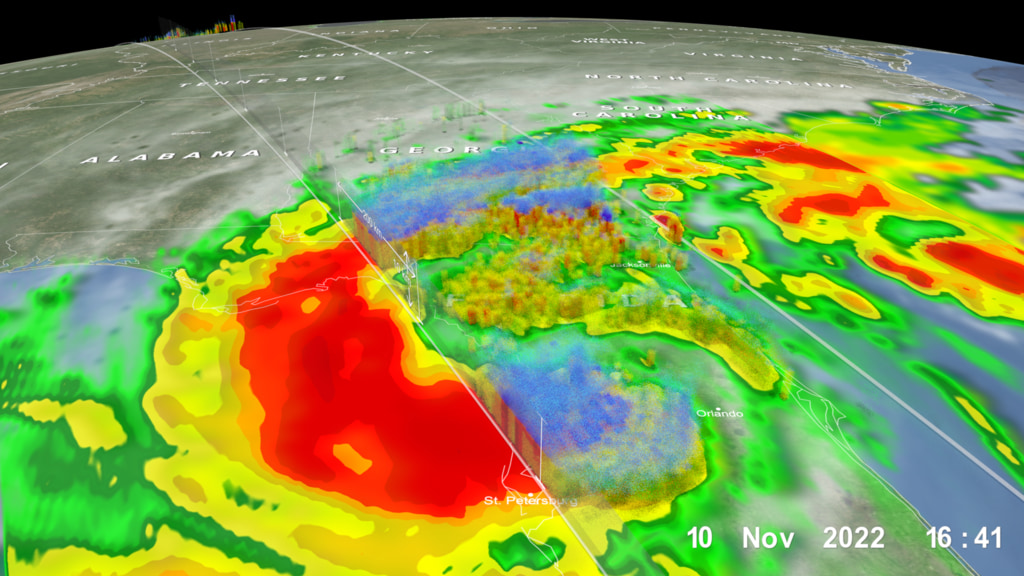
It was around this time that the GPM Core Observatory flew over the center of Nicole. The second part of the animation shows a detailed look into the structure and intensity of the precipitation within Nicole from the GPM Core Observatory around 16:30 UTC (11:30 am EST) on the 10th of November. Surface rainfall estimates from the GPM Microwave Imager (GMI) show Nicole is very asymmetric with a heavy rainband (shown in red) out over the northeast Gulf of Mexico west of the center extending northward up across the central Florida panhandle, back across southeast Georgia, and into coastal South Carolina with very little rain evident south and east of the center over the southern half of the Florida peninsula. GPM’s Dual-frequency Precipitation Radar (DPR) actively scanned the storm to provide a 3D perspective of its precipitation. Areas shaded in blue show frozen precipitation aloft, mainly in the form of snow but also graupel (rimed snow particles) and frozen drops, which are both present in the cores of active thunderstorms. The DPR shows that the taller, deeper thunderstorms within Nicole are associated with the heavier rain located well north and west of the center. In fact, thunderstorm activity near the actual center (located in the middle of the DPR cross section midway between the two areas of deeper storms) is very modest with no tall towers and no heavy rain. The most dominant rainband being located well away from the center shows that Nicole has retained some of its earlier subtropical storm structure. At the time of the GPM overpass, Nicole was around 35 miles NNE of Tampa moving to the WNW with maximum sustained winds reported at 50 mph by NHC.
Nicole then continued onward along the coast of the Florida Big Bend and into northern Georgia while further weakening. So far, the storm is being blamed for 6 deaths in the Dominican Republic and 4 in Florida.

Nicole Brings Heavy Rain to Florida and part of the Southeast
Nicole originated from a non-tropical low pressure system over the southwestern Atlantic. As a result, when the National Hurricane Center (NHC) was first able to identify a rather well-defined center at 4:00 am EST on the morning of the 7th, the low-level circulation was fairly broad with the strongest winds well away from the center, so the system was named Subtropical Storm Nicole. At this time, the center was located about 555 miles due east of the northwestern Bahamas with initial movement was towards the northwest. Nicole maintained its subtropical storm structure throughout the 7th, but by the morning of the 8th, deep convective storms had emerged near the center, suggesting that Nicole was poised to intensify and had transitioned from subtropical to tropical. As a result, Nicole was renamed as a tropical storm by NHC at 10:00 am EST on the 8th. The system also took on a westward track as a deep layer ridge of high pressure north of Nicole shunted the system back towards Florida. Nicole slowly but steadily intensified throughout the day with maximum sustained winds increasing to 70 mph, nearly hurricane strength; however, further intensification ceased as NHC reported that evening that dry air was likely inhibiting thunderstorm development near the center.
The combination of NASA’s IMERG precipitation product and the GPM Core Observatory satellite with its array of active and passive sensors is ideal for monitoring and studying tropical cyclones, including hurricanes. The following animation shows Nicole as it passes through the Bahamas and into central Florida. The first part of the animation shows a time loop of IMERG surface rainfall estimates beginning at 16:11 UTC (11:11 am EST) on November 9, 2022 when Nicole was nearing Great Abaco Island in the Bahamas. At the start, IMERG shows that Nicole’s precipitation field is attached to the southwestern end of a long quasi-linear band of precipitation associated with a midlatitude frontal system extending well out into the central and northern Atlantic. IMERG also shows that most of the precipitation, including the moderate and heavy rain (shown in orange and red, respectively), associated with Nicole is fairly well north and west of the center. However, enough convective storms had formed near the center as evidenced by areas of moderate to occasionally heavy areas of rain wrapping nearer to the center around the southeast side of the storm, that Nicole was able to reach hurricane strength at 6:00 pm EST (23:00 UTC) while making landfall on Grand Bahama Island. IMERG shows Nicole continuing on to make landfall on Florida’s east coast on the morning of the 10th and continuing on across the peninsula. By the end of the loop at 16:21 UTC (11:21 am EST) on the 10th, after the center had crossed most of central Florida, heavier rain bands are located over western and northern Florida and southeastern Georgia.
It was around this time that the GPM Core Observatory flew over the center of Nicole. The second part of the animation shows a detailed look into the structure and intensity of the precipitation within Nicole from the GPM Core Observatory around 16:30 UTC (11:30 am EST) on the 10th of November. Surface rainfall estimates from the GPM Microwave Imager (GMI) show Nicole is very asymmetric with a heavy rainband (shown in red) out over the northeast Gulf of Mexico west of the center extending northward up across the central Florida panhandle, back across southeast Georgia, and into coastal South Carolina with very little rain evident south and east of the center over the southern half of the Florida peninsula. GPM’s Dual-frequency Precipitation Radar (DPR) actively scanned the storm to provide a 3D perspective of its precipitation. Areas shaded in blue show frozen precipitation aloft, mainly in the form of snow but also graupel (rimed snow particles) and frozen drops, which are both present in the cores of active thunderstorms. The DPR shows that the taller, deeper thunderstorms within Nicole are associated with the heavier rain located well north and west of the center. In fact, thunderstorm activity near the actual center (located in the middle of the DPR cross section midway between the two areas of deeper storms) is very modest with no tall towers and no heavy rain. The most dominant rainband being located well away from the center shows that Nicole has retained some of its earlier subtropical storm structure. At the time of the GPM overpass, Nicole was around 35 miles NNE of Tampa moving to the WNW with maximum sustained winds reported at 50 mph by NHC.
Nicole then continued onward along the coast of the Florida Big Bend and into northern Georgia while further weakening. So far, the storm is being blamed for 6 deaths in the Dominican Republic and 4 in Florida.
Related
Visualization Credits
Alex Kekesi (Global Science and Technology, Inc.): Lead Data Visualizer
Greg Shirah (NASA/GSFC): Data Visualizer
George Huffman (NASA/GSFC): Lead Scientist
Scott Braun (NASA/GSFC): Scientist
Jacob Reed (Telophase): Scientist
Stephen Lang (SSAI): Lead Writer
Laurence Schuler (ADNET Systems, Inc.): Lead Technical Support
Ian Jones (ADNET Systems, Inc.): Technical Support
Greg Shirah (NASA/GSFC): Data Visualizer
George Huffman (NASA/GSFC): Lead Scientist
Scott Braun (NASA/GSFC): Scientist
Jacob Reed (Telophase): Scientist
Stephen Lang (SSAI): Lead Writer
Laurence Schuler (ADNET Systems, Inc.): Lead Technical Support
Ian Jones (ADNET Systems, Inc.): Technical Support
Please give credit for this item to:
NASA's Scientific Visualization Studio. Data provided by the joint NASA/JAXA GPM mission.
NASA's Scientific Visualization Studio. Data provided by the joint NASA/JAXA GPM mission.
Short URL to share this page:
https://svs.gsfc.nasa.gov/5050
Mission:
Global Precipitation Measurement (GPM)
Data Used:
Note: While we identify the data sets used in these visualizations, we do not store any further details nor the data sets themselves on our site.
This item is part of these series:
GPM Animations
Hurricanes
Keywords:
DLESE >> Atmospheric science
DLESE >> Hydrology
DLESE >> Natural hazards
SVS >> Tropical Storm
GCMD >> Earth Science >> Atmosphere >> Atmospheric Phenomena >> Hurricanes
GCMD >> Earth Science >> Atmosphere >> Precipitation >> Rain
GCMD >> Location >> Atlantic Ocean
SVS >> Hyperwall
NASA Science >> Earth
GCMD keywords can be found on the Internet with the following citation: Olsen, L.M., G. Major, K. Shein, J. Scialdone, S. Ritz, T. Stevens, M. Morahan, A. Aleman, R. Vogel, S. Leicester, H. Weir, M. Meaux, S. Grebas, C.Solomon, M. Holland, T. Northcutt, R. A. Restrepo, R. Bilodeau, 2013. NASA/Global Change Master Directory (GCMD) Earth Science Keywords. Version 8.0.0.0.0
https://svs.gsfc.nasa.gov/5050
Mission:
Global Precipitation Measurement (GPM)
Data Used:
CPC (Climate Prediction Center) Cloud Composite
Data Compilation - Climate Prediction Center (CPC) - 11/9/2022 16:11Z - 11/10/2022 16:41Z
Global cloud cover from multiple satellites
GPM/GMI/Surface Precipitation also referred to as: Rain Rates
11/10/2022 16:27 - 16:32Z
Credit:
Data provided by the joint NASA/JAXA GPM mission.
Data provided by the joint NASA/JAXA GPM mission.
GPM/DPR/Ku also referred to as: Volumetric Precipitation data
Observed Data - JAXA - 11/10/2022 16:11 - 16:41Z
Credit:
Data provided by the joint NASA/JAXA GPM mission.
Data provided by the joint NASA/JAXA GPM mission.
also referred to as: IMERG
Data Compilation - NASA/GSFC - 11/9/2022 16:11Z - 11/10/2022 16:41ZThis item is part of these series:
GPM Animations
Hurricanes
Keywords:
DLESE >> Atmospheric science
DLESE >> Hydrology
DLESE >> Natural hazards
SVS >> Tropical Storm
GCMD >> Earth Science >> Atmosphere >> Atmospheric Phenomena >> Hurricanes
GCMD >> Earth Science >> Atmosphere >> Precipitation >> Rain
GCMD >> Location >> Atlantic Ocean
SVS >> Hyperwall
NASA Science >> Earth
GCMD keywords can be found on the Internet with the following citation: Olsen, L.M., G. Major, K. Shein, J. Scialdone, S. Ritz, T. Stevens, M. Morahan, A. Aleman, R. Vogel, S. Leicester, H. Weir, M. Meaux, S. Grebas, C.Solomon, M. Holland, T. Northcutt, R. A. Restrepo, R. Bilodeau, 2013. NASA/Global Change Master Directory (GCMD) Earth Science Keywords. Version 8.0.0.0.0


