Sun
ID: 4957
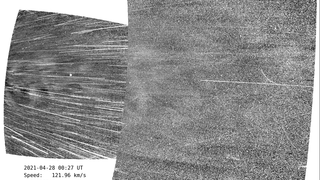
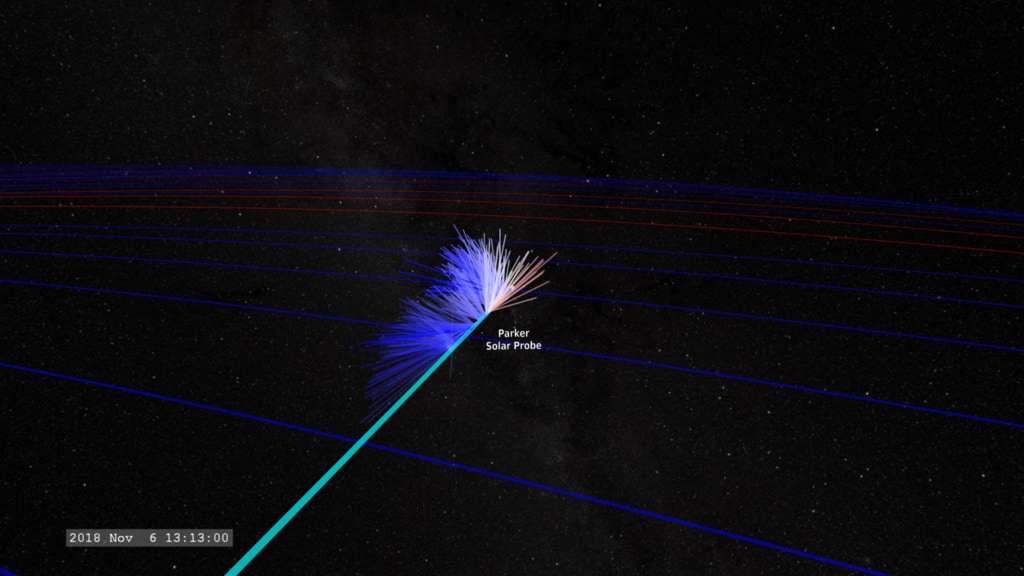
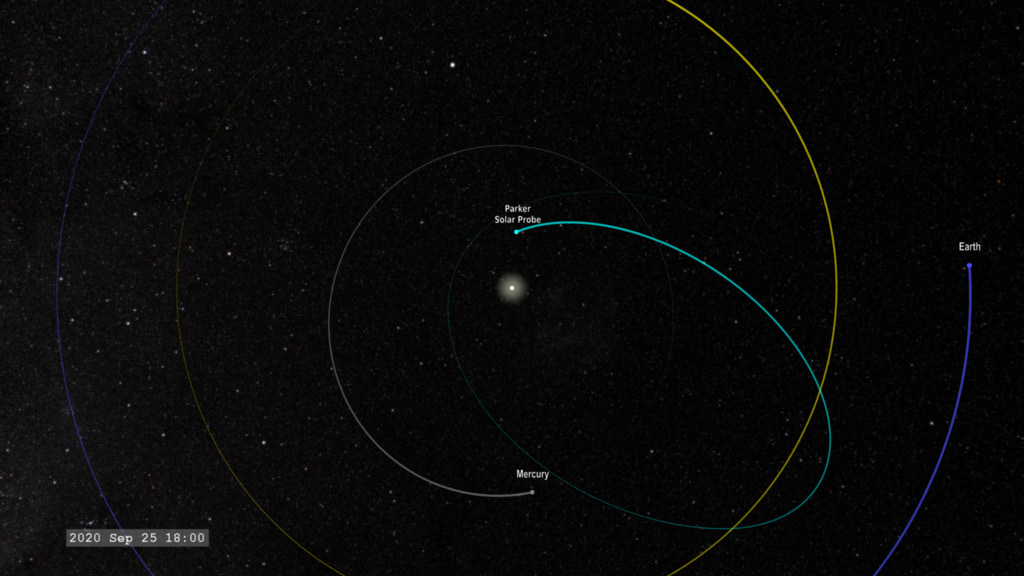
For a number of years, solar scientists have known about a phenomenon they called 'switchbacks'. Switchbacks are short-term 'flips' in the polarity of the magnetic field in the outflowing solar wind. Parker Solar Probe has detected these 'switchbacks' (Switchbacks Science: Explaining Parker Solar Probe’s Magnetic Puzzle), which appear to be more plentiful closer to the Sun.
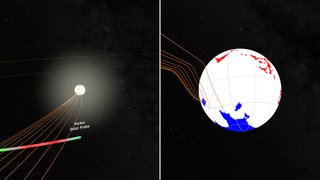
In the visualization above, Parker is passing through a region of inward bound magnetic flux (blue lines). This surrounding field is computed from a running average of the measurements by Parker, which are computing from the individual measurements at Parker's position (arrows projecting from the spacecraft position). For a brief time, these vectors flip direction, in this particular case changing color from blue to white and red, from the surrounding field, which is the signature of a switchback.
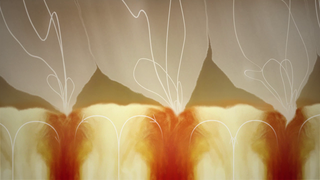
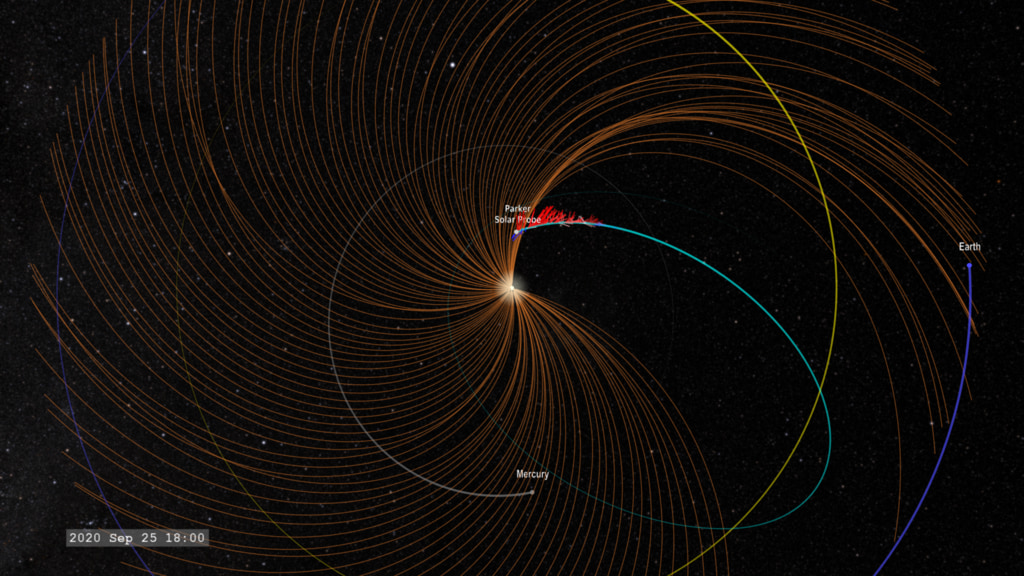
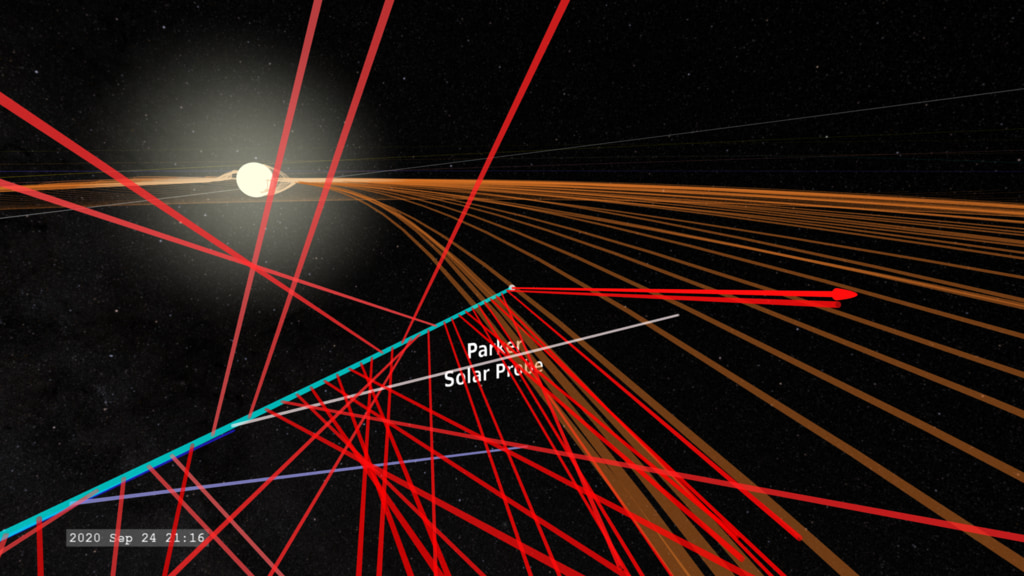
Closer to the Sun, the average field lines trace back to coronal structures called pseudostreamers, that are magnetic structures which overlay and connect multiple pole magnetic regions. These regions also appear to correlate with where magnetic flux emerges between supergranule convection cells.
Parker Solar Probe: The Origins of Switchbacks
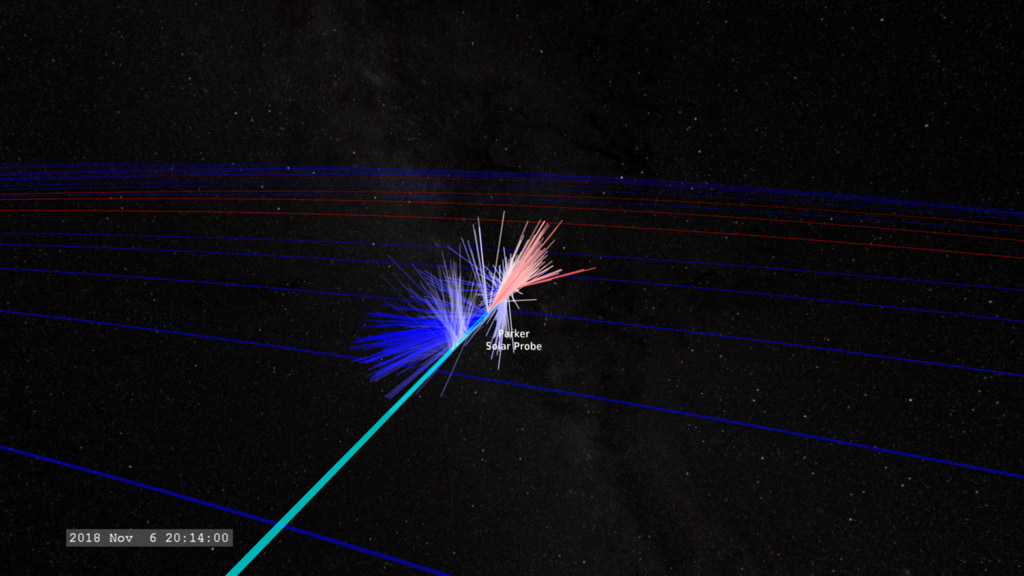
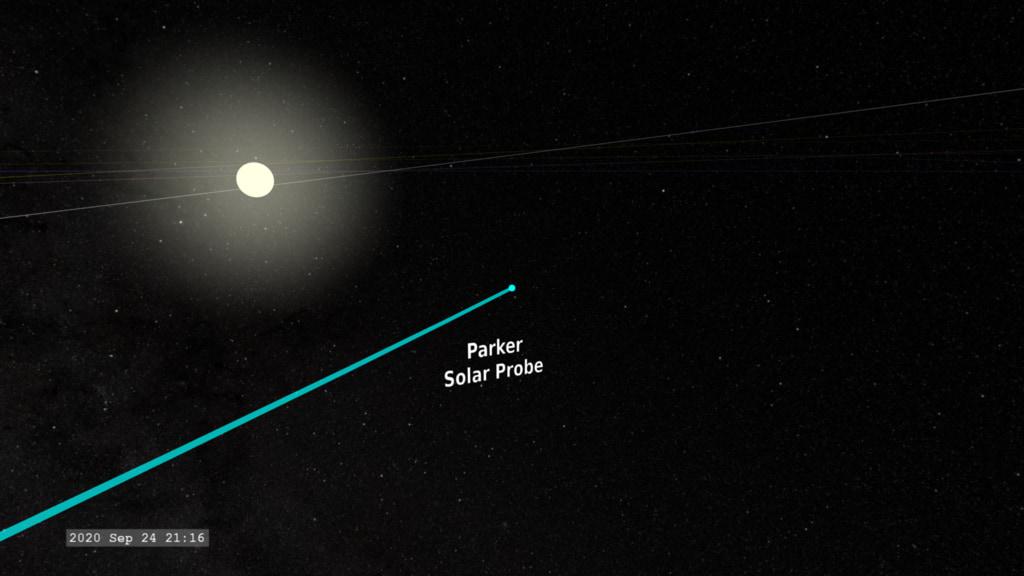
In the visualization above, Parker is passing through a region of inward bound magnetic flux (blue lines). This surrounding field is computed from a running average of the measurements by Parker, which are computing from the individual measurements at Parker's position (arrows projecting from the spacecraft position). For a brief time, these vectors flip direction, in this particular case changing color from blue to white and red, from the surrounding field, which is the signature of a switchback.
Closer to the Sun, the average field lines trace back to coronal structures called pseudostreamers, that are magnetic structures which overlay and connect multiple pole magnetic regions. These regions also appear to correlate with where magnetic flux emerges between supergranule convection cells.
Used Elsewhere In

Related

Visualization Credits
Tom Bridgman (Global Science and Technology, Inc.): Lead Visualizer
Stuart Bale (University of California, Berkeley): Lead Scientist
Samuel Badman (University of California at Berkeley): Scientist
Joy Ng (KBR Wyle Services, LLC): Producer
Mara Johnson-Groh (Wyle Information Systems): Writer
Laurence Schuler (ADNET Systems, Inc.): Technical Support
Ian Jones (ADNET Systems, Inc.): Technical Support
Please give credit for this item to:
NASA's Scientific Visualization Studio
NASA's Scientific Visualization Studio
Short URL to share this page:
https://svs.gsfc.nasa.gov/4957
Mission:
Parker Solar Probe
Data Used:
Note: While we identify the data sets used in these visualizations, we do not store any further details nor the data sets themselves on our site.
This item is part of this series:
AGU 2021 - Parker Solar Probe
Keywords:
SVS >> Solar Wind
SVS >> Space Weather
SVS >> Hyperwall
SVS >> Heliophysics
SVS >> Solar Magnetic Field
NASA Science >> Sun
SVS >> Parker Solar Probe
https://svs.gsfc.nasa.gov/4957
Mission:
Parker Solar Probe
Data Used:
SPICE Ephemerides also referred to as: SPICE Ephemerides
Ephemeris - NASA/JPL
Satellite and planetary ephemerides
Parker Solar Probe/FIELDS also referred to as: FIELDS
University of California at Berkeley
Measurements of electric and magnetic fields and waves.
This item is part of this series:
AGU 2021 - Parker Solar Probe
Keywords:
SVS >> Solar Wind
SVS >> Space Weather
SVS >> Hyperwall
SVS >> Heliophysics
SVS >> Solar Magnetic Field
NASA Science >> Sun
SVS >> Parker Solar Probe


