Planets and Moons
ID: 4717
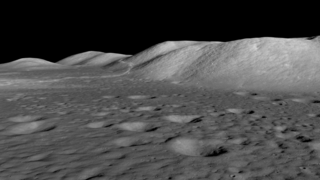
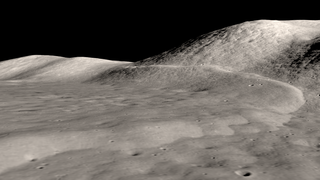
This visualization of the Taurus-Littrow valley, site of the Apollo 17 Moon landing, uses multiple Lunar Reconnaissance Orbiter datasets to zoom into the valley and illustrate the paths taken by the astronauts during their three days of exploration at the site. The data includes wide-angle (WAC) and narrow-angle (NAC) camera images, LOLA laser altimetry, and a high-resolution elevation map created from NAC stereo pairs. The imagery was chosen to approximately match the lighting conditions at the time of the landing. Color-coded trails with numbered stops (called
The Taurus-Littrow Valley through LRO's Eyes
stationsin astronaut lingo) show where Eugene Cernan and Harrison Schmitt drove their lunar rover — orange on day 1, blue on day 2, and green on day 3.
Related
Visualization Credits
Ernie Wright (USRA): Lead Visualizer
Laurence Schuler (ADNET Systems, Inc.): Technical Support
Ian Jones (ADNET Systems, Inc.): Technical Support
Noah Petro (NASA/GSFC): Scientist
Laurence Schuler (ADNET Systems, Inc.): Technical Support
Ian Jones (ADNET Systems, Inc.): Technical Support
Noah Petro (NASA/GSFC): Scientist
Please give credit for this item to:
NASA's Scientific Visualization Studio
NASA's Scientific Visualization Studio
Short URL to share this page:
https://svs.gsfc.nasa.gov/4717
Missions:
Apollo
LRO (Lunar Reconnaissance Orbiter)
Data Used:
Note: While we identify the data sets used in these visualizations, we do not store any further details nor the data sets themselves on our site.
This item is part of this series:
The Moon
Keywords:
SVS >> Flyover
SVS >> HDTV
SVS >> Lunar
SVS >> Moon
SVS >> Hyperwall
SVS >> LRO
SVS >> Lunar Reconnaissance Orbiter
SVS >> LOLA
SVS >> LROC
SVS >> Lunar Topography
SVS >> Solar System >> Moon >> Lunar Surface
SVS >> Apollo 17
NASA Science >> Planets and Moons
https://svs.gsfc.nasa.gov/4717
Missions:
Apollo
LRO (Lunar Reconnaissance Orbiter)
Data Used:
LRO/LROC/Narrow Angle Camera also referred to as: NAC
LRO/Wide Angle Camera also referred to as: LROC WAC
Observed DataLRO/SELENE/LOLA/TC/DIgital Elevation Model also referred to as: SLDEM2015
Model
A digital elevation model of the Moon derived from the Lunar Orbiter Laser Altimeter and the SELENE Terrain Camera. See the description in Icarus. The data is here.
This item is part of this series:
The Moon
Keywords:
SVS >> Flyover
SVS >> HDTV
SVS >> Lunar
SVS >> Moon
SVS >> Hyperwall
SVS >> LRO
SVS >> Lunar Reconnaissance Orbiter
SVS >> LOLA
SVS >> LROC
SVS >> Lunar Topography
SVS >> Solar System >> Moon >> Lunar Surface
SVS >> Apollo 17
NASA Science >> Planets and Moons


