Earth
Sun
Planets and Moons
ID: 4711
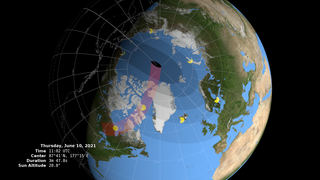
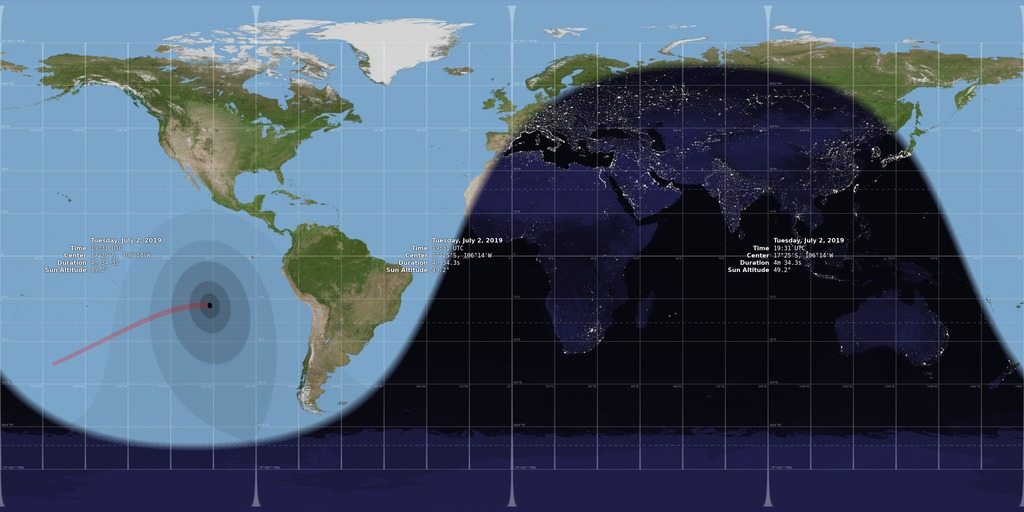
On Tuesday, July 2, 2019, the Moon will pass in front of the Sun, casting its shadow across South America and the southern Pacific Ocean.
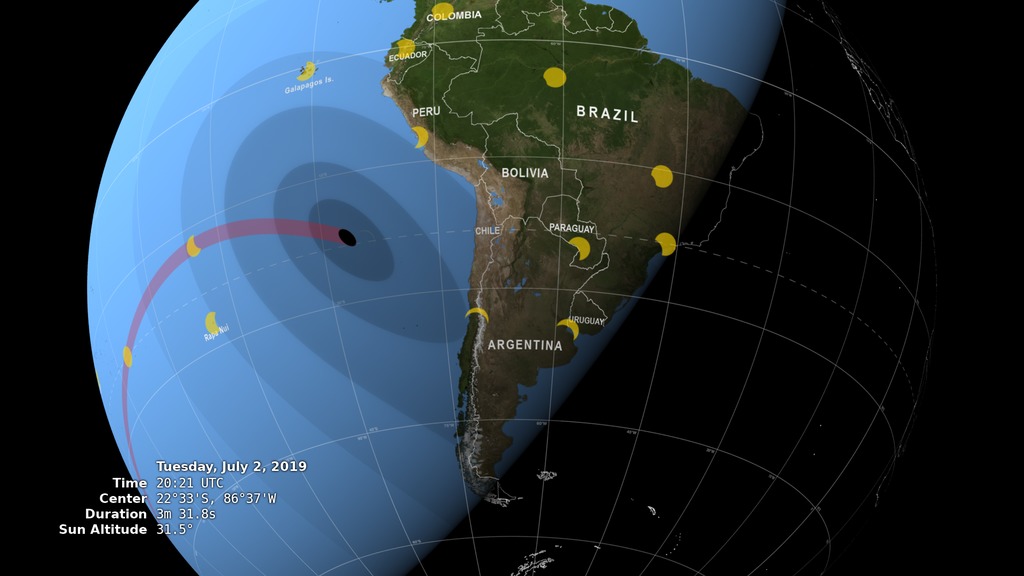
The Moon's shadow can be divided into areas called the umbra and the penumbra. Within the penumbra, the Sun is only partially blocked, and observers experience a partial eclipse. The much smaller umbra lies at the very center of the shadow cone, and anyone there sees the Moon entirely cover the Sun in a total solar eclipse.
In the animation, the umbra is the small black oval. The red streak behind this oval is the path of totality. Anyone within this path will see a total eclipse when the umbra passes over them. The much larger shaded bullseye pattern represents the penumbra. Steps in the shading denote different percentages of Sun coverage (obscuration), at levels of 90%, 75%, 50% and 25%. The images of the Sun show its appearance at a number of locations during the eclipse, each oriented to the local horizon.
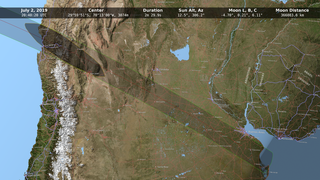
The numbers in the lower left corner give the latitude and longitude of the center of the umbra as it moves eastward, along with the altitude of the Sun above the horizon at that point. Also shown is the duration of totality: for anyone standing at the center point, this is how long the total solar eclipse will last.
Everyone who performs these calculations will make certain choices to simplify the math or to precisely define an imperfectly known number. The choices often depend on the goals and the computing resources of the calculator, and as you'd expect, the results will differ slightly. You can get quite good results with a relatively simple approach, but it sometimes takes an enormous effort to get only slightly better answers.
The following table lists some of the constants and data used for this animation.
A number of sources explain Bessel’s method of solar eclipse calculation, including chapter 9 of Astronomy on the Personal Computer by Oliver Montenbruck and Thomas Pflager and the eclipses chapter of The Explanatory Supplement to the Astronomical Almanac. The method was adapted to the routines available in NAIF's SPICE software library.
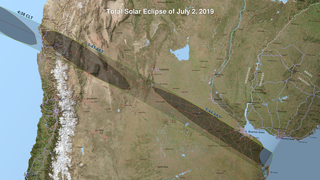
See this SVS page for a larger scale map of the eclipse path over South America that takes into account the lunar limb, Earth elevations, and other details that have been ignored here.
2019 Total Solar Eclipse
The Moon's shadow can be divided into areas called the umbra and the penumbra. Within the penumbra, the Sun is only partially blocked, and observers experience a partial eclipse. The much smaller umbra lies at the very center of the shadow cone, and anyone there sees the Moon entirely cover the Sun in a total solar eclipse.
In the animation, the umbra is the small black oval. The red streak behind this oval is the path of totality. Anyone within this path will see a total eclipse when the umbra passes over them. The much larger shaded bullseye pattern represents the penumbra. Steps in the shading denote different percentages of Sun coverage (obscuration), at levels of 90%, 75%, 50% and 25%. The images of the Sun show its appearance at a number of locations during the eclipse, each oriented to the local horizon.
The numbers in the lower left corner give the latitude and longitude of the center of the umbra as it moves eastward, along with the altitude of the Sun above the horizon at that point. Also shown is the duration of totality: for anyone standing at the center point, this is how long the total solar eclipse will last.
About Accuracy
You might think that calculating the circumstances of an eclipse would be, if not easy, then at least precise. If you do the math correctly, you’d expect to get exactly the same answers as everyone else. But the universe is more subtle than that. The Earth is neither smooth nor perfectly spherical, nor does it rotate at a perfectly constant, predictable speed. The Moon isn’t smooth, either, which means that the shadow it casts isn’t a simple circle. And our knowledge of the size of the Sun is uncertain by a factor of about 0.2%, enough to affect the duration of totality by several seconds.Everyone who performs these calculations will make certain choices to simplify the math or to precisely define an imperfectly known number. The choices often depend on the goals and the computing resources of the calculator, and as you'd expect, the results will differ slightly. You can get quite good results with a relatively simple approach, but it sometimes takes an enormous effort to get only slightly better answers.
The following table lists some of the constants and data used for this animation.
| Earth radius | 6378.137 km |
|---|---|
| Earth flattening | 1 / 298.257 (the WGS 84 ellipsoid) |
| Moon radius | 1737.4 km (k = 0.2723993) |
| Sun radius | 696,000 km (959.634 arcsec at 1 AU) |
| Ephemeris | DE 421 |
| Earth orientation | SOFA library iauC2t06a() |
| Delta UTC | 69.184 seconds (TT – TAI + 37 leap seconds) |
| ΔT | 69.368 seconds |
A number of sources explain Bessel’s method of solar eclipse calculation, including chapter 9 of Astronomy on the Personal Computer by Oliver Montenbruck and Thomas Pflager and the eclipses chapter of The Explanatory Supplement to the Astronomical Almanac. The method was adapted to the routines available in NAIF's SPICE software library.
See this SVS page for a larger scale map of the eclipse path over South America that takes into account the lunar limb, Earth elevations, and other details that have been ignored here.
Alternate Version

Related
Visualization Credits
Ernie Wright (USRA): Lead Visualizer
Laurence Schuler (ADNET Systems, Inc.): Technical Support
Ian Jones (ADNET Systems, Inc.): Technical Support
Genna Duberstein (USRA): Producer
Ernie Wright (USRA): Programmer
Laurence Schuler (ADNET Systems, Inc.): Technical Support
Ian Jones (ADNET Systems, Inc.): Technical Support
Genna Duberstein (USRA): Producer
Ernie Wright (USRA): Programmer
Please give credit for this item to:
NASA's Scientific Visualization Studio
NASA's Scientific Visualization Studio
Short URL to share this page:
https://svs.gsfc.nasa.gov/4711
Data Used:
Note: While we identify the data sets used in these visualizations, we do not store any further details nor the data sets themselves on our site.
Keywords:
SVS >> HDTV
SVS >> Moon
SVS >> Solar Eclipse
SVS >> Hyperwall
SVS >> Science On a Sphere
SVS >> Eclipse
SVS >> Heliophysics
SVS >> Sun-Earth-Moon Interactions
SVS >> Sun and Earth
NASA Science >> Earth
NASA Science >> Sun
NASA Science >> Planets and Moons
https://svs.gsfc.nasa.gov/4711
Data Used:
Terra and Aqua/MODIS/Blue Marble: Next Generation also referred to as: BMNG
Credit:
The Blue Marble data is courtesy of Reto Stockli (NASA/GSFC).
The Blue Marble data is courtesy of Reto Stockli (NASA/GSFC).
JPL DE421 also referred to as: DE421
Ephemeris - NASA/JPL
Planetary ephemerides
Keywords:
SVS >> HDTV
SVS >> Moon
SVS >> Solar Eclipse
SVS >> Hyperwall
SVS >> Science On a Sphere
SVS >> Eclipse
SVS >> Heliophysics
SVS >> Sun-Earth-Moon Interactions
SVS >> Sun and Earth
NASA Science >> Earth
NASA Science >> Sun
NASA Science >> Planets and Moons


