Earth
ID: 4678
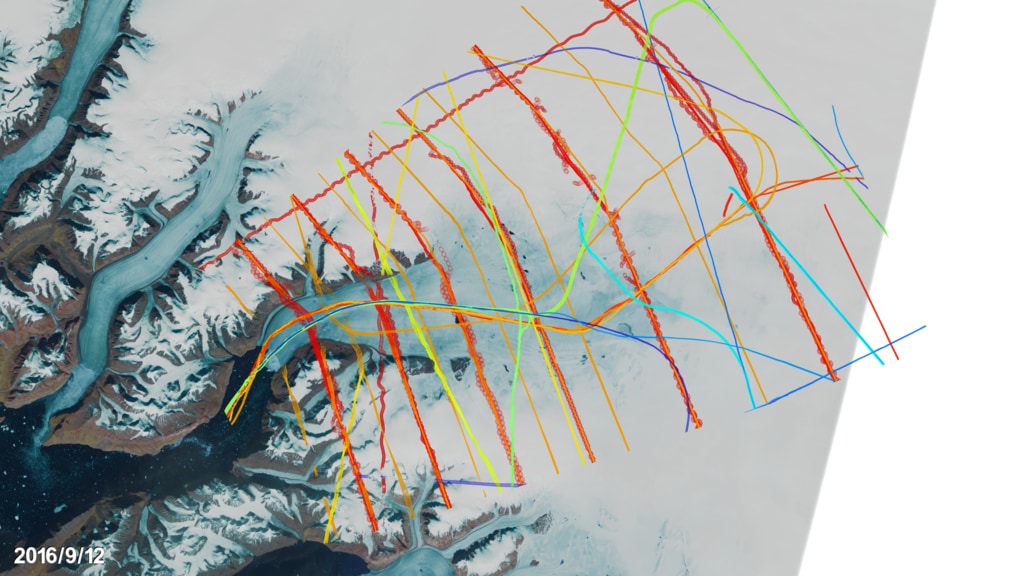
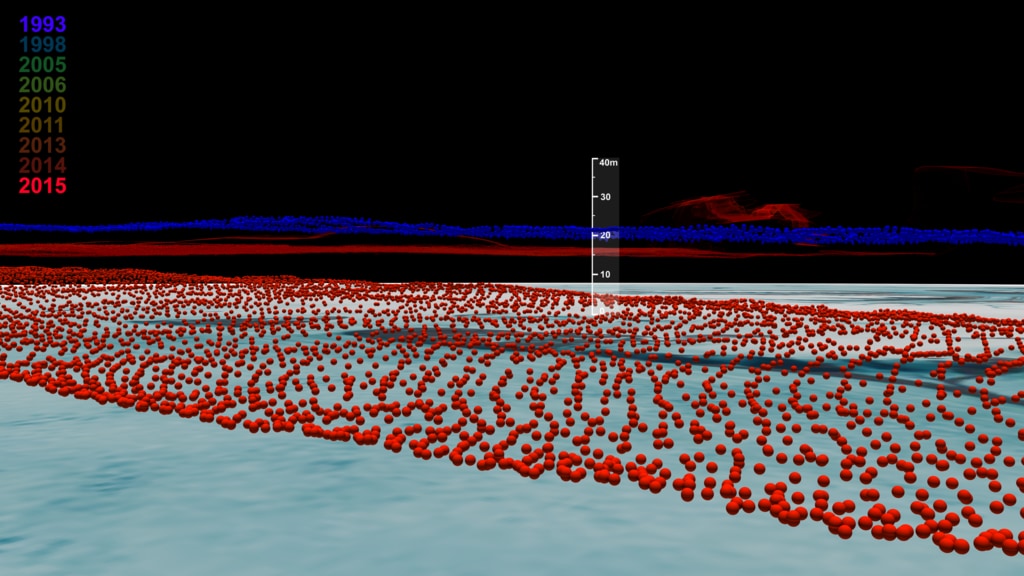
Since 1993, the Airborne Topographic Mapper or ATM has been monitoring elevation changes of 160 outlet glaciers in Greenland, many of them on an almost annual basis. Rink Glacier in central west Greenland is one example of a 25-year-long time series of elevation changes.
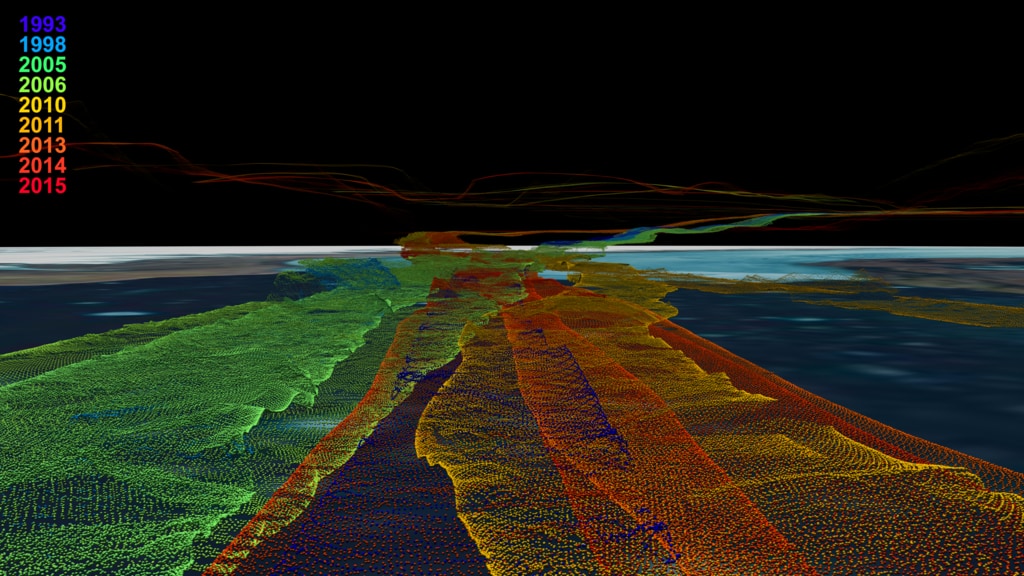
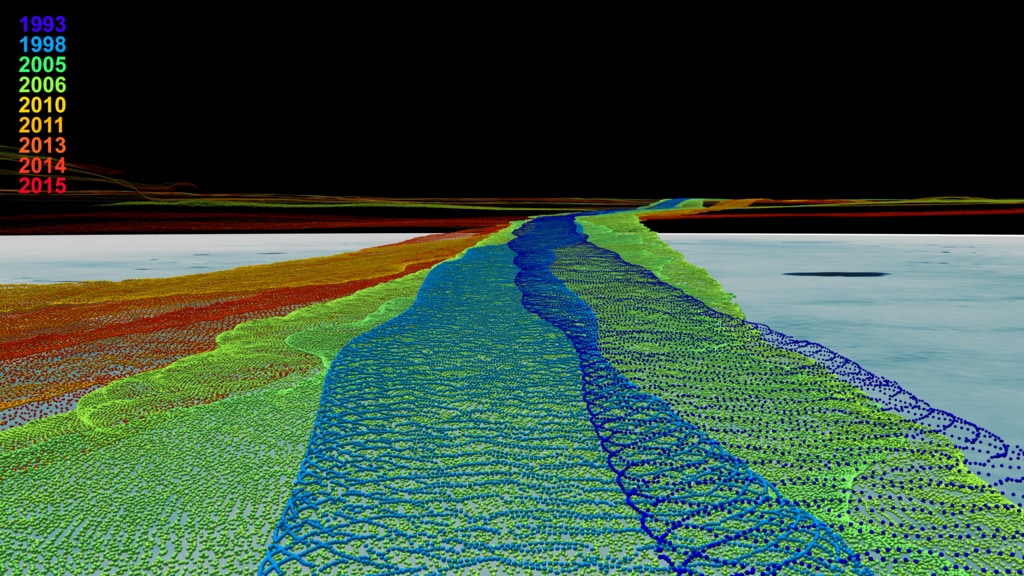
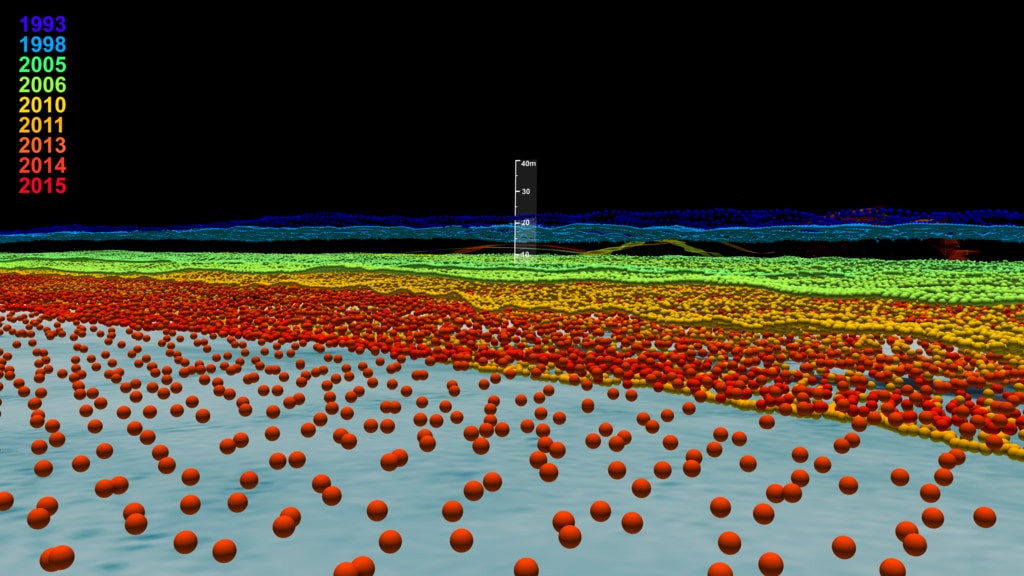
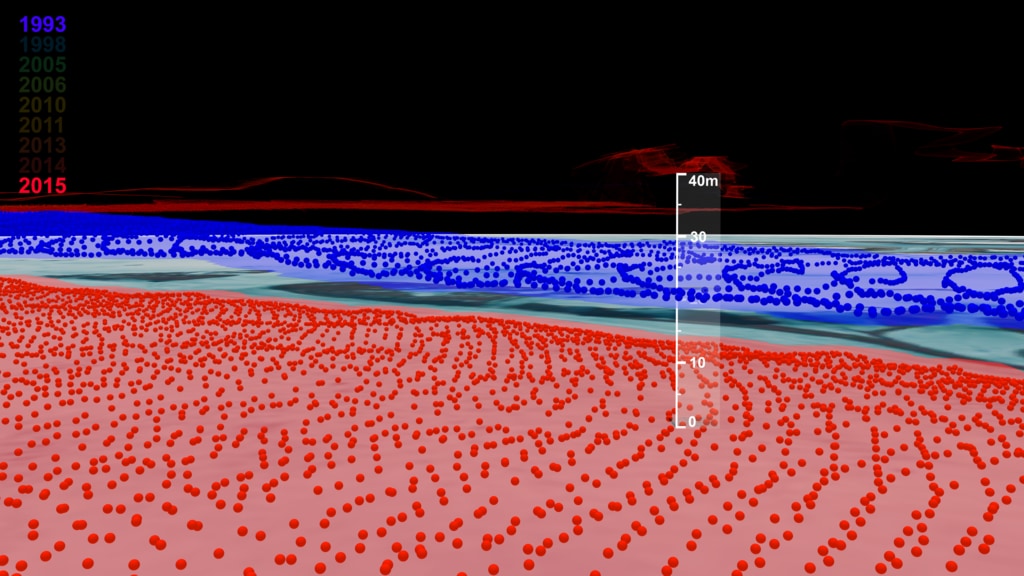
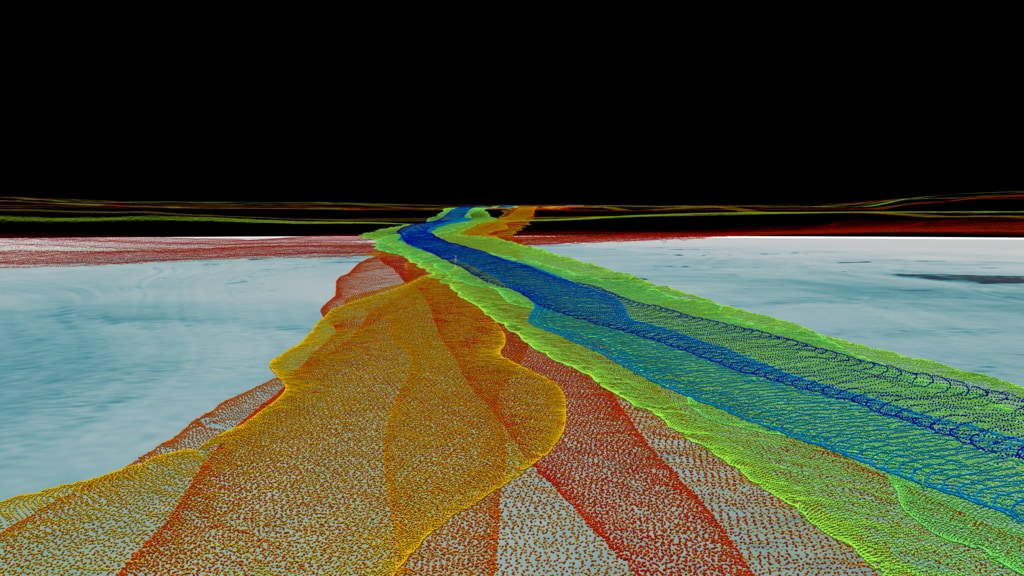
In these visualizations, elevation data for each aircraft flight over the glacier are illustrated using spheres 1m in diameter, with each sphere representing a specific measurement. When viewed together, the spheres form sheets defining the observed surface of the glacier for a given year. The spheres are colored by year, and over time we can see how the glacier's elevation changes.
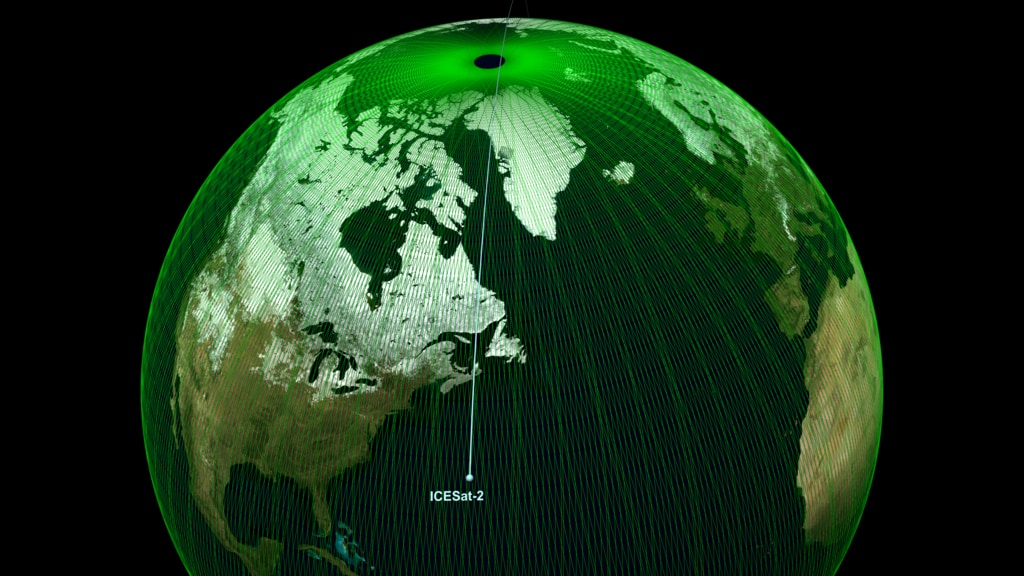
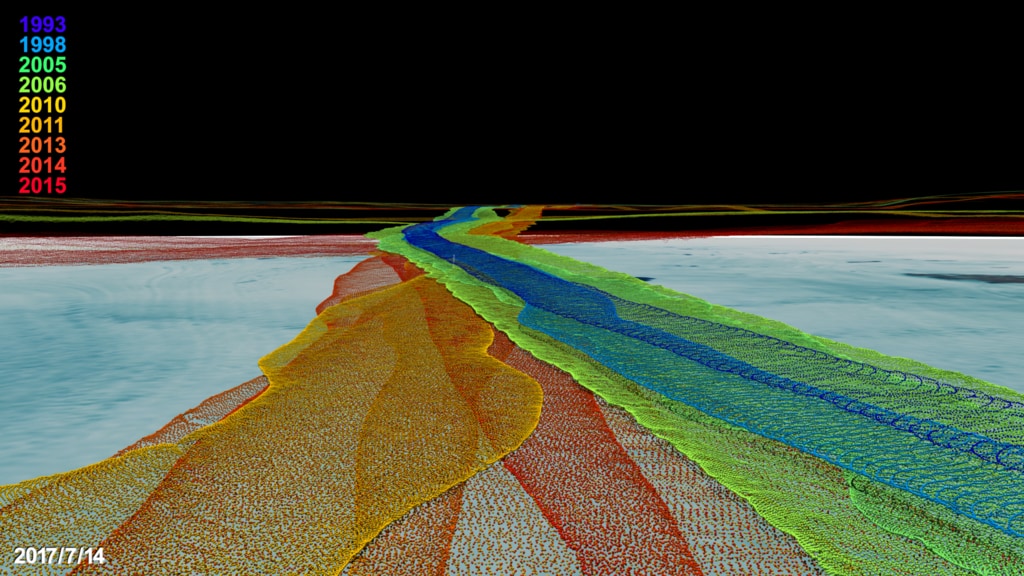
Towards the end of the visualization, the study area of the Rink Glacier is compared to the future coverage of the Ice, Cloud and land Elevation Satellite-2 (ICESat-2), as represented by bright green crisscrossing ground tracks.


Rink Glacier Multi-Year Surface Elevation Comparison
In these visualizations, elevation data for each aircraft flight over the glacier are illustrated using spheres 1m in diameter, with each sphere representing a specific measurement. When viewed together, the spheres form sheets defining the observed surface of the glacier for a given year. The spheres are colored by year, and over time we can see how the glacier's elevation changes.
Towards the end of the visualization, the study area of the Rink Glacier is compared to the future coverage of the Ice, Cloud and land Elevation Satellite-2 (ICESat-2), as represented by bright green crisscrossing ground tracks.
Visualization Credits
Ryan Fitzgibbons (USRA): Producer
Thomas A. Neumann Ph.D. (NASA/GSFC): Scientist
Michael Studinger (NASA/GSFC): Scientist
Thorsten Markus (NASA/GSFC): Scientist
Kel Elkins (USRA): Lead Visualizer
Thomas A. Neumann Ph.D. (NASA/GSFC): Scientist
Michael Studinger (NASA/GSFC): Scientist
Thorsten Markus (NASA/GSFC): Scientist
Kel Elkins (USRA): Lead Visualizer
Please give credit for this item to:
NASA's Scientific Visualization Studio
NASA's Scientific Visualization Studio
Short URL to share this page:
https://svs.gsfc.nasa.gov/4678
Data Used:
Note: While we identify the data sets used in these visualizations, we do not store any further details nor the data sets themselves on our site.
Keywords:
GCMD >> Earth Science >> Hydrosphere >> Glaciers/Ice Sheets >> Glacier Elevation/Ice Sheet Elevation
GCMD >> Location >> Greenland
SVS >> Hyperwall
SVS >> IceBridge
NASA Science >> Earth
GCMD >> Earth Science >> Terrestrial Hydrosphere >> Glaciers/Ice Sheets >> Ice Sheets
GCMD keywords can be found on the Internet with the following citation: Olsen, L.M., G. Major, K. Shein, J. Scialdone, S. Ritz, T. Stevens, M. Morahan, A. Aleman, R. Vogel, S. Leicester, H. Weir, M. Meaux, S. Grebas, C.Solomon, M. Holland, T. Northcutt, R. A. Restrepo, R. Bilodeau, 2013. NASA/Global Change Master Directory (GCMD) Earth Science Keywords. Version 8.0.0.0.0
https://svs.gsfc.nasa.gov/4678
Data Used:
IceBridge/ATM/L2 Icessn Elevation, Slope, and Roughness
NASA - 1993-2015Keywords:
GCMD >> Earth Science >> Hydrosphere >> Glaciers/Ice Sheets >> Glacier Elevation/Ice Sheet Elevation
GCMD >> Location >> Greenland
SVS >> Hyperwall
SVS >> IceBridge
NASA Science >> Earth
GCMD >> Earth Science >> Terrestrial Hydrosphere >> Glaciers/Ice Sheets >> Ice Sheets
GCMD keywords can be found on the Internet with the following citation: Olsen, L.M., G. Major, K. Shein, J. Scialdone, S. Ritz, T. Stevens, M. Morahan, A. Aleman, R. Vogel, S. Leicester, H. Weir, M. Meaux, S. Grebas, C.Solomon, M. Holland, T. Northcutt, R. A. Restrepo, R. Bilodeau, 2013. NASA/Global Change Master Directory (GCMD) Earth Science Keywords. Version 8.0.0.0.0


