Earth
ID: 4535
Satellite-based passive microwave images of the sea ice have provided a reliable tool for continuously monitoring changes in the Arctic ice since 1979. Every summer the Arctic ice cap melts down to what scientists call its "minimum" before colder weather begins to cause ice cover to increase. The first six months of 2016 have been the warmest first half of any year in our recorded history of surface temperature (which go back to 1880). Data shows that the Arctic temperature increases are much bigger, relatively, than the rest of the globe.
The Japan Aerospace Exploration Agency (JAXA) provides many water-related products derived from data acquired by the Advanced Microwave Scanning Radiometer 2 (AMSR2) instrument aboard the Global Change Observation Mission 1st-Water "SHIZUKU" (GCOM-W1) satellite. Two JAXA datasets used in this visualization are the 10-km daily sea ice concentration and the 10 km daily 89 GHz Brightness Temperature.
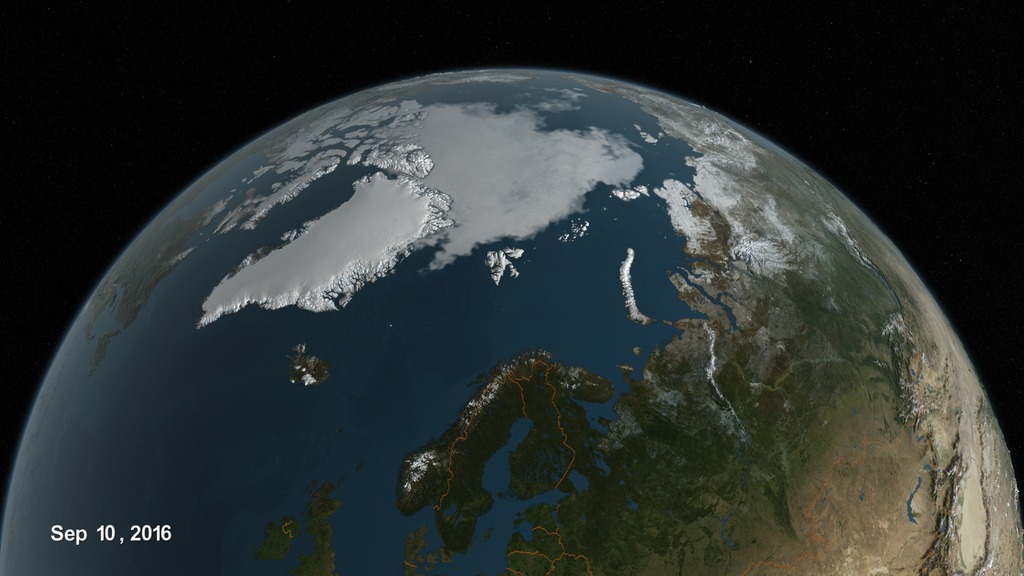
In this visualization, the daily Arctic sea ice and seasonal land cover change progress through time, from January 1, 2016, through September 10, 2016 when the sea ice reached its annual minimum extent for the year. Over the water, Arctic sea ice changes from day to day showing a running 3-day minimum sea ice concentration in the region where the concentration is greater than 15%. The blueish white color of the sea ice is derived from a 3-day running minimum of the AMSR2 89 GHz brightness temperature. Over the terrain, monthly data from the seasonal Blue Marble Next Generation fades slowly from month to month.
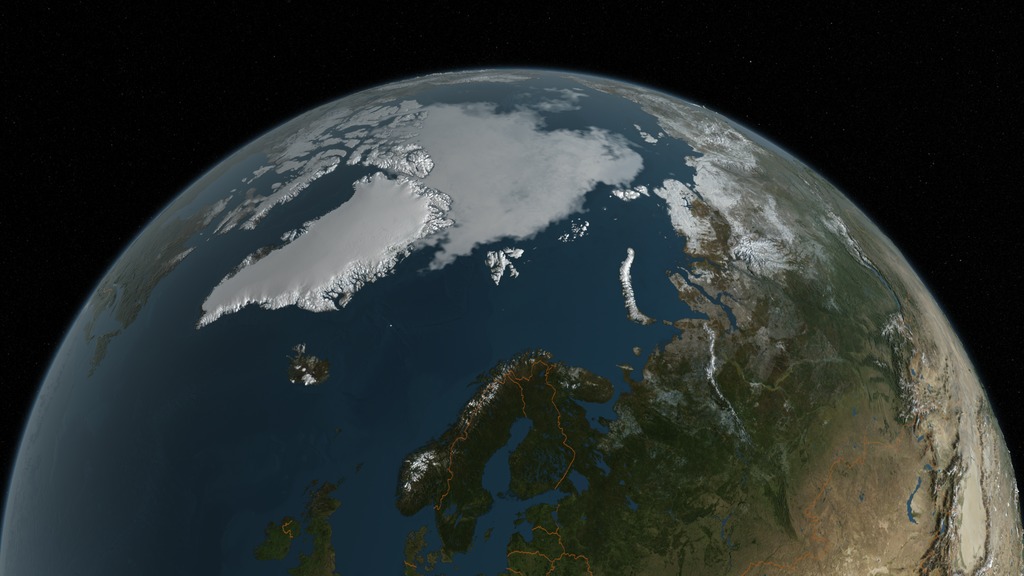
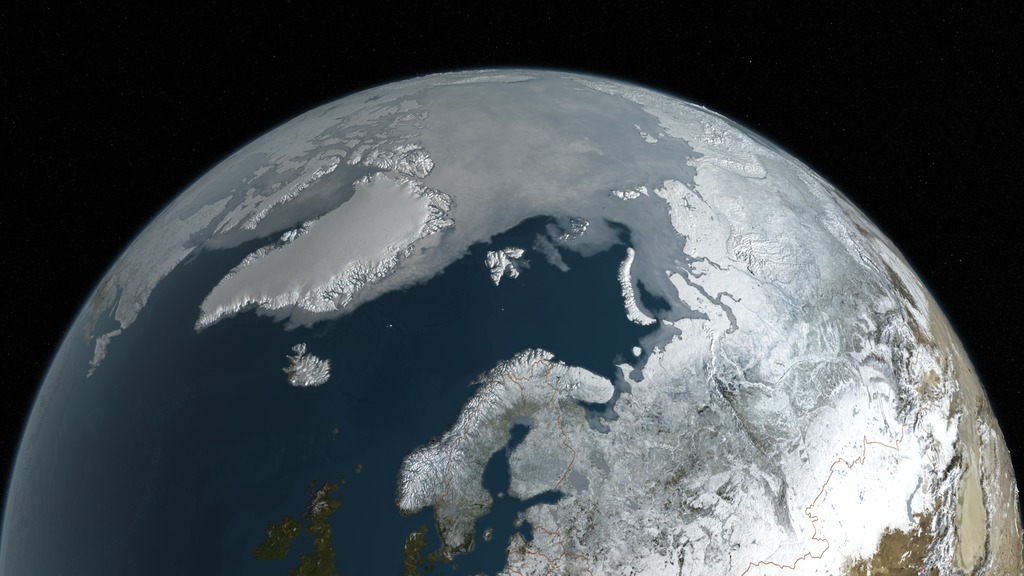
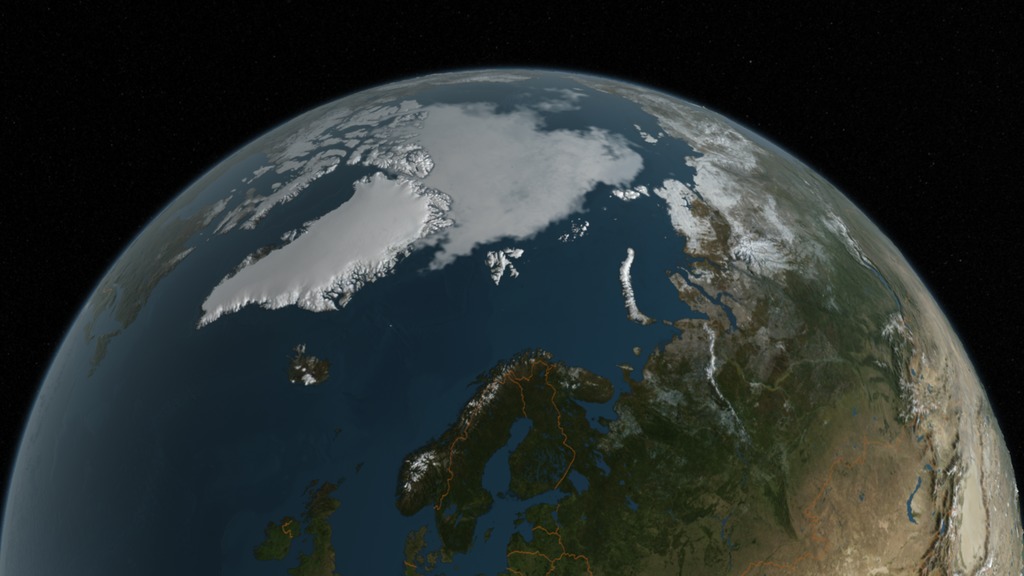

Arctic Sea Ice from January 1, 2013 to September 10, 2016
The Japan Aerospace Exploration Agency (JAXA) provides many water-related products derived from data acquired by the Advanced Microwave Scanning Radiometer 2 (AMSR2) instrument aboard the Global Change Observation Mission 1st-Water "SHIZUKU" (GCOM-W1) satellite. Two JAXA datasets used in this visualization are the 10-km daily sea ice concentration and the 10 km daily 89 GHz Brightness Temperature.
In this visualization, the daily Arctic sea ice and seasonal land cover change progress through time, from January 1, 2016, through September 10, 2016 when the sea ice reached its annual minimum extent for the year. Over the water, Arctic sea ice changes from day to day showing a running 3-day minimum sea ice concentration in the region where the concentration is greater than 15%. The blueish white color of the sea ice is derived from a 3-day running minimum of the AMSR2 89 GHz brightness temperature. Over the terrain, monthly data from the seasonal Blue Marble Next Generation fades slowly from month to month.
Related
Visualization Credits
Lead Visualizer:
Cindy Starr (Global Science and Technology, Inc.)
Visualizer:
Trent L. Schindler (USRA)
Scientist:
Walt Meier (NASA/GSFC)
Project Support:
Leann Johnson (Global Science and Technology, Inc.)
Joycelyn Thomson Jones (NASA/GSFC)
Technical Support:
Laurence Schuler (ADNET Systems, Inc.)
Ian Jones (ADNET Systems, Inc.)
Please give credit for this item to:
NASA's Scientific Visualization Studio
NASA's Scientific Visualization Studio
Short URL to share this page:
https://svs.gsfc.nasa.gov/4535
Data Used:
Note: While we identify the data sets used in these visualizations, we do not store any further details nor the data sets themselves on our site.
Keywords:
SVS >> Sea Ice
GCMD >> Earth Science >> Oceans >> Sea Ice >> Sea Ice Concentration
SVS >> Hyperwall
NASA Science >> Earth
SVS >> Presentation
GCMD >> Earth Science >> Climate Indicators >> Cryospheric Indicators >> Sea Ice Concentration
GCMD keywords can be found on the Internet with the following citation: Olsen, L.M., G. Major, K. Shein, J. Scialdone, S. Ritz, T. Stevens, M. Morahan, A. Aleman, R. Vogel, S. Leicester, H. Weir, M. Meaux, S. Grebas, C.Solomon, M. Holland, T. Northcutt, R. A. Restrepo, R. Bilodeau, 2013. NASA/Global Change Master Directory (GCMD) Earth Science Keywords. Version 8.0.0.0.0
https://svs.gsfc.nasa.gov/4535
Data Used:
Terra and Aqua/MODIS/Blue Marble: Next Generation also referred to as: BMNG
2004
Credit:
The Blue Marble data is courtesy of Reto Stockli (NASA/GSFC).
The Blue Marble data is courtesy of Reto Stockli (NASA/GSFC).
SHIZUKU (GCOM-W1)/AMSR2/10 km Daily Sea Ice Concentration
Observed Data - Japan Aerospace Exploration Agency - 1/1/2013 - 9/10/2016
Credit:
AMSR2 data courtesy of the Japan Aerospace Exploration Agency (JAXA).
AMSR2 data courtesy of the Japan Aerospace Exploration Agency (JAXA).
SHIZUKU (GCOM-W1)/AMSR2/10 km Daily 89 GHz Brightness Temperature
Observed Data - Japan Aerospace Exploration Agency - 1/1/2013 - 9/10/2016
Credit:
AMSR2 data courtesy of the Japan Aerospace Exploration Agency (JAXA).
AMSR2 data courtesy of the Japan Aerospace Exploration Agency (JAXA).
Keywords:
SVS >> Sea Ice
GCMD >> Earth Science >> Oceans >> Sea Ice >> Sea Ice Concentration
SVS >> Hyperwall
NASA Science >> Earth
SVS >> Presentation
GCMD >> Earth Science >> Climate Indicators >> Cryospheric Indicators >> Sea Ice Concentration
GCMD keywords can be found on the Internet with the following citation: Olsen, L.M., G. Major, K. Shein, J. Scialdone, S. Ritz, T. Stevens, M. Morahan, A. Aleman, R. Vogel, S. Leicester, H. Weir, M. Meaux, S. Grebas, C.Solomon, M. Holland, T. Northcutt, R. A. Restrepo, R. Bilodeau, 2013. NASA/Global Change Master Directory (GCMD) Earth Science Keywords. Version 8.0.0.0.0


