Earth
ID: 4524
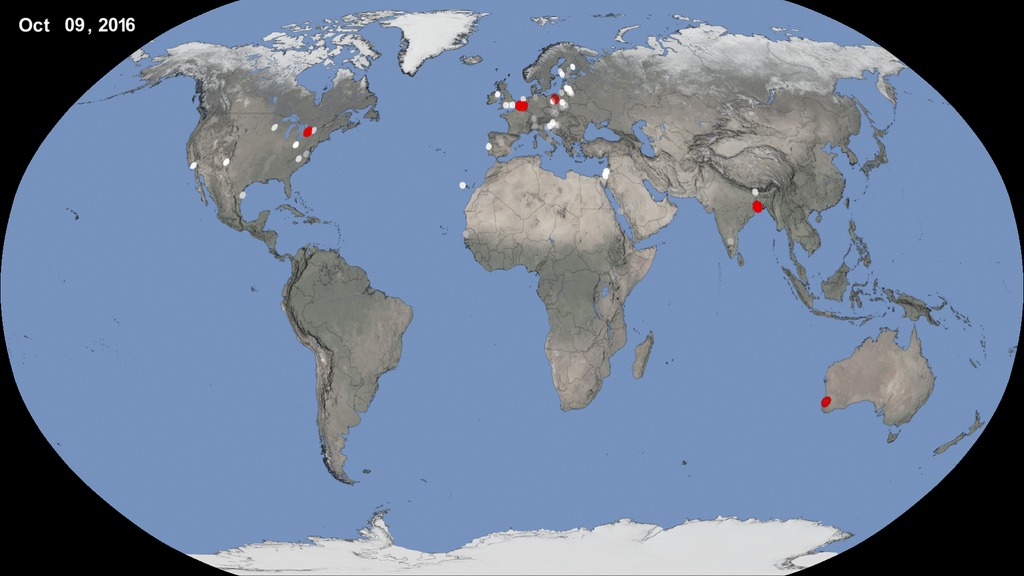
Between October 1 and October 22, NASA asked museums and science centers around the world to participate in a global experiment collecting observations of clouds while NASA satellites were overhead. As part of the part of International Science Center and Science Museum Day (ISCSMD), the experiment built upon UNESCO’s theme of “Science for Peace and Development.” The goal was to create new ways for museums and science centers worldwide to proactively address global sustainability while reaching increasingly diverse audiences. More than 900 cloud observations, including more than 5,500 photos, came in. The white dots on this map show each observation submitted through the app in that period. The red dots represent science centers participating in the global experiment. The observations are distributed internationally.
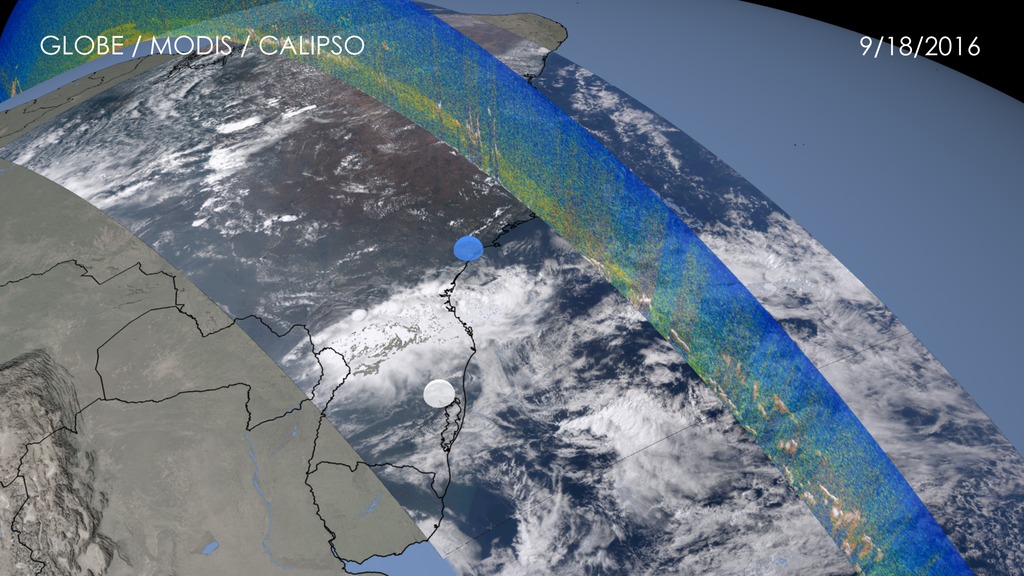
Several of the observations lined up with satellite overpasses, and this video shows three examples (from September 2016) from the early afternoon overpasses of Aqua, CALIPSO,* and CloudSat, NASA satellites that fly together in formation as part of the A-train constellation of satellites. By taking ground-based cloud observations at the same time, citizen scientists are helping NASA scientists interpret the satellite data. Through the GLOBE Observer app, a person can report what kind of clouds are in the atmosphere, estimate how high the clouds are, and indicate how much of the sky is cloudy. Satellites can do some of the same things, but see clouds from above. By combining both citizen and satellite observations, scientists get a much more complete understanding of what is happening in the atmosphere. This will help address questions about changes in the water cycle and freshwater availability.
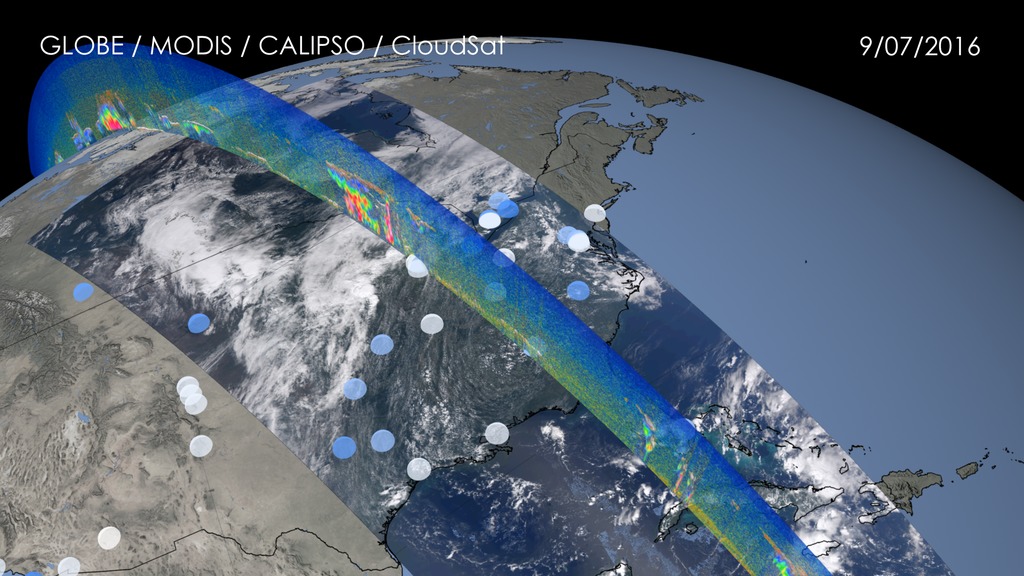
The first satellite example (starting at about 35 seconds) shows an overpass over North America on September 7. Dots represent citizen science observations taken at or near the same time as the overpass. Blue dots represent a report of clear skies, while white dots are cloudy skies. Partially blue dots are partially cloudy skies.
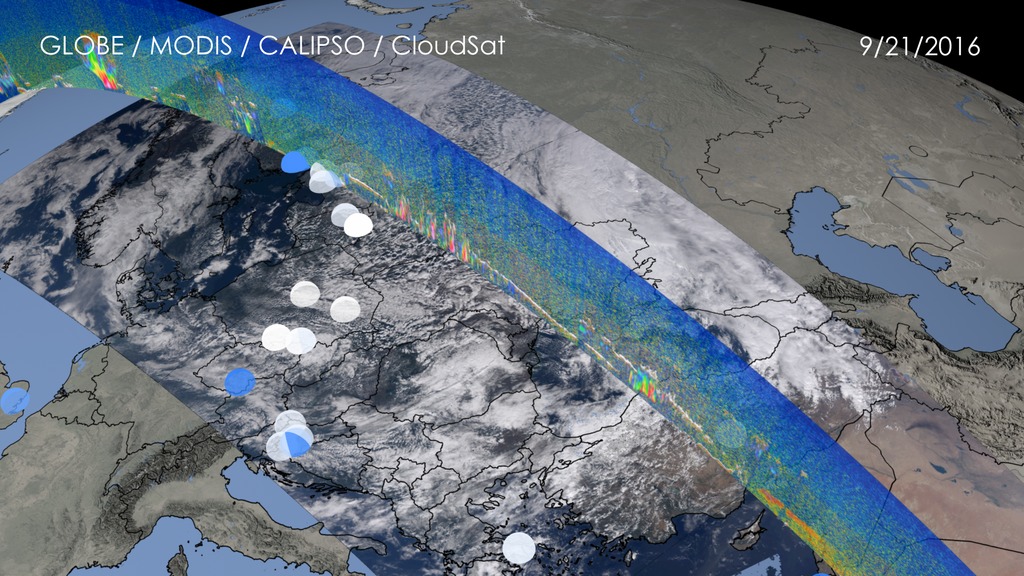
The Moderate Resolution Imaging Spectroradiometer (MODIS) instrument on NASA's Aqua satellite provides a natural color view of clouds over a broad swath of the continent. This view shows the clouds as a person might see them from space. Tiny clouds are scattered across the southern United States corresponding to areas where citizen scientists reported clear skies.
The vertical band shows CALIPSO data from the ground to 30 kilometers into the atmosphere. CALIPSO carries a lidar instrument that uses a laser to measure the vertical structure of thin clouds and aerosols (particles in the atmosphere like pollution, smoke, dust, sea salt, and so forth). Thin clouds and aerosols are difficult to see with other satellites and from the ground. The laser bounces off these features, making it possible to detect them. The scattered yellow band indicates that there were thin clouds and/or aerosols in the atmosphere, even though citizen scientists reported clear skies.
By looking at three different satellites along with citizen science observations, scientists can learn about the structure of cloud systems and better understand what the satellites are measuring. Why do clouds matter so much? Clouds are a key mechanism in distributing fresh water around the planet. In a changing climate, scientists are uncertain how clouds might change, and as a result, how access to fresh water might change.
*CALIPSO is a joint U.S. (NASA)/French (Centre National d’Etudes Spatiales/CNES) mission.
Correlation Between GLOBE Citizen Science and NASA Satellite Observations
Several of the observations lined up with satellite overpasses, and this video shows three examples (from September 2016) from the early afternoon overpasses of Aqua, CALIPSO,* and CloudSat, NASA satellites that fly together in formation as part of the A-train constellation of satellites. By taking ground-based cloud observations at the same time, citizen scientists are helping NASA scientists interpret the satellite data. Through the GLOBE Observer app, a person can report what kind of clouds are in the atmosphere, estimate how high the clouds are, and indicate how much of the sky is cloudy. Satellites can do some of the same things, but see clouds from above. By combining both citizen and satellite observations, scientists get a much more complete understanding of what is happening in the atmosphere. This will help address questions about changes in the water cycle and freshwater availability.
The first satellite example (starting at about 35 seconds) shows an overpass over North America on September 7. Dots represent citizen science observations taken at or near the same time as the overpass. Blue dots represent a report of clear skies, while white dots are cloudy skies. Partially blue dots are partially cloudy skies.
The Moderate Resolution Imaging Spectroradiometer (MODIS) instrument on NASA's Aqua satellite provides a natural color view of clouds over a broad swath of the continent. This view shows the clouds as a person might see them from space. Tiny clouds are scattered across the southern United States corresponding to areas where citizen scientists reported clear skies.
The vertical band shows CALIPSO data from the ground to 30 kilometers into the atmosphere. CALIPSO carries a lidar instrument that uses a laser to measure the vertical structure of thin clouds and aerosols (particles in the atmosphere like pollution, smoke, dust, sea salt, and so forth). Thin clouds and aerosols are difficult to see with other satellites and from the ground. The laser bounces off these features, making it possible to detect them. The scattered yellow band indicates that there were thin clouds and/or aerosols in the atmosphere, even though citizen scientists reported clear skies.
By looking at three different satellites along with citizen science observations, scientists can learn about the structure of cloud systems and better understand what the satellites are measuring. Why do clouds matter so much? Clouds are a key mechanism in distributing fresh water around the planet. In a changing climate, scientists are uncertain how clouds might change, and as a result, how access to fresh water might change.
*CALIPSO is a joint U.S. (NASA)/French (Centre National d’Etudes Spatiales/CNES) mission.
Related
Visualization Credits
Trent L. Schindler (USRA): Lead Visualizer
Roman Kowch (SSAI): Scientist
David Overoye (SSAI): Scientist
Jessica E. Taylor (NASA/LaRC): Scientist
Holli Riebeek (Sigma Space Corporation): Writer
Laurence Schuler (ADNET Systems, Inc.): Technical Support
Ian Jones (ADNET Systems, Inc.): Technical Support
Roman Kowch (SSAI): Scientist
David Overoye (SSAI): Scientist
Jessica E. Taylor (NASA/LaRC): Scientist
Holli Riebeek (Sigma Space Corporation): Writer
Laurence Schuler (ADNET Systems, Inc.): Technical Support
Ian Jones (ADNET Systems, Inc.): Technical Support
Please give credit for this item to:
NASA's Scientific Visualization Studio
NASA's Scientific Visualization Studio
Short URL to share this page:
https://svs.gsfc.nasa.gov/4524
Data Used:
Note: While we identify the data sets used in these visualizations, we do not store any further details nor the data sets themselves on our site.
Keywords:
SVS >> Hyperwall
SVS >> Calipso
SVS >> Cloudsat
SVS >> Earth >> Satellites >> Earth Observing Fleet
SVS >> MODIS
SVS >> Aqua
NASA Science >> Earth
SVS >> Citizen Science
SVS >> GLOBE
https://svs.gsfc.nasa.gov/4524
Data Used:
CloudSat/CPR
Aqua/MODIS/Band 1 (Vis)
CALIPSO/CALIOP/Total Attenuated Backscatter
GLOBE
Observed Data - GLOBE
Environmental observations taken by citizen scientists.
Keywords:
SVS >> Hyperwall
SVS >> Calipso
SVS >> Cloudsat
SVS >> Earth >> Satellites >> Earth Observing Fleet
SVS >> MODIS
SVS >> Aqua
NASA Science >> Earth
SVS >> Citizen Science
SVS >> GLOBE


