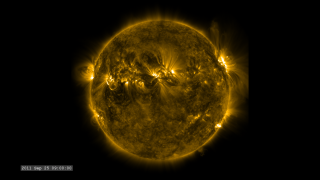
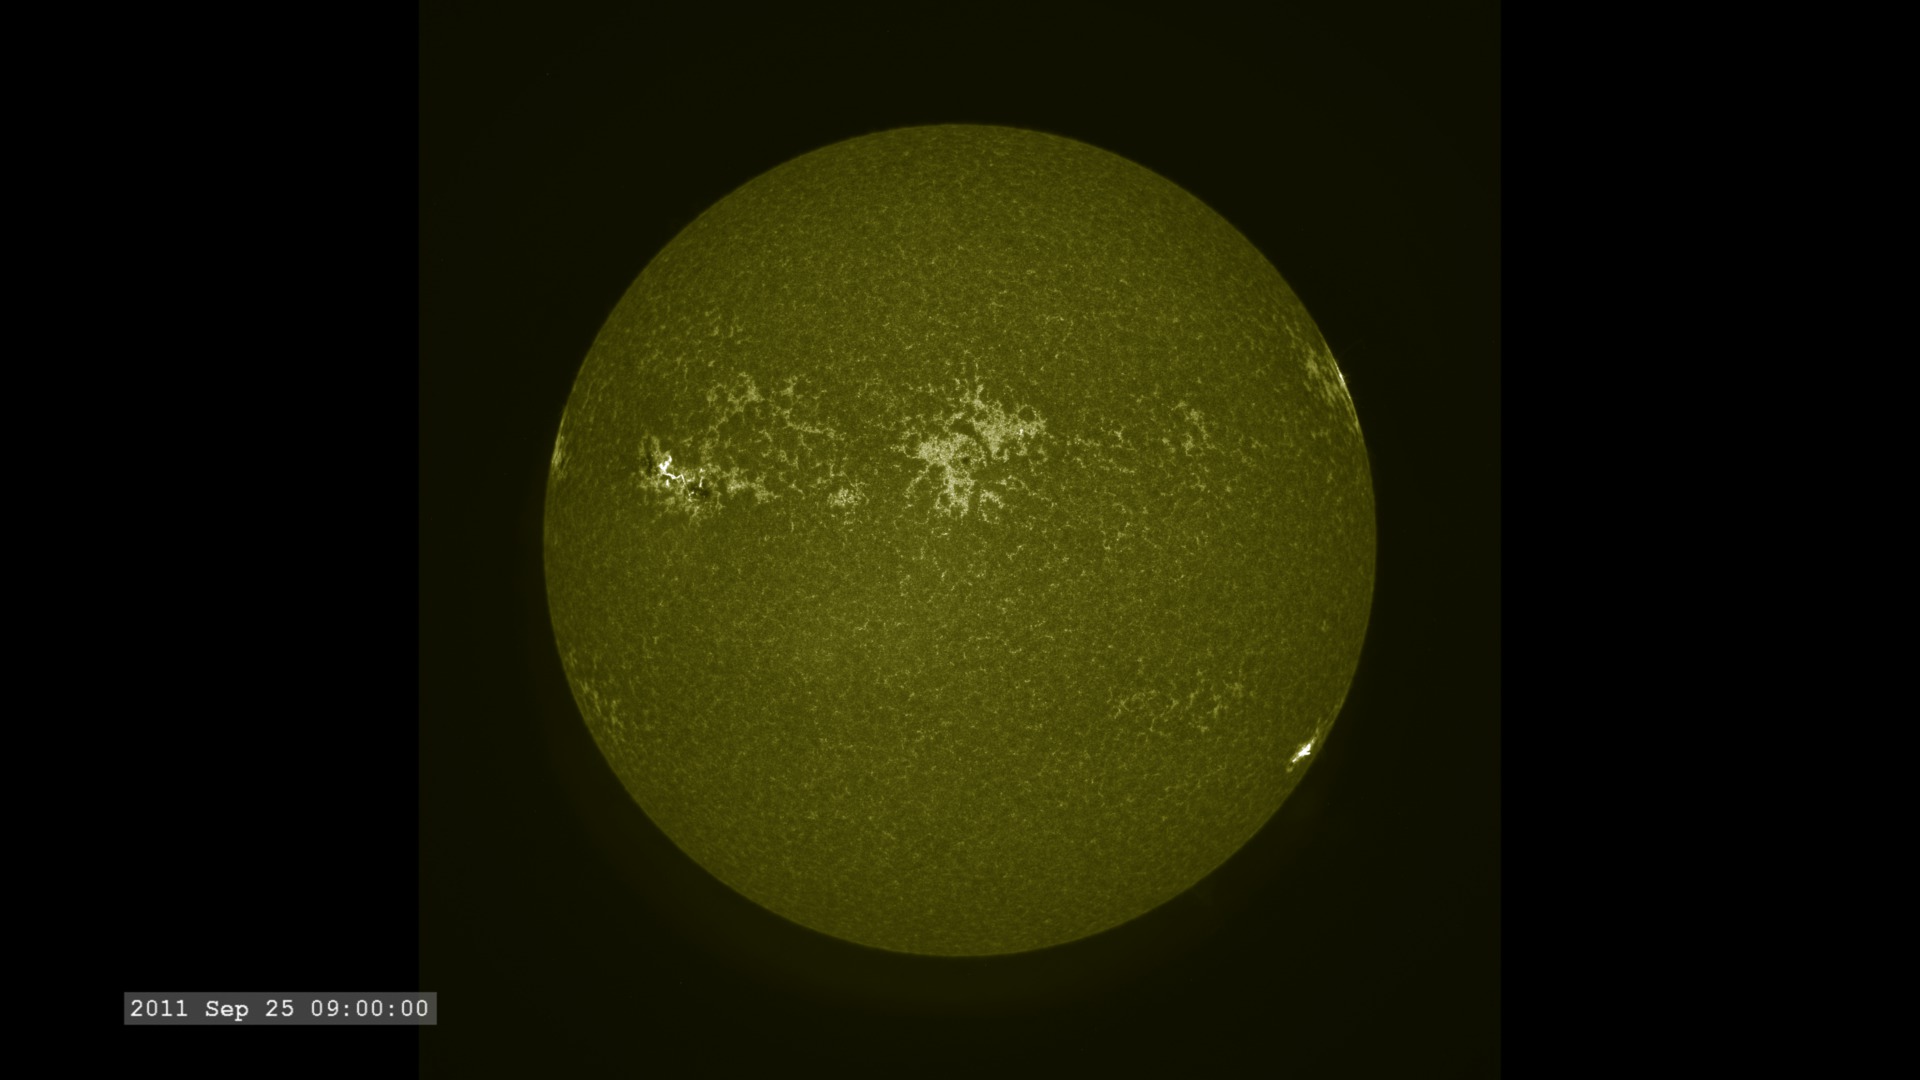
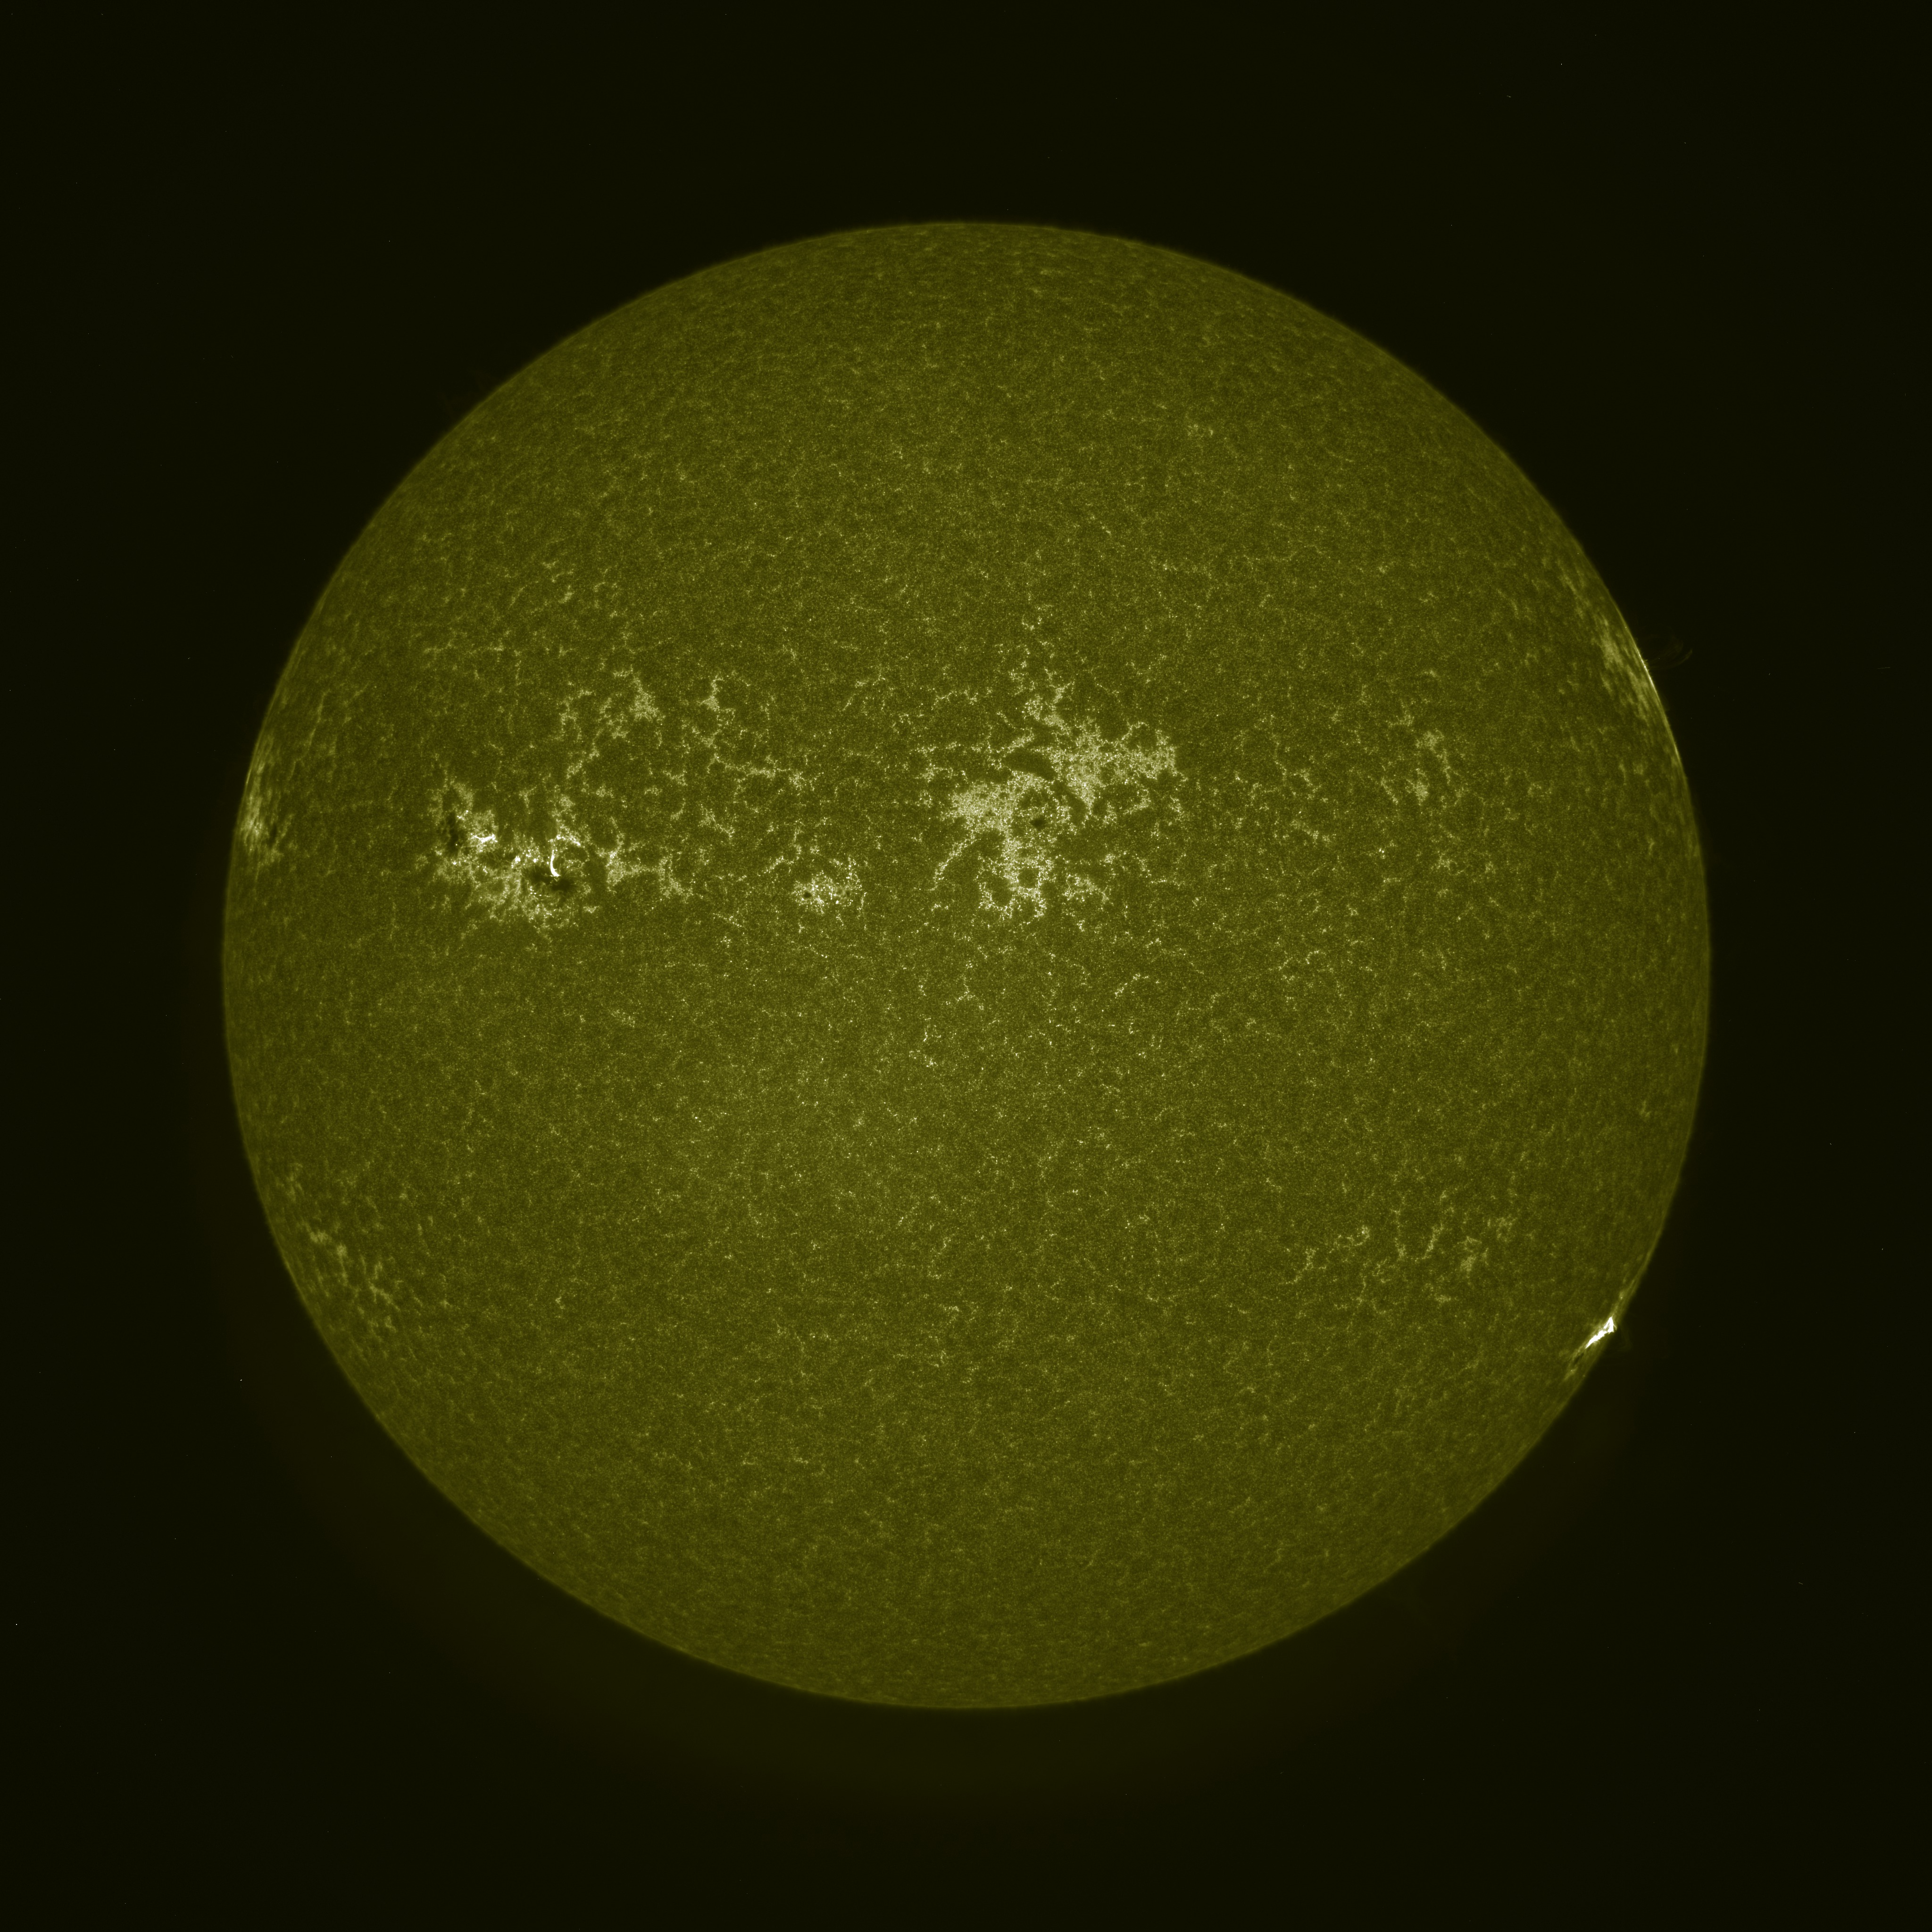
The Active Sun from SDO: 1600 Ångstroms
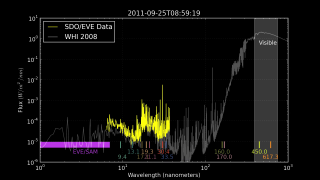
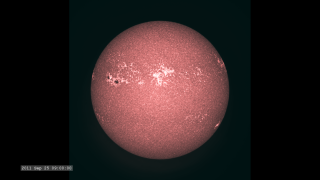
This movie is generated for a wavelength of 1600 Ångstroms (160.0 nanometers) which highlights a spectral line of carbon that has lost 3 electrons (also known as carbon-4 or C-IV) at temperatures of 10,000 K. C IV at these temperatures is present in what's called the transition region between the sun's surface and the lowest levels of the sun's atmosphere, the chromosphere.
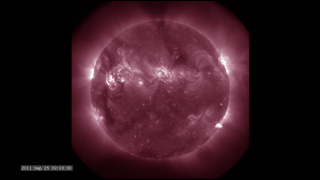
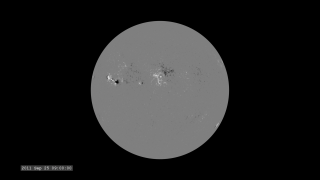
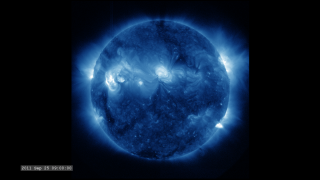
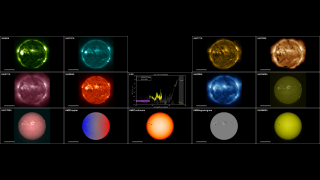
This visualization is one of a set of visualizations (others linked below) covering the same time span of 17 hours over the full wavelength range of the mission. They are setup to play synchronously on a Hyperwall, or can be run individually.
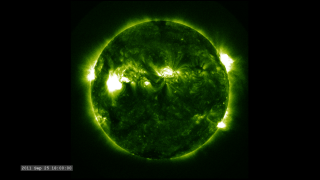
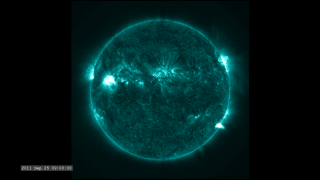
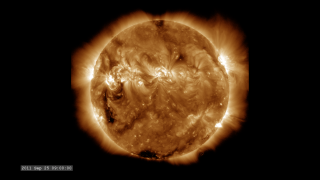
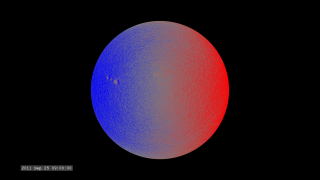
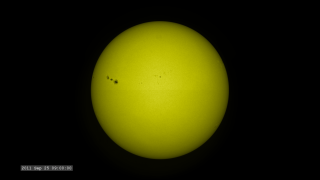
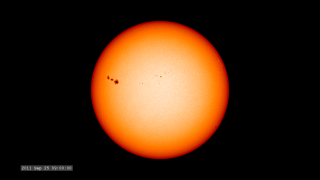
The images are sampled every 36 seconds, 1/3 of the standard time-cadence for SDO. This visualization is useful for illustrating how different solar phenomena, such as sunspots and active regions, look very different in different wavelengths of light. These differences enable scientists to study them more completely, with an eventual goal of improving Space Weather forecasting.
Related
Visualization Credits
Scott Wiessinger (USRA): Producer
Genna Duberstein (USRA): Producer
Phil Chamberlin (NASA/GSFC): Scientist
NASA/Goddard Space Flight Center Scientific Visualization Studio, the SDO Science Team, and the Virtual Solar Observatory.
https://svs.gsfc.nasa.gov/3985
Mission:
SDO
Data Used:
SDO/AIA/1600 Filter also referred to as: AIA 1600
JOINT SCIENCE OPERATIONS CENTER - 2011-09-25T08:00 - 2011-09-26T01:00This item is part of this series:
SDO Jewelbox
Keywords:
SVS >> HDTV
GCMD >> Earth Science >> Sun-earth Interactions >> Solar Activity >> Solar Flares
GCMD >> Earth Science >> Sun-earth Interactions >> Solar Activity >> Solar Ultraviolet
SVS >> Hyperwall
SVS >> SDO
SVS >> Solar Dynamics Observatory
SVS >> Heliophysics
SVS >> Corona
NASA Science >> Sun
GCMD >> Earth Science >> Sun-earth Interactions >> Solar Activity >> Coronal Mass Ejections
SVS >> Far Ultraviolet Imaging
SVS >> FUV Imaging
GCMD keywords can be found on the Internet with the following citation: Olsen, L.M., G. Major, K. Shein, J. Scialdone, S. Ritz, T. Stevens, M. Morahan, A. Aleman, R. Vogel, S. Leicester, H. Weir, M. Meaux, S. Grebas, C.Solomon, M. Holland, T. Northcutt, R. A. Restrepo, R. Bilodeau, 2013. NASA/Global Change Master Directory (GCMD) Earth Science Keywords. Version 8.0.0.0.0


