Earth
ID: 3848
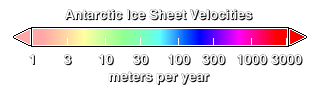
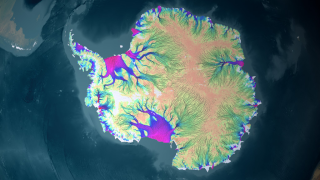
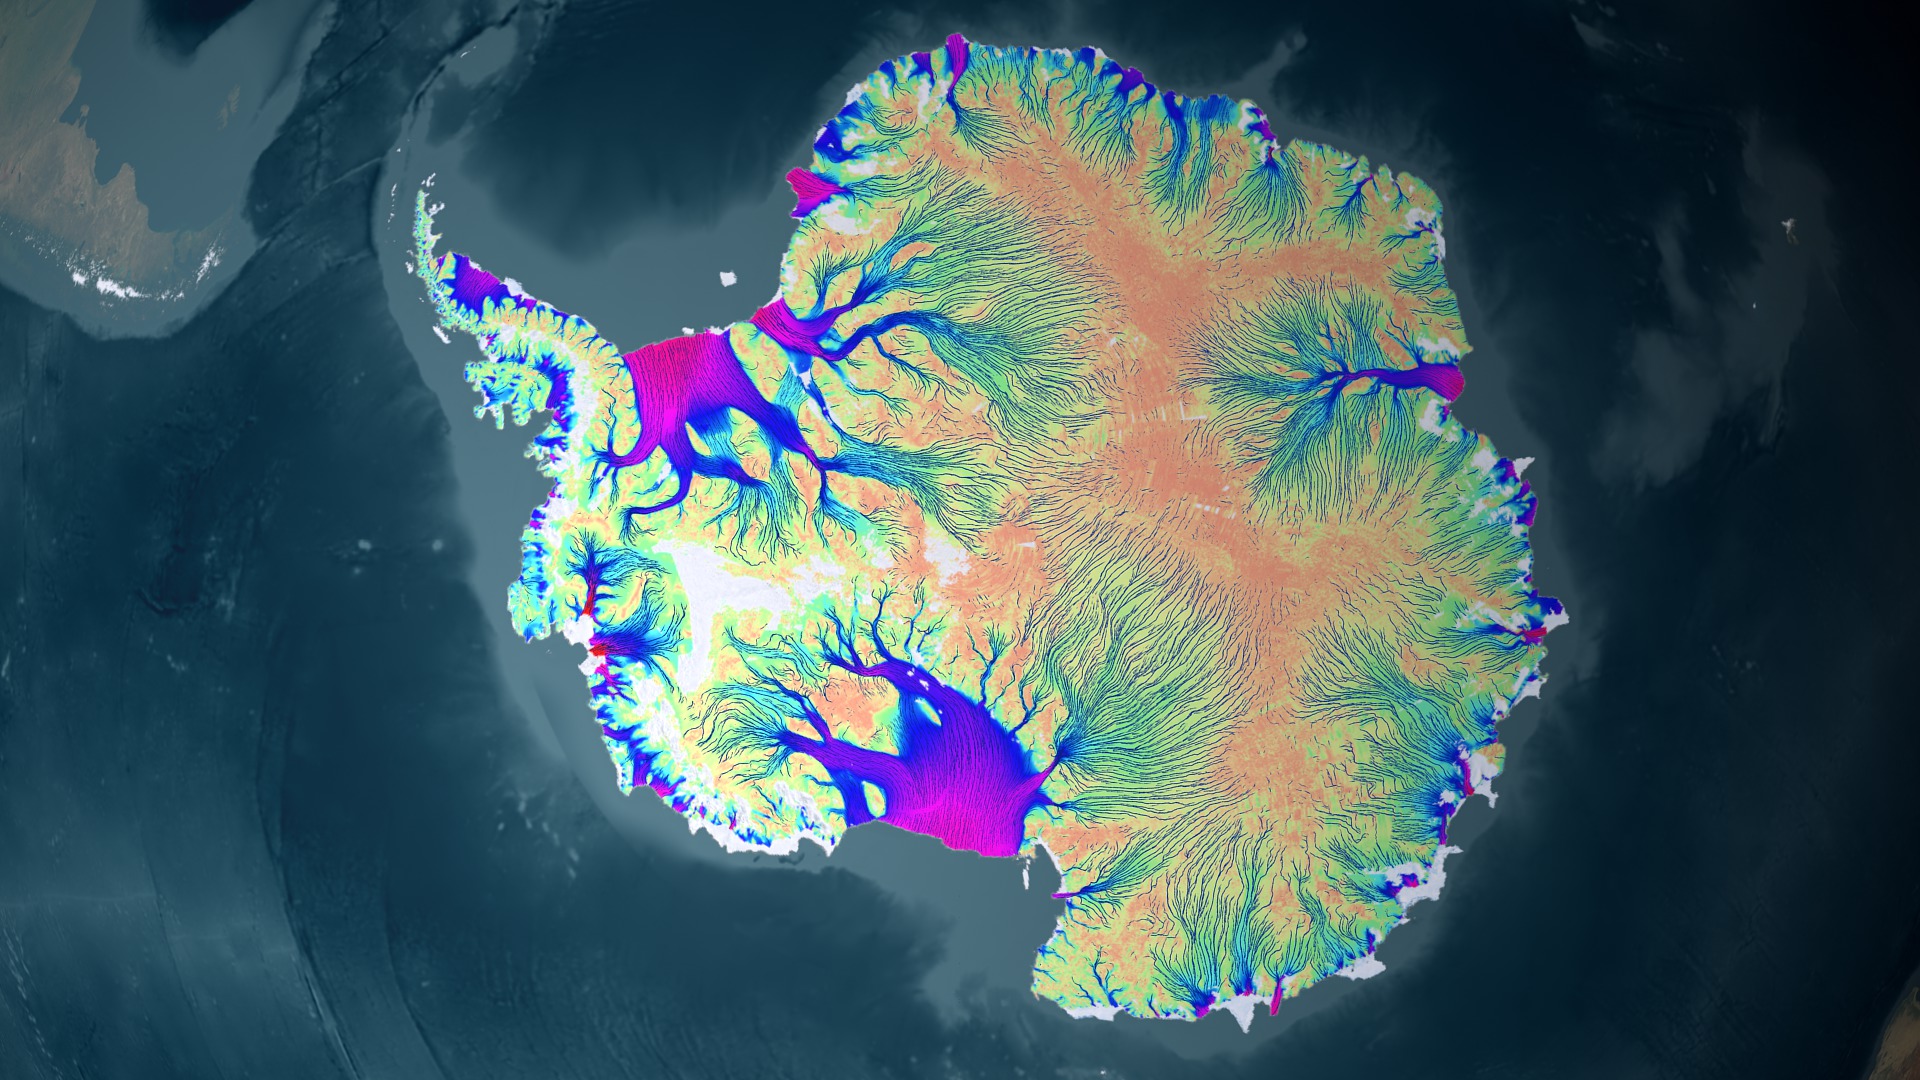
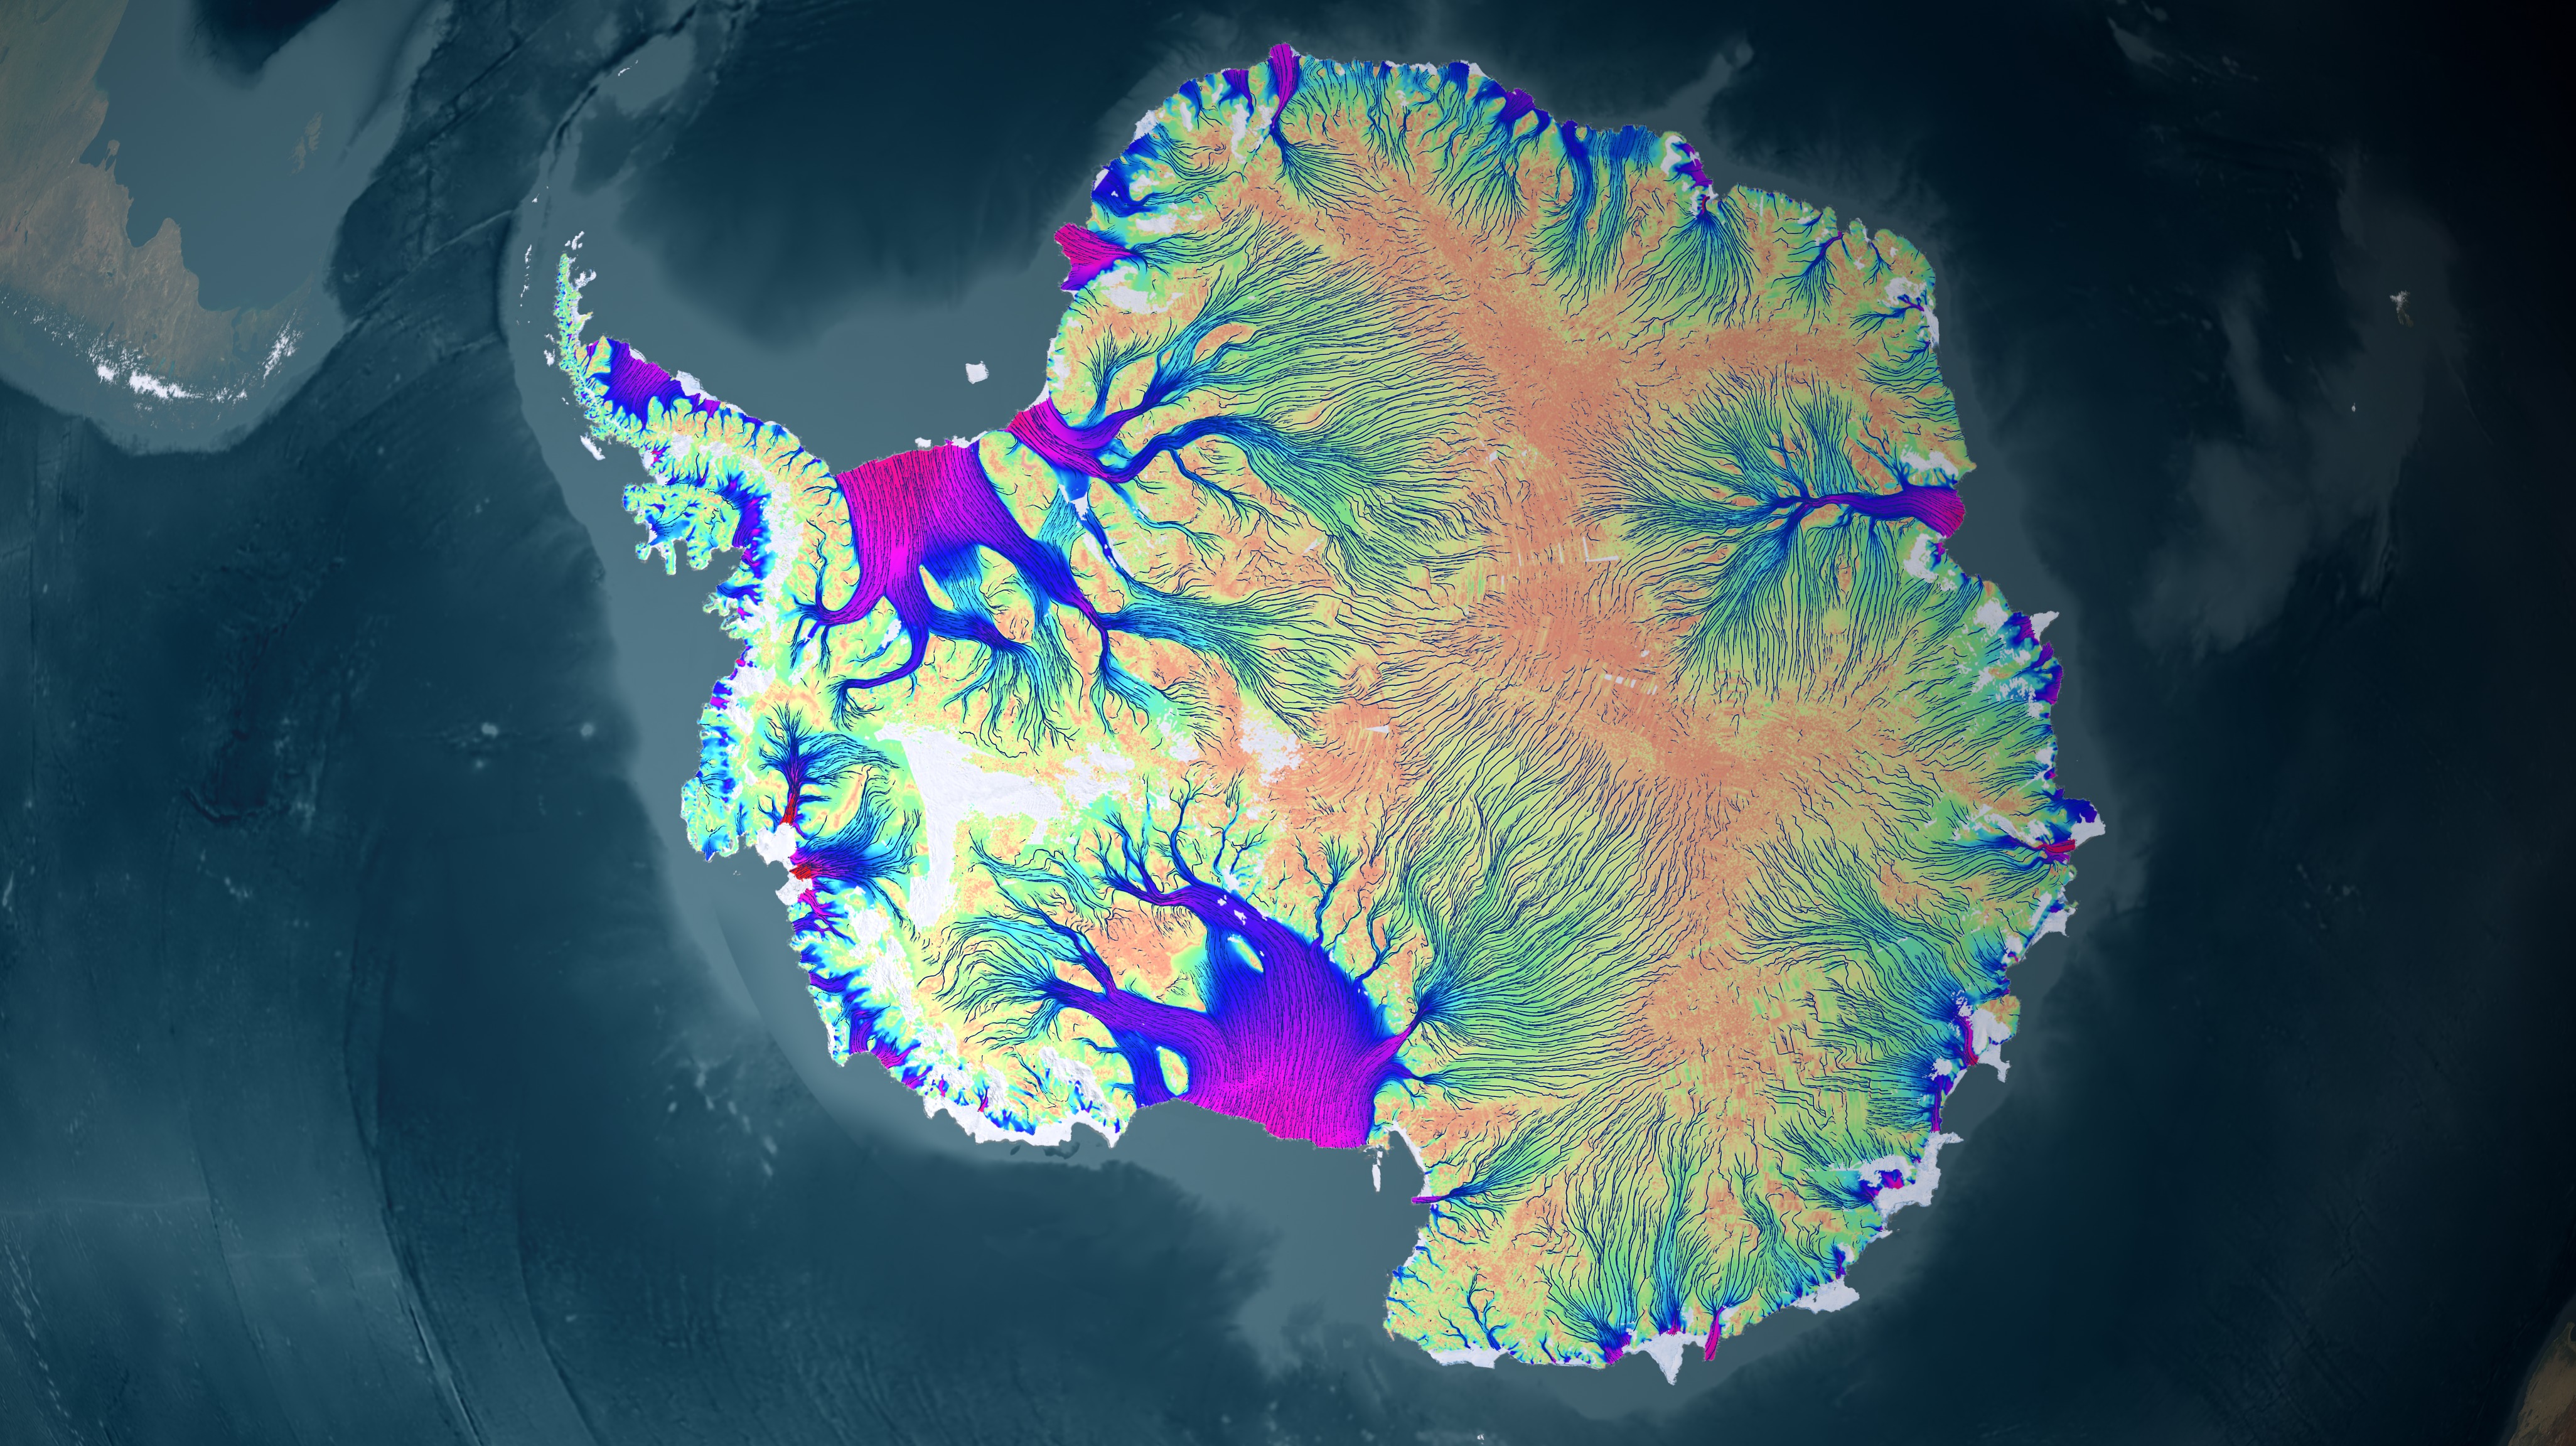
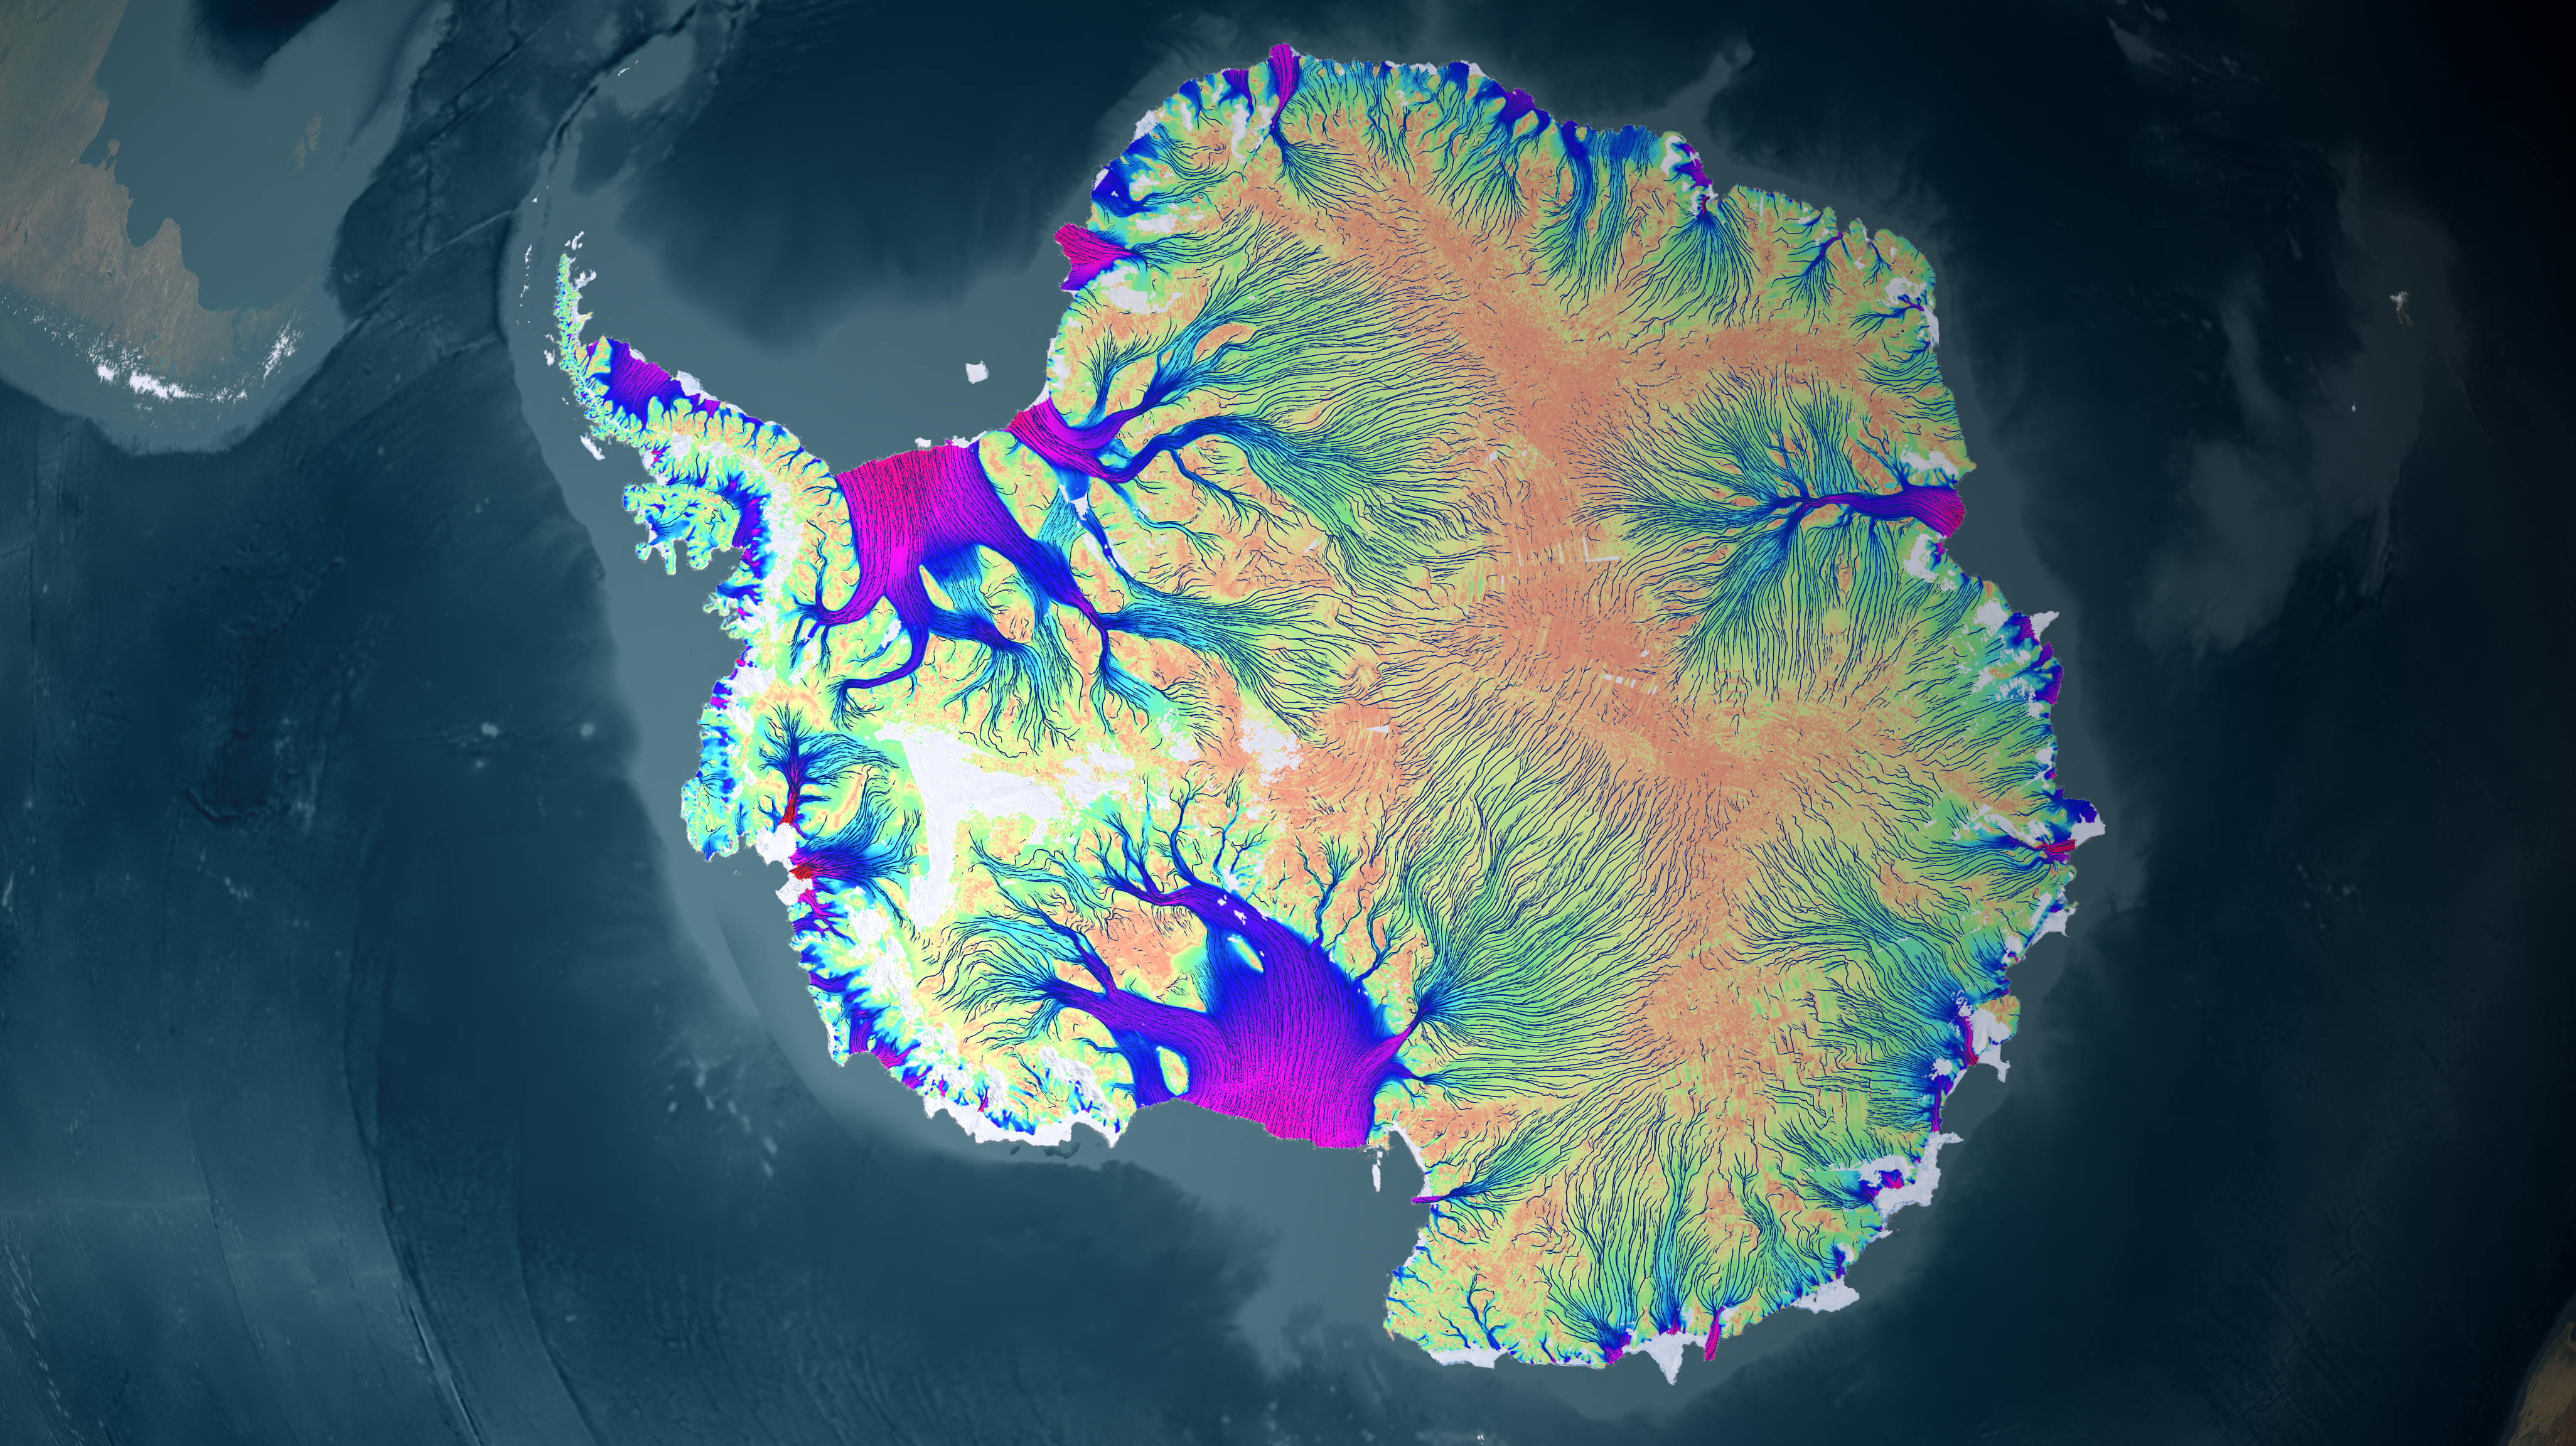
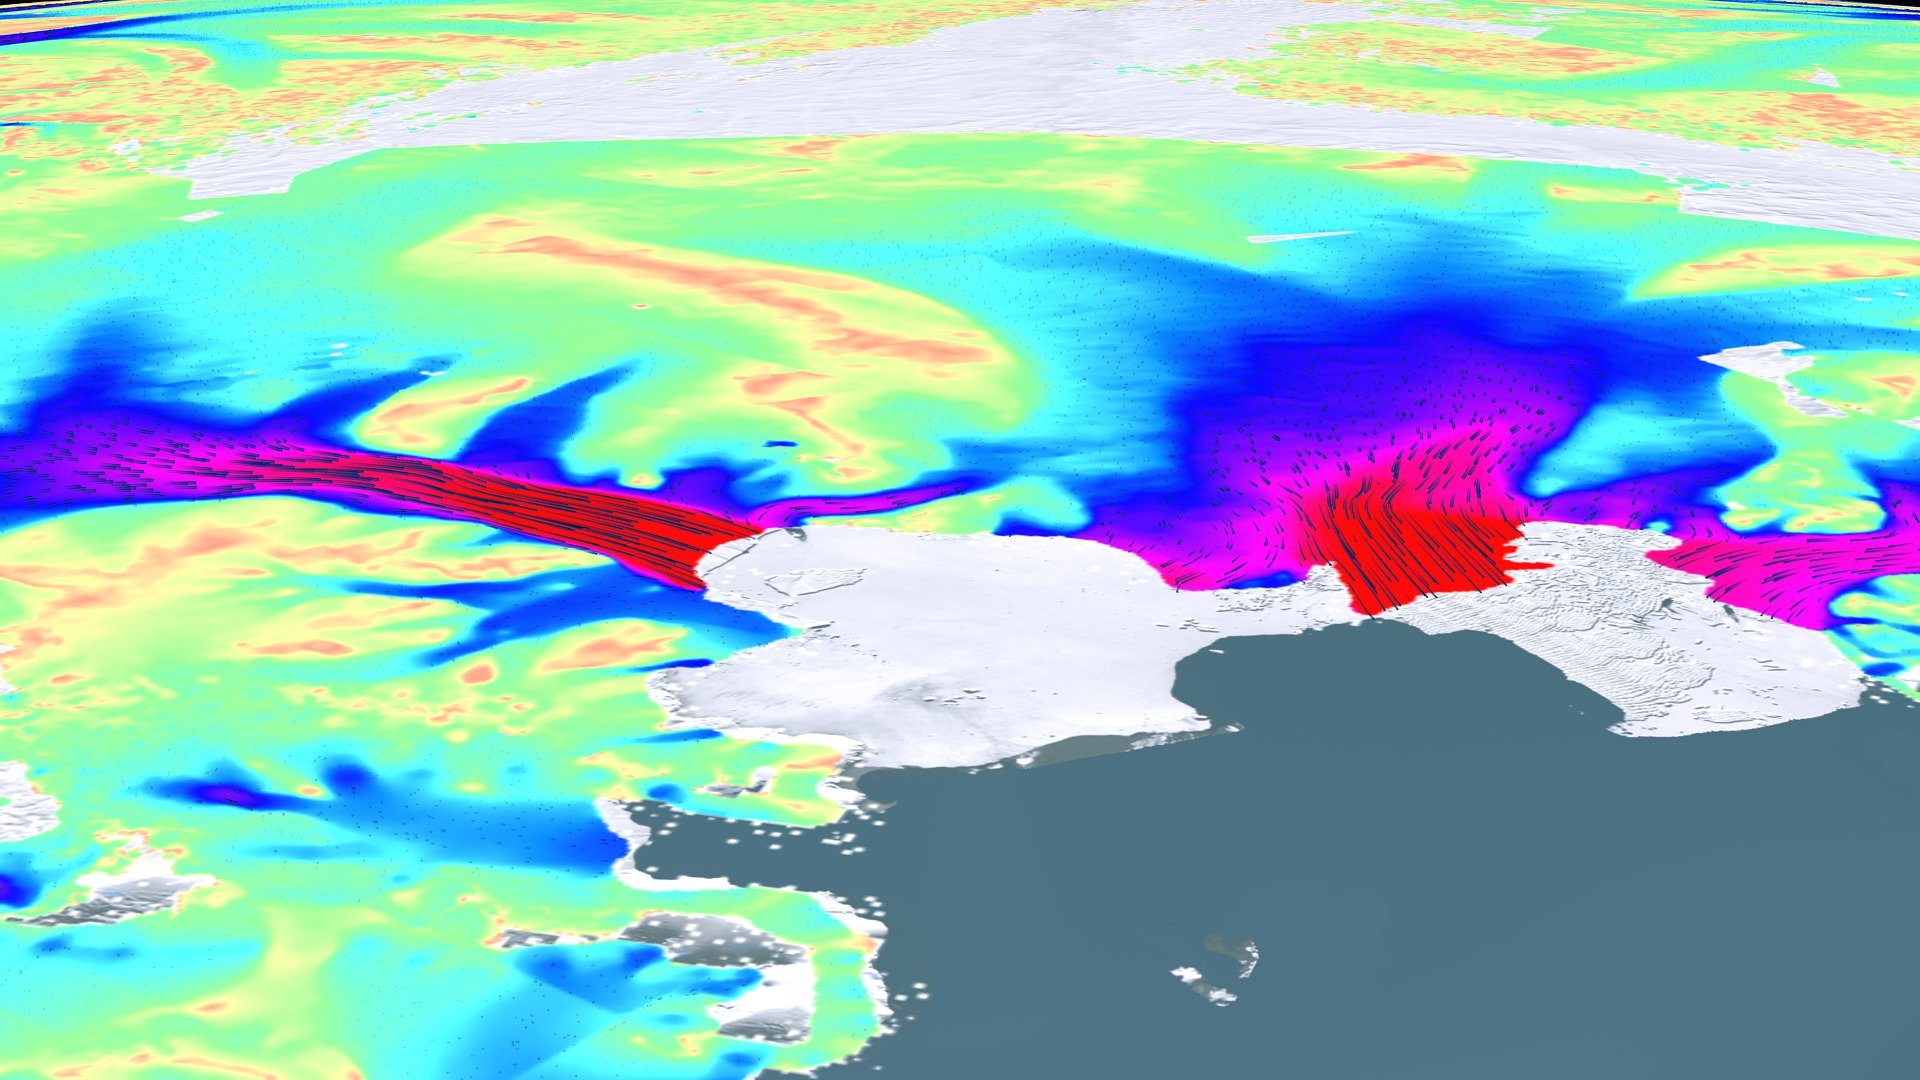
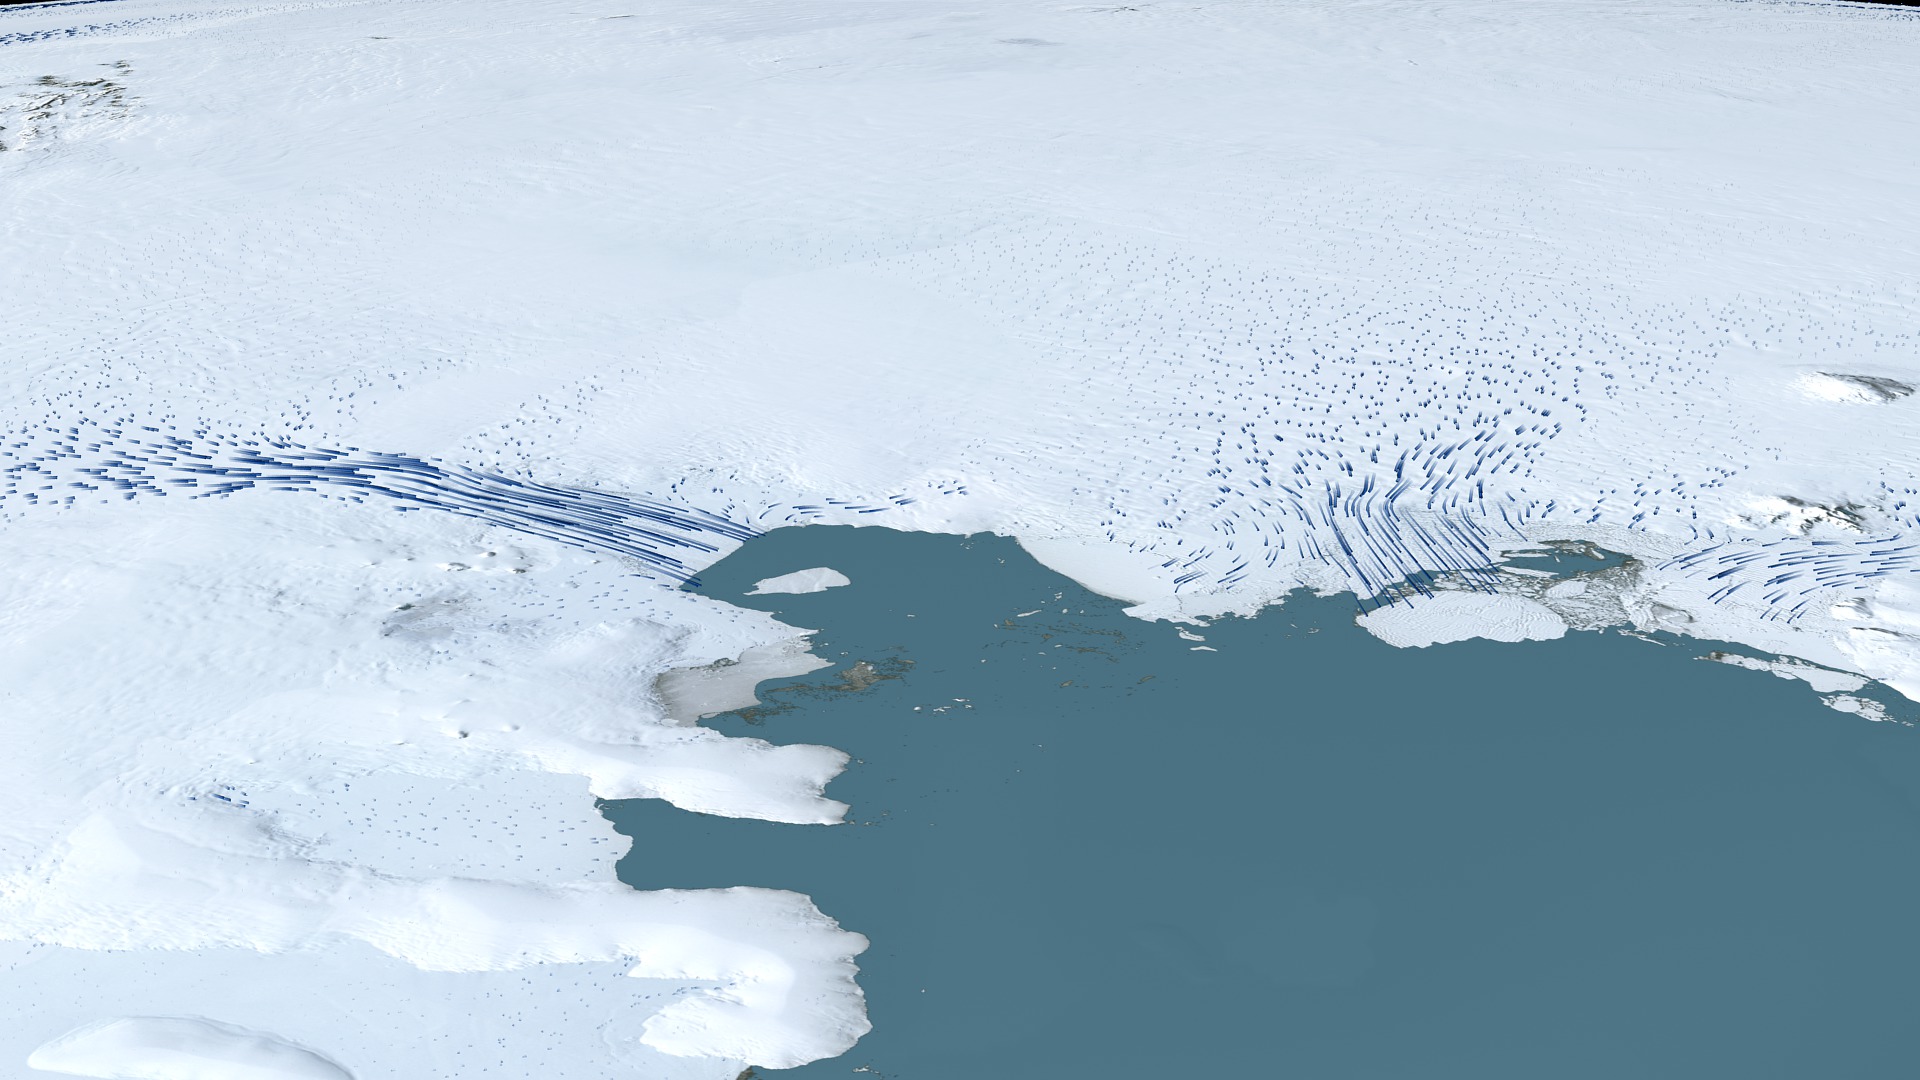
This animation shows the motion of ice in Antarctica as measured by satellite data from CSA, JAXA and ESA processed by a NASA Research Team at UC Irvine. The background image from Landsat (visible imagery) is progressively replaced by a map of ice velocity color coded on a logarithmic scale, with values varying from 1 m/yr (brown to green) to 3,000 m/yr (green to blue and red). The animation does not show where ice is melting but how ice is naturally transported from the interior regions where it accumulates from snowfall to the coastal regions where it is discharged into the ocean as tabular icebergs and ice-shelf melt water. For the purpose of the animation, we are representing hundreds to thousands of years of motion. In the first animation, the dynamic range of the flow has been compressed, with slower flows scaled up in velocity to make visible how the flows feed from the interior of the continent. In the second, the flows speeds are in scale to each other.
NASA Research Leads to First Complete Map of Antarctic Ice Flow
The result illustrates that zones of enhanced motion take their source far into the interior regions of Antarctica, at the foothills of the ridges formed by the ice tops of the continent. This pattern of motion has never been observed on that scale before. These observations have vast implications on our understanding of the flow of ice sheets and how they might respond to climate change in the future and contribute to sea level change.
Differentially-scaled ice velocity
Related
Visualization Credits
Trent L. Schindler (USRA): Lead Animator
Horace Mitchell (NASA/GSFC): Animator
Greg Shirah (NASA/GSFC): Animator
Lori Perkins (NASA/GSFC): Animator
Whitney B Clavin (NASA/JPL CalTech): Producer
Alan Buis (NASA/JPL CalTech): Producer
Janet H. Wilson (University of California, Irvine): Producer
Eric J. Rignot (NASA/JPL CalTech): Scientist
Bernd Scheuchl (University of California, Irvine): Scientist
Jeremie Mouginot (University of California, Irvine): Project Support
Please give credit for this item to:
NASA/Goddard Space Flight Center Scientific Visualization Studio
The satellite data used in this visualization comes from CSA, JAXA and ESA after it is processed by a NASA Research Team at UC Irvine.
NASA/Goddard Space Flight Center Scientific Visualization Studio
The satellite data used in this visualization comes from CSA, JAXA and ESA after it is processed by a NASA Research Team at UC Irvine.
Short URL to share this page:
https://svs.gsfc.nasa.gov/3848
Data Used:
Note: While we identify the data sets used in these visualizations, we do not store any further details nor the data sets themselves on our site.
Keywords:
SVS >> HDTV
SVS >> Hyperwall
NASA Science >> Earth
SVS >> Presentation
https://svs.gsfc.nasa.gov/3848
Data Used:
Landsat-7/ETM+/Landsat Image Mosaic of Antarctica also referred to as: LIMA
Mosaic - NASA/GSFC, British Antarctic Survey, USGS EROS Data Center
Mosaicing to avoid clouds produced a high quality, nearly cloud-free benchmark data set of Antarctica for the International Polar Year from images collected primarily during 1999-2003.
Keywords:
SVS >> HDTV
SVS >> Hyperwall
NASA Science >> Earth
SVS >> Presentation


