Earth
ID: 30177
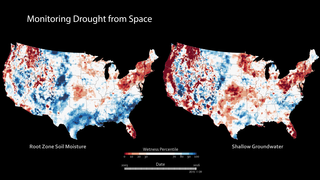
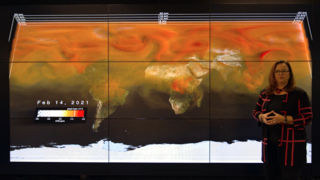
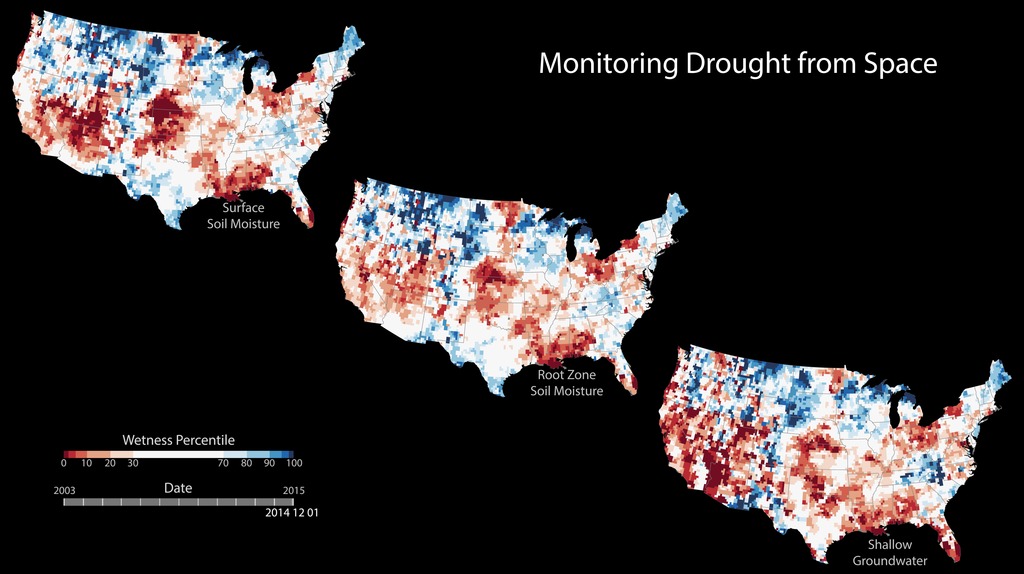
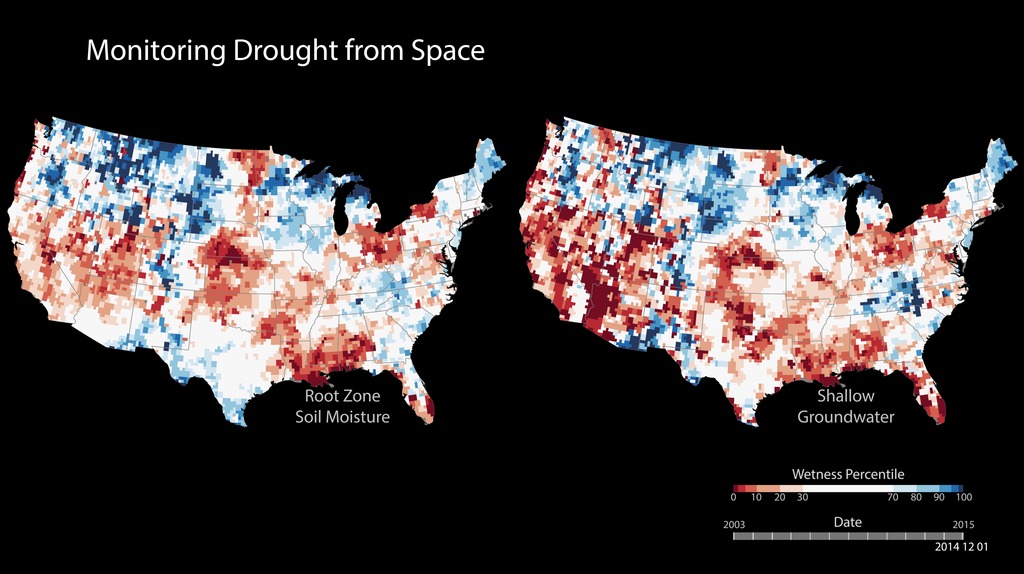
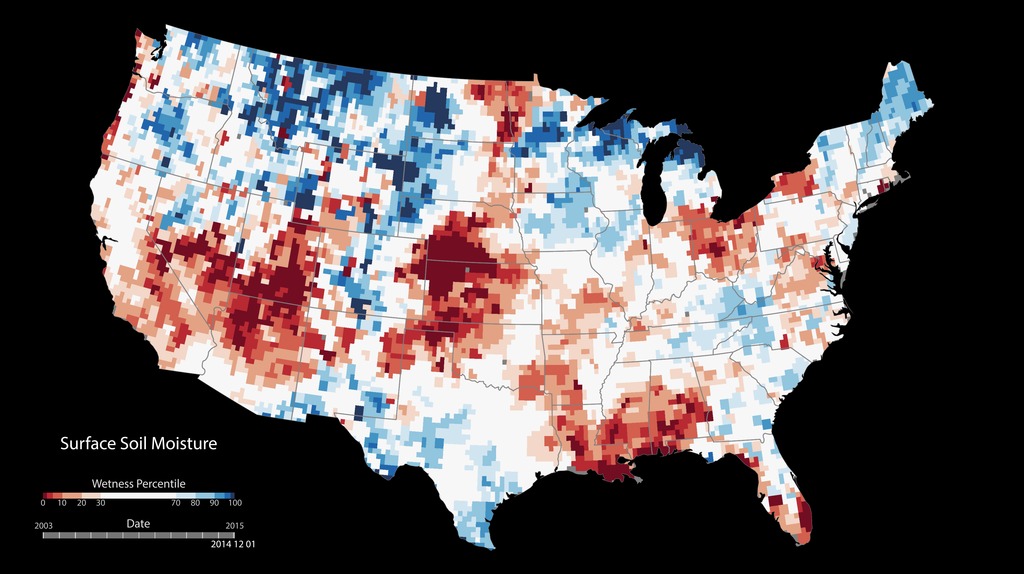
These maps combine data from the twin satellites of the Gravity Recovery and Climate Experiment (GRACE) with other satellite and ground-based measurements to model the relative amount of water stored at three different levels: at the surface, at plant root level and underground from January 2003 to December 2014. The wetness, or water content, of each layer is compared to the average between 1948 and 2009. The darkest red regions represent dry conditions that should occur only 2 percent of the time (about once every 50 years). All of the maps are experimental products funded by NASA’s Applied Sciences Program and developed by scientists at NASA’s Goddard Space Flight Center and the National Drought Mitigation Center. The maps do not attempt to represent human consumption of water; but rather, they show changes in water storage related to weather, climate, and seasonal patterns.
Measuring Soil Moisture from Space
There is a newer version of this story located here: https://svs.gsfc.nasa.gov/30730
Newer Version
For More Information
Credits
Marit Jentoft-Nilsen: Project Support
Mark Malanoski (GST): Project Support
Heather Hanson (GST): Writer
Mark Malanoski (GST): Project Support
Heather Hanson (GST): Writer
Please give credit for this item to:
NASA
NASA
Short URL to share this page:
https://svs.gsfc.nasa.gov/30177
Mission:
Gravity Recovery and Climate Experiment (GRACE)
Data Used:
Note: While we identify the data sets used in these visualizations, we do not store any further details nor the data sets themselves on our site.
Keywords:
SVS >> HDTV
GCMD >> Earth Science >> Climate Indicators >> Drought Indices
GCMD >> Earth Science >> Hydrosphere >> Ground Water
SVS >> Hyperwall
NASA Science >> Earth
SVS >> Presentation
GCMD >> Earth Science >> Climate Indicators >> Land Surface/agriculture Indicators >> Drought Indices
GCMD >> Earth Science >> Human Dimensions >> Natural Hazards >> Droughts
GCMD keywords can be found on the Internet with the following citation: Olsen, L.M., G. Major, K. Shein, J. Scialdone, S. Ritz, T. Stevens, M. Morahan, A. Aleman, R. Vogel, S. Leicester, H. Weir, M. Meaux, S. Grebas, C.Solomon, M. Holland, T. Northcutt, R. A. Restrepo, R. Bilodeau, 2013. NASA/Global Change Master Directory (GCMD) Earth Science Keywords. Version 8.0.0.0.0
https://svs.gsfc.nasa.gov/30177
Mission:
Gravity Recovery and Climate Experiment (GRACE)
Data Used:
Gravity Recovery and Climate Experiment (GRACE)
Keywords:
SVS >> HDTV
GCMD >> Earth Science >> Climate Indicators >> Drought Indices
GCMD >> Earth Science >> Hydrosphere >> Ground Water
SVS >> Hyperwall
NASA Science >> Earth
SVS >> Presentation
GCMD >> Earth Science >> Climate Indicators >> Land Surface/agriculture Indicators >> Drought Indices
GCMD >> Earth Science >> Human Dimensions >> Natural Hazards >> Droughts
GCMD keywords can be found on the Internet with the following citation: Olsen, L.M., G. Major, K. Shein, J. Scialdone, S. Ritz, T. Stevens, M. Morahan, A. Aleman, R. Vogel, S. Leicester, H. Weir, M. Meaux, S. Grebas, C.Solomon, M. Holland, T. Northcutt, R. A. Restrepo, R. Bilodeau, 2013. NASA/Global Change Master Directory (GCMD) Earth Science Keywords. Version 8.0.0.0.0


